
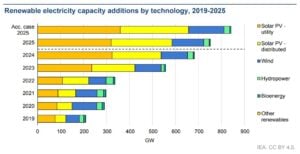
The world’s renewable energy sector has entered a new phase of record growth. According to the International Energy Agency’s Renewables 2025 report, global renewable power capacity grew by more than 510 gigawatts (GW) in 2024 — the fastest increase ever recorded. Another 520 GW is expected to be added in 2025, pushing renewables to account for over 90% of all new global power capacity.
Solar and wind dominate this growth. By 2025, solar will account for nearly three-quarters of new installations. This growth comes from cheaper technology, improved grid integration, and supportive policies. Wind power is also recovering after a slowdown in 2022–2023, supported by new offshore projects in Europe, China, and the United States.
The IEA says the world’s total renewable capacity will reach nearly 5,800 GW by 2025, up from around 4,200 GW in 2023. That means renewables now generate about 30% of global electricity and are on track to reach 42–45% by 2030.
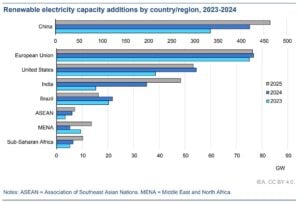
Four regions — China, Europe, the United States, and India — are responsible for almost 90% of this global expansion. Each is moving at a different pace, but together they are transforming how the world produces and consumes energy.
Europe: Accelerating the Energy Transition
Europe continues to lead in energy policy and innovation. In 2024, the European Union added more than 70 GW of new renewable capacity, driven mainly by solar. This is a record year. It shows the bloc’s goal to cut reliance on imported fossil fuels. They aim to meet their Green Deal target of a 55% emissions reduction by 2030.
Solar capacity across the EU doubled between 2020 and 2024, reaching over 300 GW, while wind capacity passed 220 GW. The IEA predicts that Europe will add 450 GW of renewables from 2025 to 2030. This will raise the total capacity to almost 870 GW by the end of the decade.
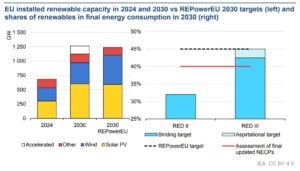
Much of this growth is tied to the REPowerEU plan, which aims to speed up permitting and expand rooftop solar. Offshore wind is gaining popularity. Countries like Germany, Denmark, and the Netherlands are investing in North Sea projects.
Despite progress, Europe faces challenges. Delays in grid expansion and limited local manufacturing capacity for wind turbines have created supply bottlenecks. Even so, strong policy support and high carbon prices still make renewables the best choice for power generation.
United States: Policy Support and Private Investment Drive Expansion
The United States is entering a period of major renewable growth, supported by the Inflation Reduction Act (IRA) and record private investment. The IEA expects the U.S. to add around 400 GW of new renewable capacity by 2030, effectively doubling its current base.
In 2024, U.S. solar installations rose by nearly 40%, reaching 45 GW for the year. Solar now accounts for the largest share of new capacity additions. Wind power also recovered, with onshore and offshore projects expanding in Texas, California, and along the East Coast.
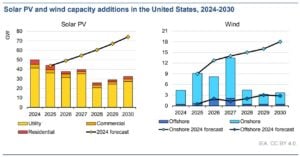
Renewables currently generate about 26% of U.S. electricity, up from 22% in 2022. The IEA projects this share will climb to over 40% by 2030, driven by federal tax incentives and falling technology costs.
Battery storage is another fast-growing sector. Storage capacity doubled between 2023 and 2024, helping stabilize variable solar and wind output. The IRA’s clean energy credits could draw over $400 billion in investments by 2032. This boost will help generate energy and support U.S. manufacturing of solar panels and turbines.
Challenges remain. The U.S. needs to modernize its grid and streamline permitting for transmission lines to connect renewable projects to demand centers. But the direction is clear — renewables are becoming the backbone of America’s energy system.
China: The Global Powerhouse of Renewables
China remains the undisputed leader in renewable energy growth. The IEA projects that China will account for about 60% of all new renewable capacity added worldwide by 2030.
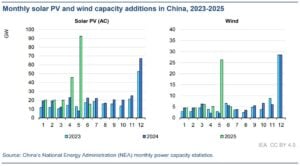
In 2024 alone, China installed more than 260 GW of new renewables — more than the rest of the world combined. Solar made up the majority of this, with over 190 GW of solar capacity added during the year.
Wind power grew by 60 GW. China kept building big onshore and offshore projects in Inner Mongolia, coastal areas, and deserts.
China now has an estimated 1,400 GW of total renewable capacity, representing about half of the global total. Renewables already supply more than 35% of China’s electricity, up from 27% in 2020.
Government policy is the key driver. China aims to reach 1,200 GW of combined solar and wind capacity by 2030, a target it is likely to achieve five years early. The country’s large manufacturing base keeps equipment prices low globally. This helps other regions grow their clean energy fleets.
Still, integration challenges persist. Some provinces face grid congestion and curtailment — when renewable power can’t be used due to transmission limits. The IEA recommends that China continue to invest in grid upgrades and flexible storage systems to handle its rapid growth.
India: The Fastest-Growing Emerging Market for Renewables
India is now the fastest-growing renewable energy market among developing economies. The IEA expects India’s renewable capacity to nearly double between 2023 and 2030, expanding from around 190 GW to 360–380 GW.
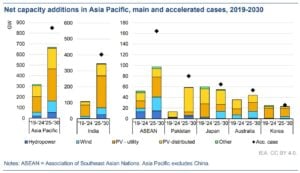
Solar energy is leading the charge. In 2024, India added more than 17 GW of solar capacity, supported by large auctions and declining costs. Wind capacity also grew modestly, and new hybrid projects combining solar and wind are improving reliability.
The government’s goal is ambitious: 500 GW of non-fossil capacity by 2030, which would cover about 50% of total power demand. India is also expanding its domestic solar manufacturing base to reduce dependence on imports.
Hydropower and bioenergy continue to play supporting roles, particularly in rural electrification. The IEA reports that renewable energy in India cuts over 250 million tonnes of CO₂ emissions each year. This makes India a major player in global emission reductions, second only to China.
However, financing and grid infrastructure remain key hurdles. The report notes that India needs annual clean energy investments of about $60–70 billion through 2030 to meet its targets.
The chart below compares renewable energy capacity in 2024 vs. 2030 projections for the four key regions, based on the IEA Renewables 2025 report.
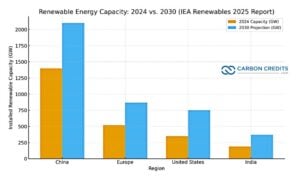
It clearly shows China’s dominant position, followed by steady growth in Europe and the U.S., and rapid expansion in India’s renewable capacity by the end of the decade.
The Decade of Clean Power: A Turning Point for Global Energy
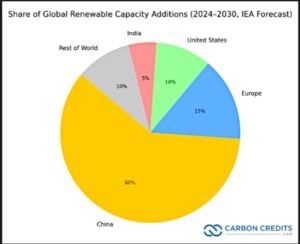
The combined momentum of China, Europe, the United States, and India is reshaping global energy markets. Together, these four regions will account for almost 90% of all renewable capacity growth by 2030.
The pie chart shows each region’s share of total global renewable capacity additions from 2024 to 2030, based on the IEA forecast. It also shows how dominant China remains in driving renewable expansion, while Europe, the U.S., and India together account for about one-third of the world’s clean-energy growth.
Global renewable electricity capacity is expected to surpass 6,200 GW in 2025 and reach 8,300 GW by 2030 — roughly triple the total in 2015. Solar will remain the dominant source, followed by wind and hydropower.
Yet challenges persist. The IEA warns that grid constraints, permitting delays, and uneven financing could slow progress in developing economies. To stay on track for the net-zero pathway, annual renewable additions must rise to around 800 GW per year by 2030.
Still, the direction is clear. The world is entering a decade where clean power becomes the main driver of growth, investment, and energy security. The actions of these four key players will determine how fast the transition happens and how close we come to a truly sustainable global energy system.
- FURTHER READING: Renewable Energy Investment Reaches Record High as China Operates World’s Biggest Solar Farm
The post Renewables 2025: How China, the US, Europe, and India Are Leading the World’s Clean Energy Growth appeared first on Carbon Credits.
Every business carbon footprint report ends with a number, the amount of carbon emissions produced by the business, less the amount of carbon reduced and offset, given in tonnes of CO₂. Many of the people who sign off on that number, including those who paid for it, cannot picture what it represents on the ground. A tonne is a unit of mass. CO₂ is invisible. The link between the amount offset in the report and a real piece of restored forest somewhere in the world is almost never indicated.
![]()
Americans are paying more for insurance, electricity, taxes, and home repairs every year. What many people may not realize is that climate change is already one of the drivers behind those rising costs.
For many households, climate change is no longer just an environmental issue. It is becoming a cost-of-living issue. While climate impacts like melting glaciers and shrinking polar ice can feel distant from everyday life, the financial effects are already showing up in monthly budgets across the country.
Today, a larger share of household income is consumed by fixed costs such as housing, insurance, utilities, and healthcare. (3) Climate change and climate inaction are adding pressure to many of those expenses through higher disaster recovery costs, rising energy demand, infrastructure repairs, and increased insurance risk.
The goal of this article is to help connect climate change to the everyday financial realities people already experience. Regardless of where someone stands on climate policy, it is important to recognize that climate change is already increasing costs for households, businesses, and taxpayers across the United States.
More conservative estimates indicate that the average household has experienced an increase of about $400 per year from observed climate change, while less conservative estimates suggest an increase of $900.(1) Those in more disaster-prone regions of the country face disproportionate costs, with some households experiencing climate-related costs averaging $1,300 per year.(1) Another study found that climate adaptation costs driven by climate change have already consumed over 3% of personal income in the U.S. since 2015.(9) By the end of the century, housing units could spend an additional $5,600 on adaptation costs.(1)
Whether we realize it or not, Americans are already paying for climate change through higher insurance premiums, energy costs, taxes, and infrastructure repairs. These growing expenses are often referred to as climate adaptation costs.
Without meaningful climate action, these costs are expected to continue rising. Choosing not to invest in climate action is also choosing to spend more on climate adaptation.
Here are a few ways climate change is already increasing the cost of living:
- Higher insurance costs from more frequent and severe storms
- Higher energy use during longer and hotter summers
- Higher electricity rates tied to storm recovery and grid upgrades
- Higher government spending and taxpayer-funded disaster recovery costs
The real debate is not whether climate change costs money. Americans are already paying for it. The question is where we want those costs to go. Should we invest more in climate action to help reduce future climate adaptation costs, or continue paying growing recovery and adaptation expenses in everyday life?
How Climate Change Is Increasing Insurance Costs
There is one industry that closely tracks the financial impact of natural disasters: insurance. Insurance companies are focused on assessing risk, estimating damages, and collecting enough revenue to cover losses and remain financially stable.
Comparing the 20-year periods 1980–1999 and 2000–2019, climate-related disasters increased 83% globally from 3,656 events to 6,681 events. The average time between billion-dollar disasters dropped from 82 days during the 1980s to 16 days during the last 10 years, and in 2025 the average time between disasters fell to just 10 days. (6)
According to the reinsurance firm Munich Re, total economic losses from natural disasters in 2024 exceeded $320 billion globally, nearly 40% higher than the decade-long annual average. Average annual inflation-adjusted costs more than quadrupled from $22.6 billion per year in the 1980s to $102 billion per year in the 2010s. Costs increased further to an average of $153.2 billion annually during 2020–2024, representing another 50% increase over the 2010s. (6)
In the United States, billion-dollar weather and climate disasters have also increased significantly. The average number of billion-dollar disasters per year has grown from roughly three annually during the 1980s to 19 annually over the last decade. In 2023 and 2024, the U.S. recorded 28 and 27 billion-dollar disasters respectively, both setting new records. (6)
The growing impact of climate change is one reason insurance costs continue to rise. “There are two things that drive insurance loss costs, which is the frequency of events and how much they cost,” said Robert Passmore, assistant vice president of personal lines at the Property Casualty Insurers Association of America. “So, as these events become more frequent, that’s definitely going to have an impact.” (8)
After adjusting for inflation, insurance costs have steadily increased over time. From 2000 to 2020, insurance costs consistently grew faster than the Consumer Price Index due to rising rebuilding costs and weather-related losses.(3) Between 2020 and 2023 alone, the average home insurance premium increased from $75 to $360 due to climate change impacts, with disaster-prone regions experiencing especially steep increases.(1) Since 2015, homeowners in some regions affected by more extreme weather have seen home insurance costs increased by nearly 57%.(1) Some insurers have also limited or stopped offering coverage in high-risk areas.(7)
For many families, rising insurance costs are no longer occasional financial burdens. They are becoming recurring monthly expenses tied directly to growing climate risk.
How Rising Temperatures Increase Household Energy Costs

The financial impacts of climate change extend beyond insurance. Rising temperatures are also changing how much energy Americans use and how utilities plan for future electricity demand.
Between 1950 and 2010, per capita electricity use increased 10-fold, though usage has flattened or slightly declined since 2012 due to more efficient appliances and LED lighting. (3) A significant share of increased energy demand comes from cooling needs associated with higher temperatures.
Over the last 20 years, the United States has experienced increasing Cooling Degree Days (CDD) and decreasing Heating Degree Days (HDD). Nearly all counties have become warmer over the past three decades, with some areas experiencing several hundred additional cooling degree days, equivalent to roughly one additional degree of warmth on most days. (1) This trend reflects a warming climate where air conditioning demand is increasing while heating demand generally declines. (4)
As temperatures continue rising, households are expected to spend more on cooling than they save on heating. The U.S. Energy Information Administration (EIA) projects that by 2050, national Heating Degree Days will be 11% lower while Cooling Degree Days will be 28% higher than 2021 levels. Cooling demand is projected to rise 2.5 times faster than heating demand declines. (5)
These projections come from energy and infrastructure experts planning for future electricity demand and grid capacity needs. Utilities and grid operators are already preparing for higher peak summer electricity loads caused by rising temperatures. (5)
Longer and hotter summers also affect how homes and buildings are designed. Buildings constructed for past climate conditions may require upgrades such as larger air conditioning systems, stronger insulation, and improved ventilation to remain comfortable and energy efficient in the future. (10)
For many households, this means higher monthly utility bills and potentially higher long-term home improvement costs as temperatures continue to rise.
How Climate Change Affects Electricity Rates
On an inflation-adjusted basis, average U.S. residential electricity rates are slightly lower today than they were 50 years ago. (2) However, climate-related damage to utility infrastructure is creating new upward pressure on electricity costs.
Electric utilities rely heavily on above-ground poles, wires, transformers, and substations that can be damaged by hurricanes, storms, floods, and wildfires. Repairing and upgrading this infrastructure often requires substantial investment.
As a result, utilities are increasing electricity rates in response to wildfire and hurricane events to fund infrastructure repairs and future mitigation efforts. (1) The average cumulative increase in per-household electricity expenditures due to climate-related price changes is approximately $30. (1)
While this increase may appear modest today, utility costs are expected to rise further as climate-related infrastructure damage becomes more frequent and severe.
How Climate Disasters Increase Government Spending and Taxes
Extreme weather events also damage public infrastructure, including roads, schools, bridges, airports, water systems, and emergency services infrastructure. Recovery and rebuilding costs are often funded through taxpayer dollars at the federal, state, and local levels.
The average annual government cost tied to climate-related disaster recovery is estimated at nearly $142 per household. (1) States that frequently experience hurricanes, wildfires, tornadoes, or flooding can face even higher public recovery costs.
These expenses affect taxpayers whether they personally experience a disaster or not. Climate-related recovery spending can increase pressure on public budgets, emergency management systems, and infrastructure funding nationwide.
Reducing Climate Costs Through Climate Action
While this article focuses on the growing financial costs associated with climate change, the issue is not only about money for many people. It is also about recognizing our environmental impact and taking responsibility for reducing it in order to help preserve a healthy planet for future generations.
While individuals alone cannot solve climate change, collective action can help reduce future climate adaptation costs over time.
For those interested in taking action, there are three important steps:
- Estimate your carbon footprint to better understand the emissions connected to your lifestyle and activities.
- Create a plan to gradually reduce emissions through energy efficiency, cleaner technologies, and more sustainable choices.
- Address remaining emissions by supporting verified carbon reduction projects through carbon credits.
Carbon credits are one of the most cost-effective tools available for climate action because they help fund projects that generate verified emission reductions at scale. Supporting global emission reduction efforts can help reduce the long-term impacts and costs associated with climate change.
Visit Terrapass to learn more about carbon footprints, carbon credits, and climate action solutions.
The post How Climate Change Is Raising the Cost of Living appeared first on Terrapass.


-
Climate Change10 months ago
Guest post: Why China is still building new coal – and when it might stop
-
Greenhouse Gases10 months ago
Guest post: Why China is still building new coal – and when it might stop
-

 Greenhouse Gases2 years ago
嘉宾来稿:满足中国增长的用电需求 光伏加储能“比新建煤电更实惠”
-

 Climate Change2 years ago
嘉宾来稿:满足中国增长的用电需求 光伏加储能“比新建煤电更实惠”
-
Climate Change2 years ago
Bill Discounting Climate Change in Florida’s Energy Policy Awaits DeSantis’ Approval
-

 Renewable Energy7 months ago
Sending Progressive Philanthropist George Soros to Prison?
-

 Carbon Footprint2 years ago
US SEC’s Climate Disclosure Rules Spur Renewed Interest in Carbon Credits
-
Greenhouse Gases11 months ago
嘉宾来稿:探究火山喷发如何影响气候预测