

This is the first blog from GAME 2026
Learning to listen
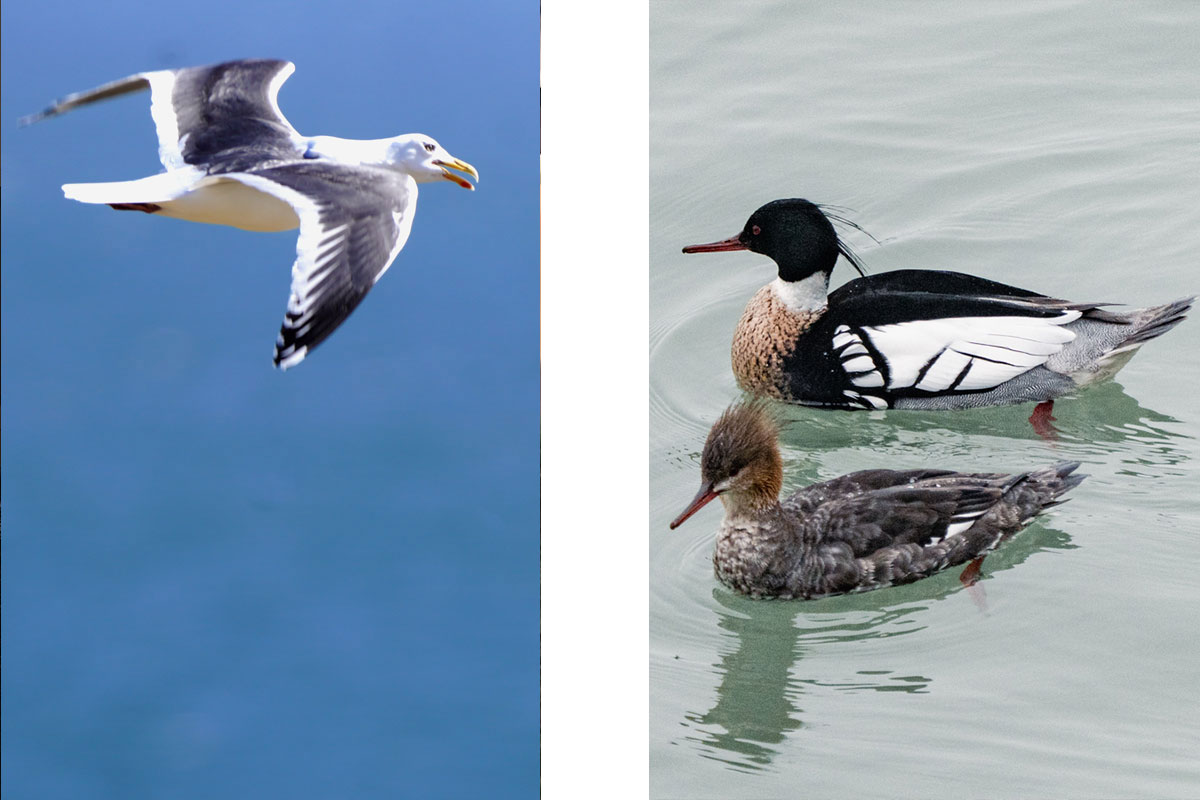
What does the ocean sound like? There is the wind moving across Akkeshi Bay, deer grazing in the woods next to the ocean, and the soft rhythm of the waves against the jetty. Moreover, there is a fox foraging along the shore (かわいい。- kawaii), the seagulls` sharp calls from the sky, and the distant hum of fishing boats. And beneath the water surface? There is an entirely different world of sound.
Underwater sound travels faster, farther and often in all directions. The underwater world is constantly active, even though it appears silent to us humans. Tiny larvae drift and swim through the water, searching for a place to settle to become adults. They are guided by chemical cues, light, and sound. What happens if that process is distracted by sounds like boat noise? Will the larvae still settle or will they look for other places?
Four weeks ago, I arrived in Japan, to begin the fieldwork for my Master´s thesis as part of GAME 2026 at the Akkeshi Marine Station (AMS in short).
Akkeshi has a small fishing economy, which is mainly known for oyster farming. The town is remote, windswept, and deeply connected to the sea — making it an ideal natural laboratory for marine research.
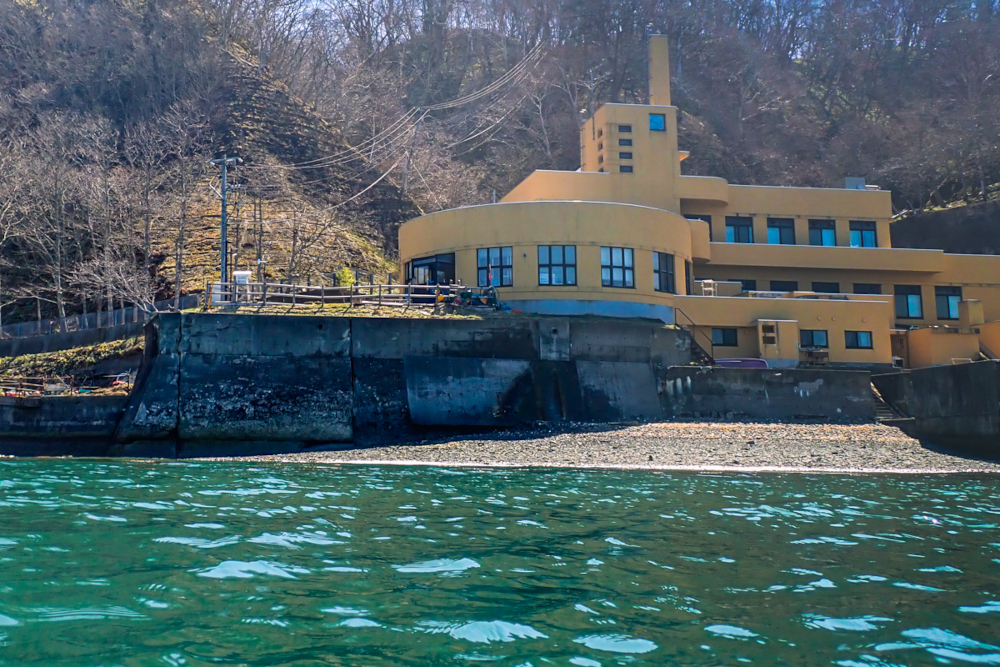
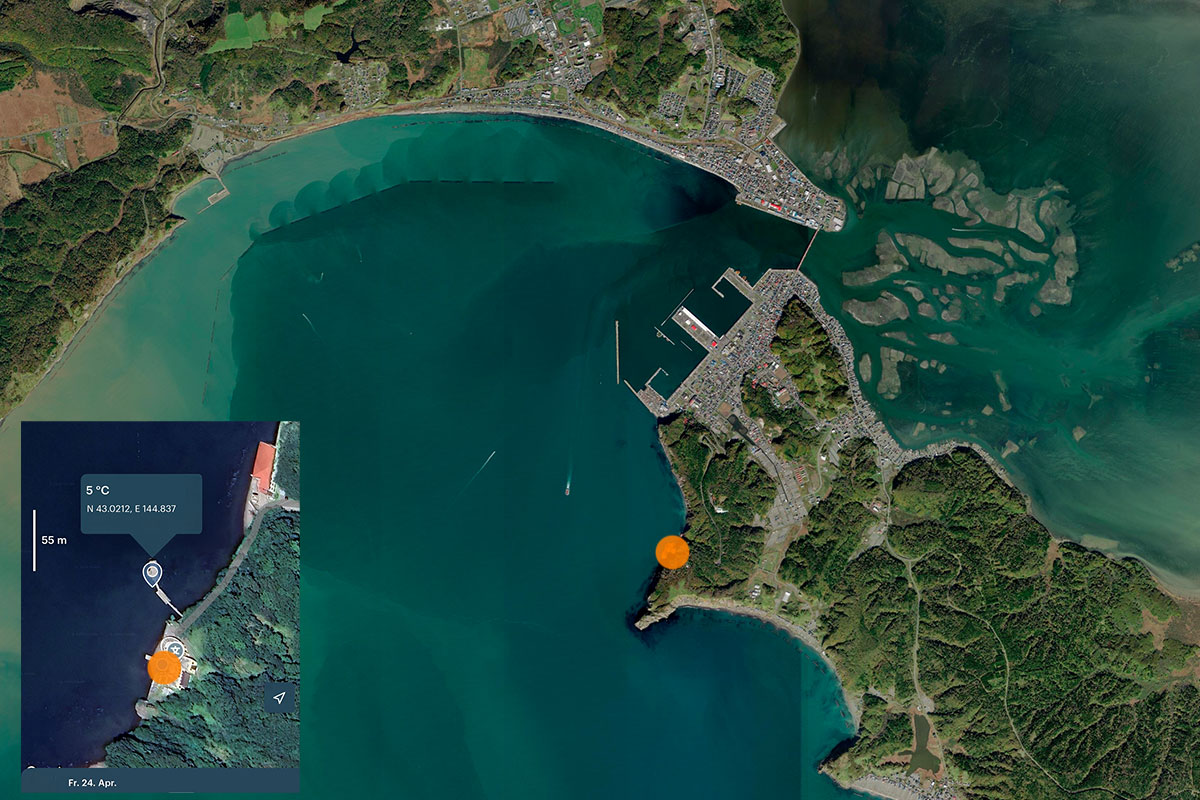
Akkeshi is located in eastern Hokkaido, in a remote and largely natural region with extensive wetlands that are rich in birdlife, while the town is surrounded by coastal cliffs and forests. An iconic red bridge leads from the town of Akkeshi to the marine station, which lies within a protected area.
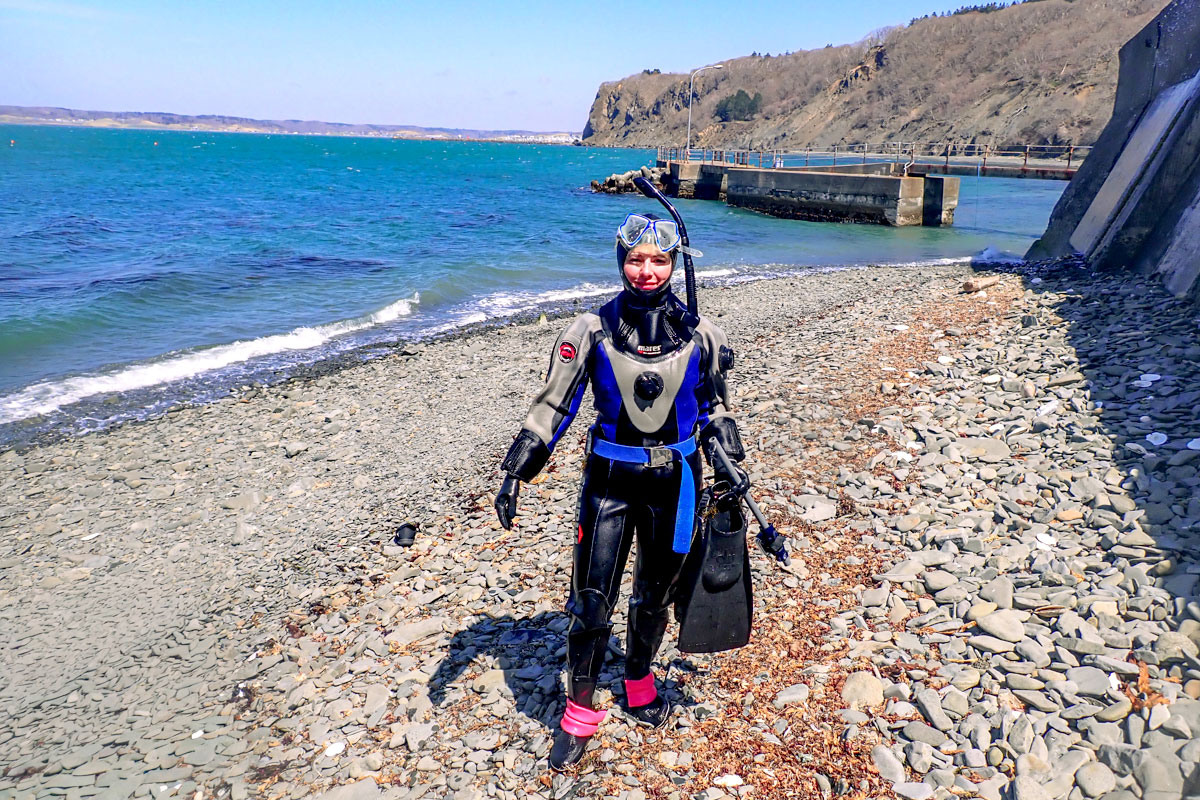
The marine station, where I am based, is located directly at the coast and experiences strong tidal variation both seasonally and daily. From the very first day, it was clear that this project would not only be about data collection, but also about adapting to a new environment — scientifically, culturally, and personally.
My research explores how underwater soundscapes, such as noise from ship engines, interacts with hard-bottom communities. In particular, I will examine whether boat noise affects the formation and early development of these communities. To test this, I will deploy an underwater loudspeaker that plays back boat noise towards PVC settlement panels, which simulate a vertical surface for the settlement of invertebrate larvae. During and after the experiment, I will analyse the composition of the communities that establish on the settlement panels and will compare it to the composition of assemblages that developed in the absence of boat noise.
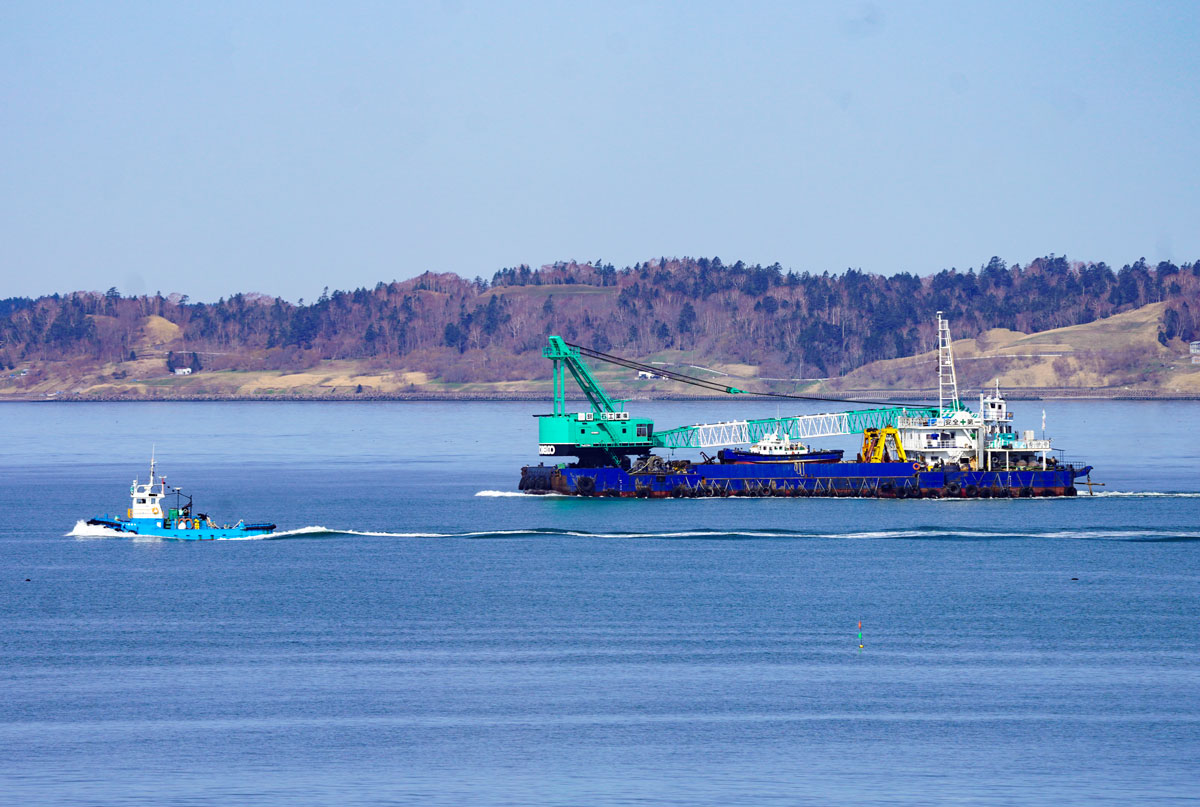
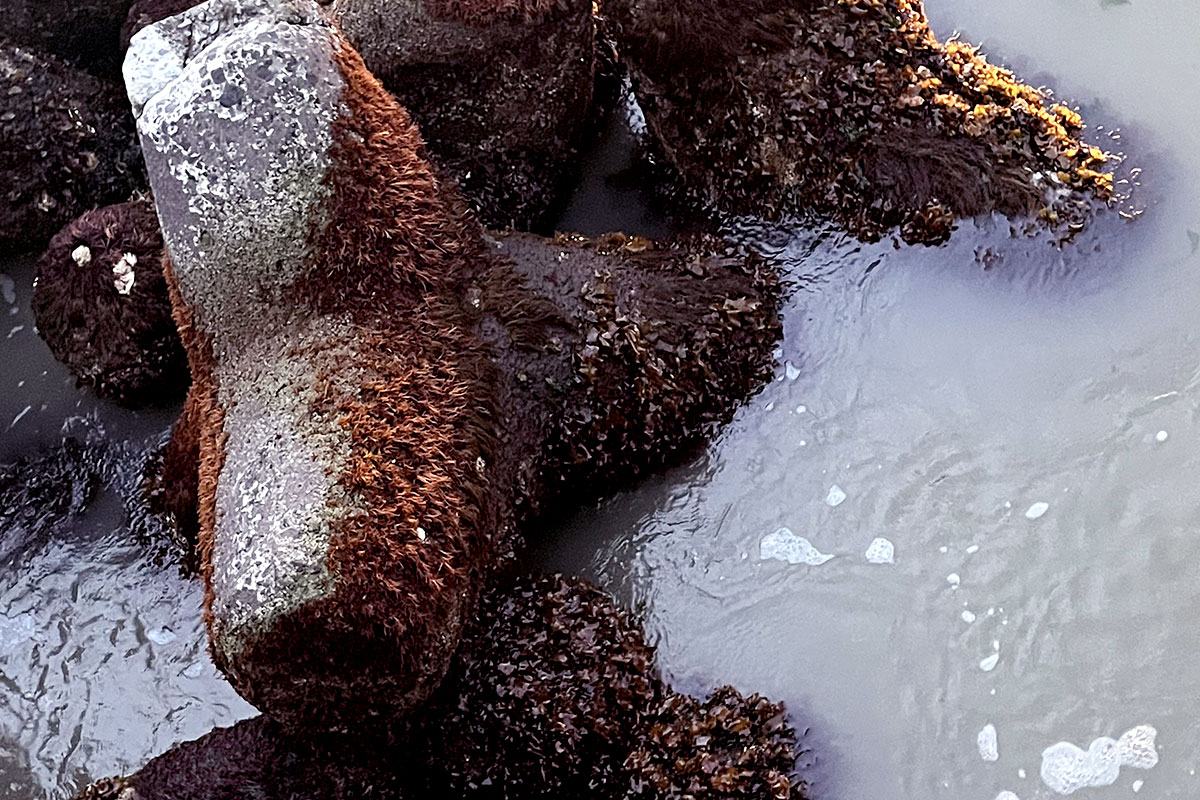
Over the past four weeks, I have been laying the groundwork for this field experiment by testing the equipment, observing the weather and wave conditions at the experimental site, and building the experimental setup that will later allow me to collect the data for my thesis. Come with me and get a glimpse on how I conduct the preliminary work.
Building the foundation: Preliminary work
GAME projects are usually carried out by two-person teams. However, in 2026 no Japanese student was found for Team Japan and therefore I am working more independently with some support by Jun Hirose, who is an employee at AMS. I also get a lot of help from other people working at the station, including the very kind technicians. To make sure we understand each other about setups and difficult constructions, I established to draw things out to make it easy for everyone to follow my ideas.
The first phase of my stay in Akkeshi has been dedicated almost entirely to tests and preparations. Before any meaningful data collection can begin, it is essential to test how the equipment performs under real-world conditions.
One of the key components of my project is an underwater sound system for recordings and playbacks. I began with testing the hydrophones and the sound playback devices under controlled conditions in the laboratory, e.g. in tanks, before gradually moving to open-water trials. During these tests, I verified signal clarity and noise levels, experimented with different cable configurations, and evaluated how sound propagates in coastal waters.
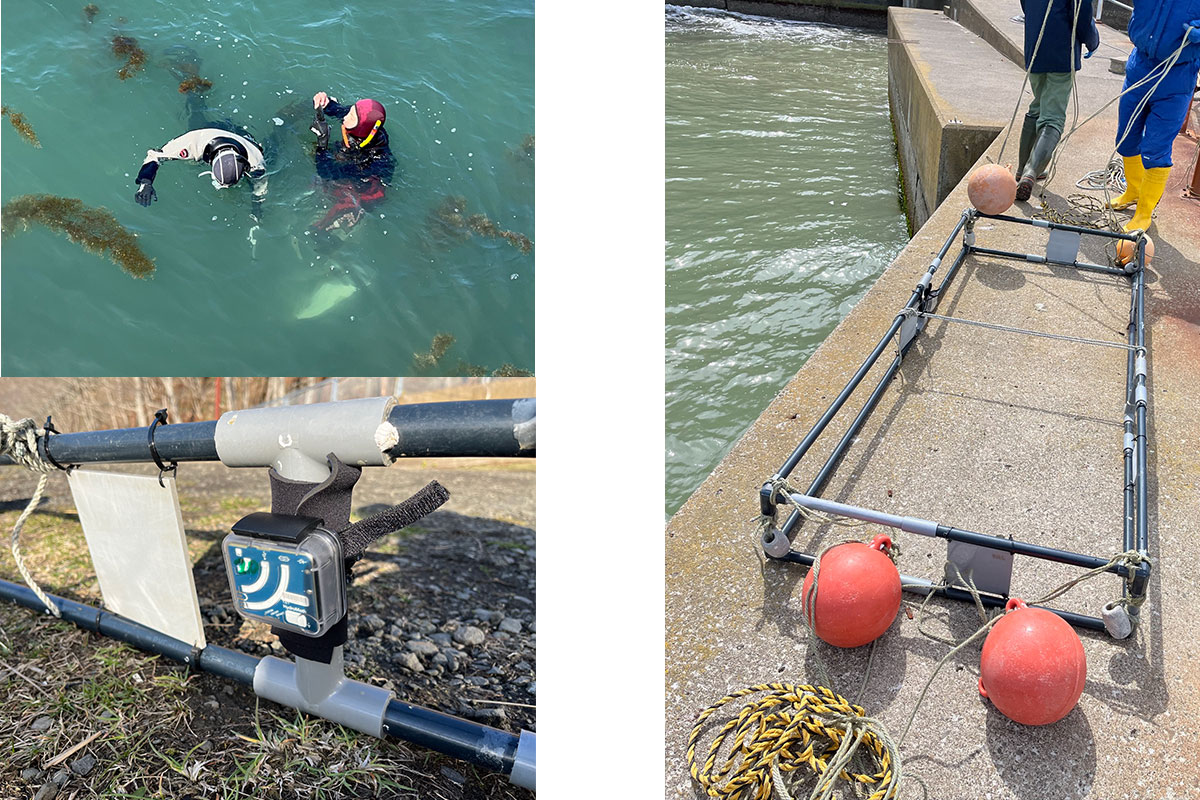
In addition to the technical setup, I also started with doing preliminary underwater recordings. They will serve as a baseline for assessing acoustic isolation, i.e. making sure that the treatment level that does not include sound playbacks does not receive sounds from the boat noise treatment level.
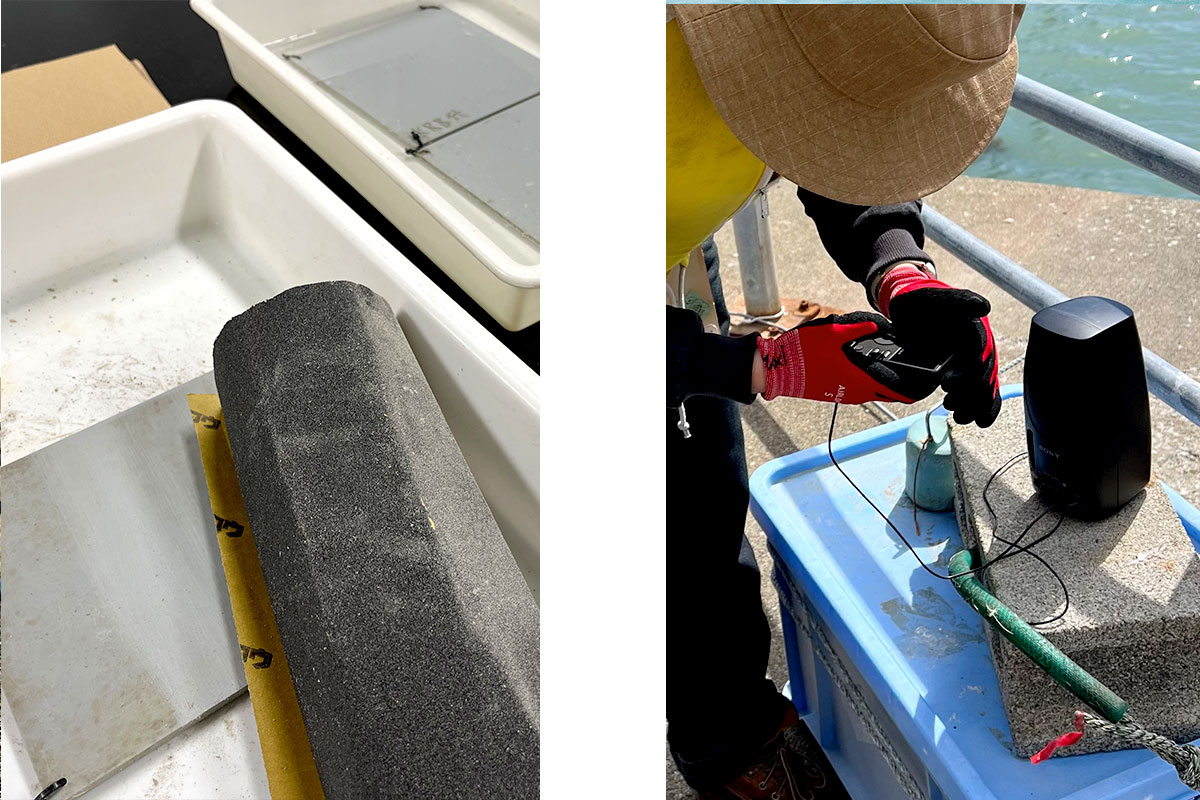
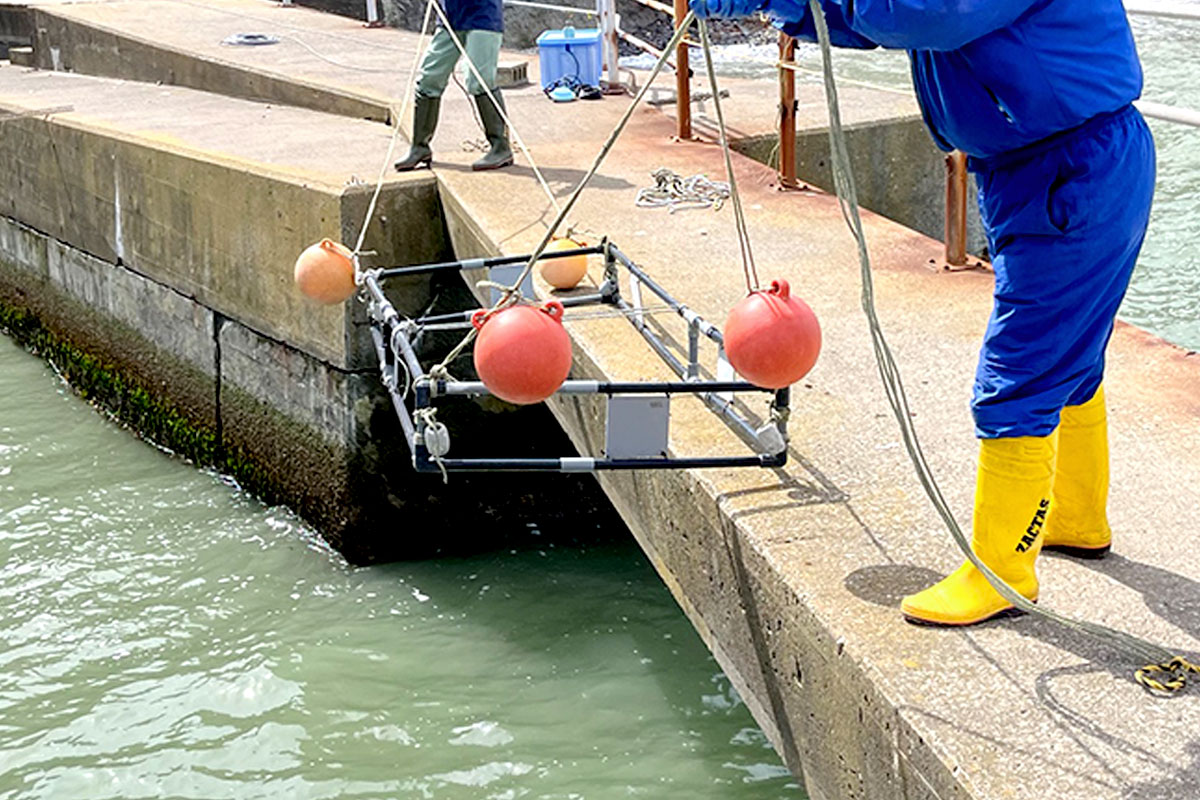
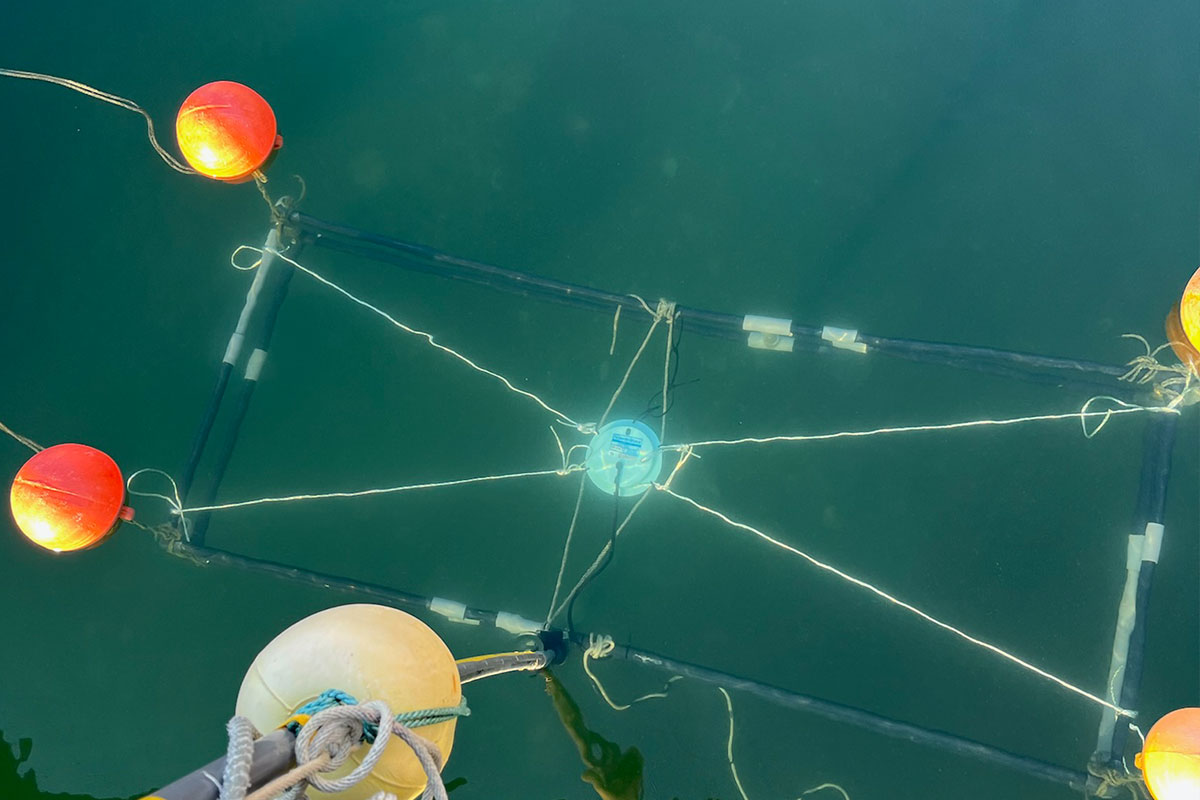
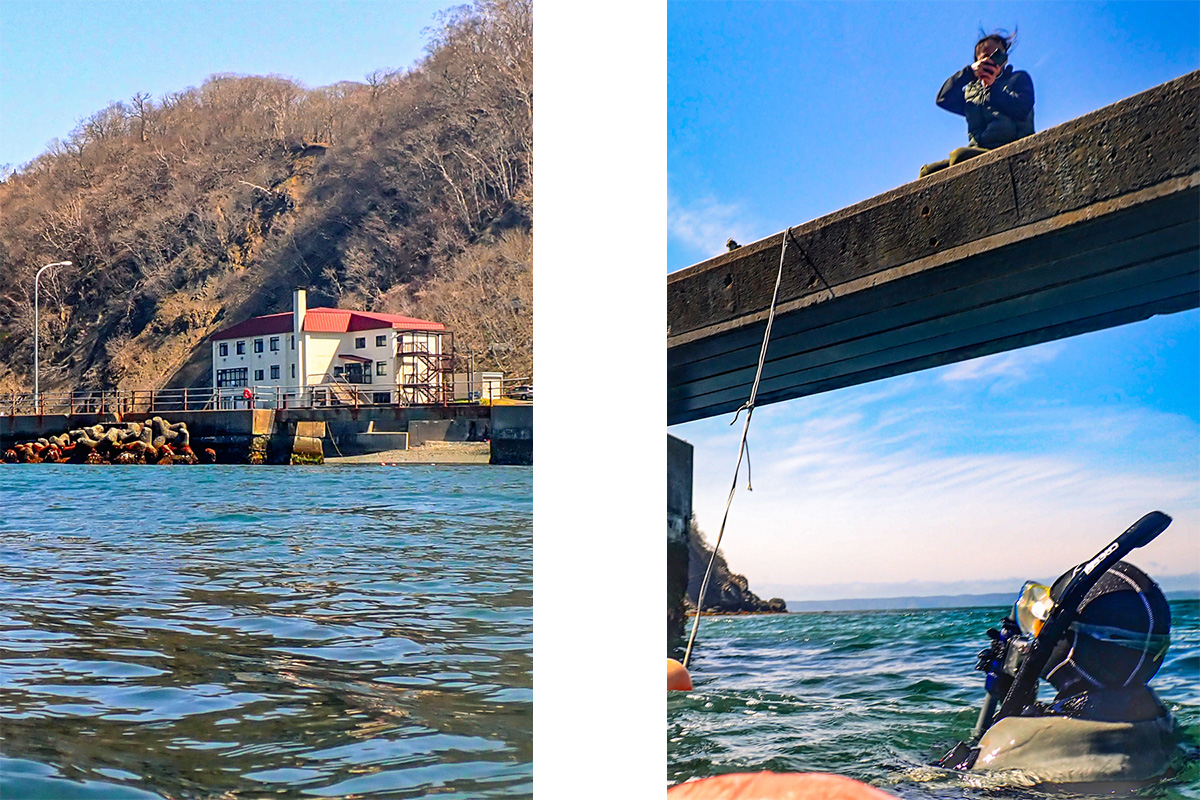
Designing and testing the experimental frame A milestone in these first weeks was the construction and testing of the experimental frame. This structure is designed to hold the settlement panels and the acoustic equipment in place at specific depths in the water column. It is built from PVC pipes, which are stabilized with ropes and buoys, and is anchored near the pier of the marine station. One of the first tasks was to attach panels to the frame, which will later be used as settlement substrata, but for now the goal was simply to test their stability and positioning.
Field deployment is rarely straightforward as wind, waves, and currents constantly interfere with even the simplest tasks. Lowering the frame into the water required careful coordination, and retrieving it was often even more challenging. During these activities, I spent a significant amount of time on the pier, working close to the water, adjusting ropes, checking connections, and observing whether the setup remains intact over time.
Communication beyond language One unexpected but important aspect of my work here has been communication across language barriers. The technician I work closely with does not speak English, and my Japanese is still very basic. To bridge this gap, I began drawing detailed sketches of the experimental setups.
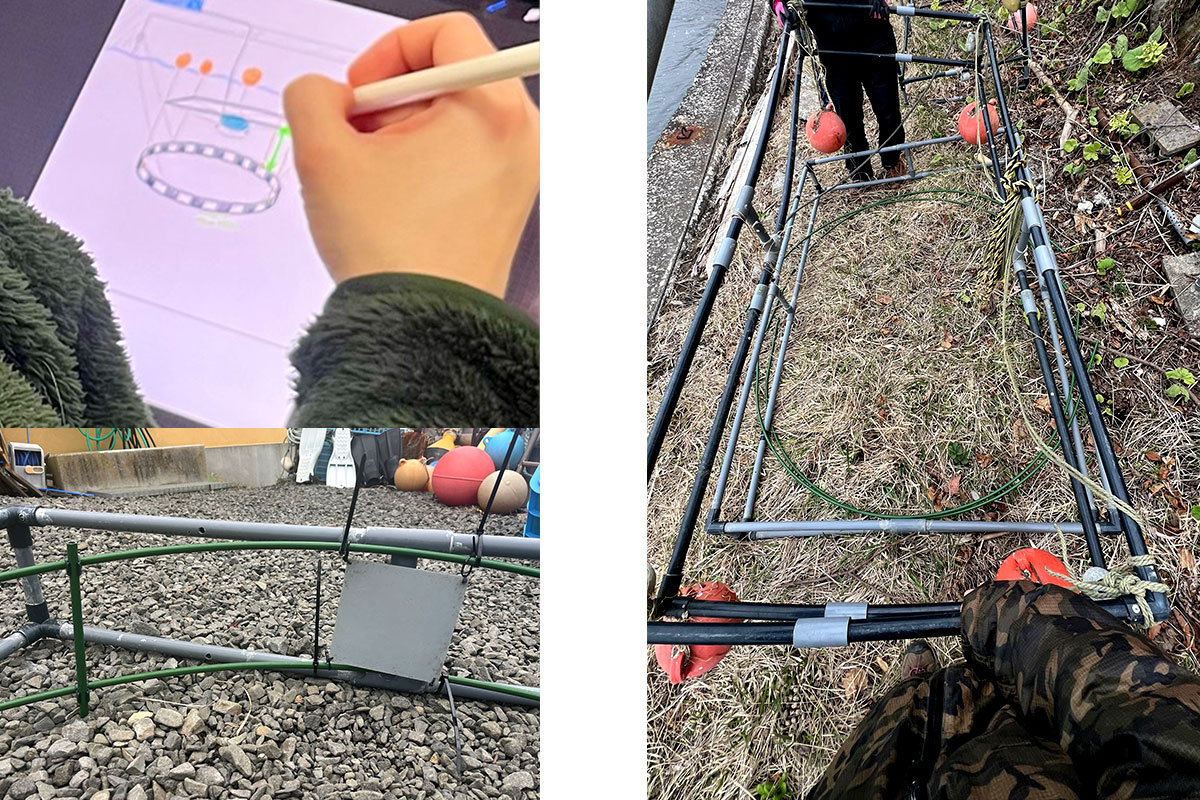
Every adjustment of the setup, no matter whether it was the placement of a hydrophone, the angle of a panel, or the water depth in which a frame is deployed, was first translated into a visual diagram. Over time, this method proved incredibly effective. It not only improved communication, but also forced me to think more clearly about the design of my experiment.
The experimental site: Knowing nature
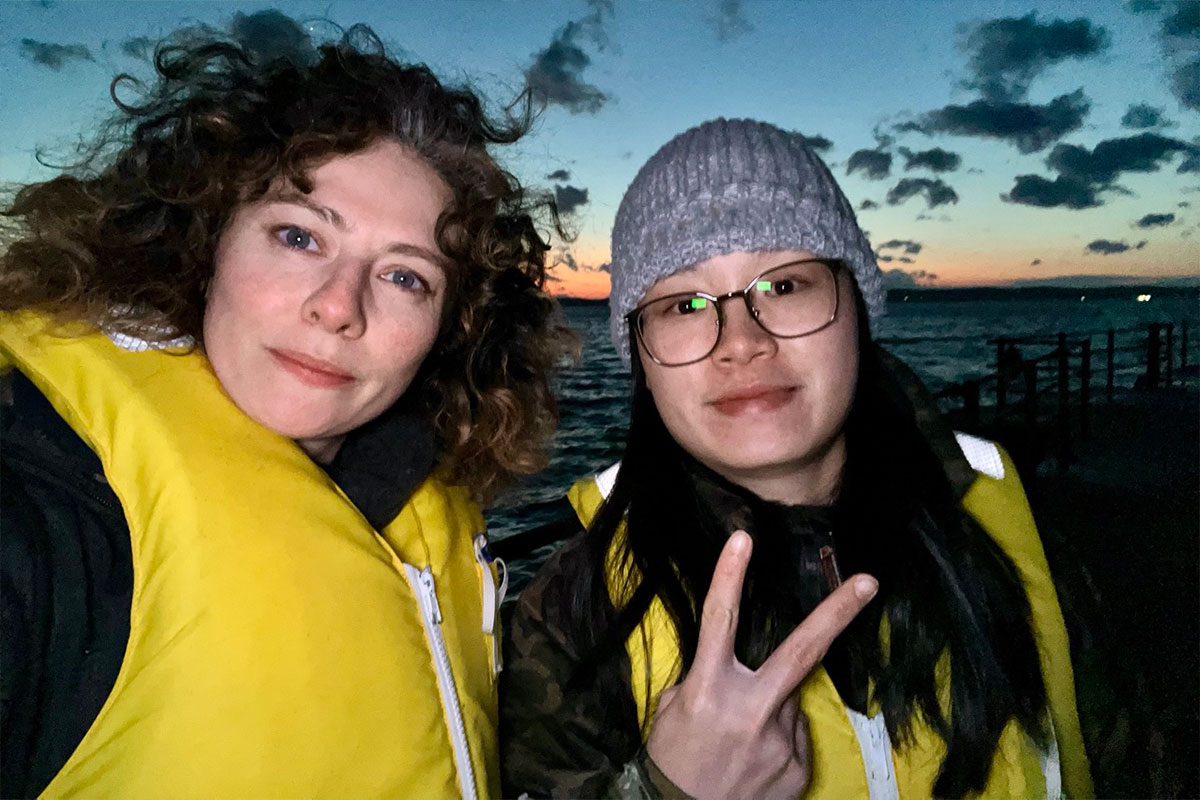
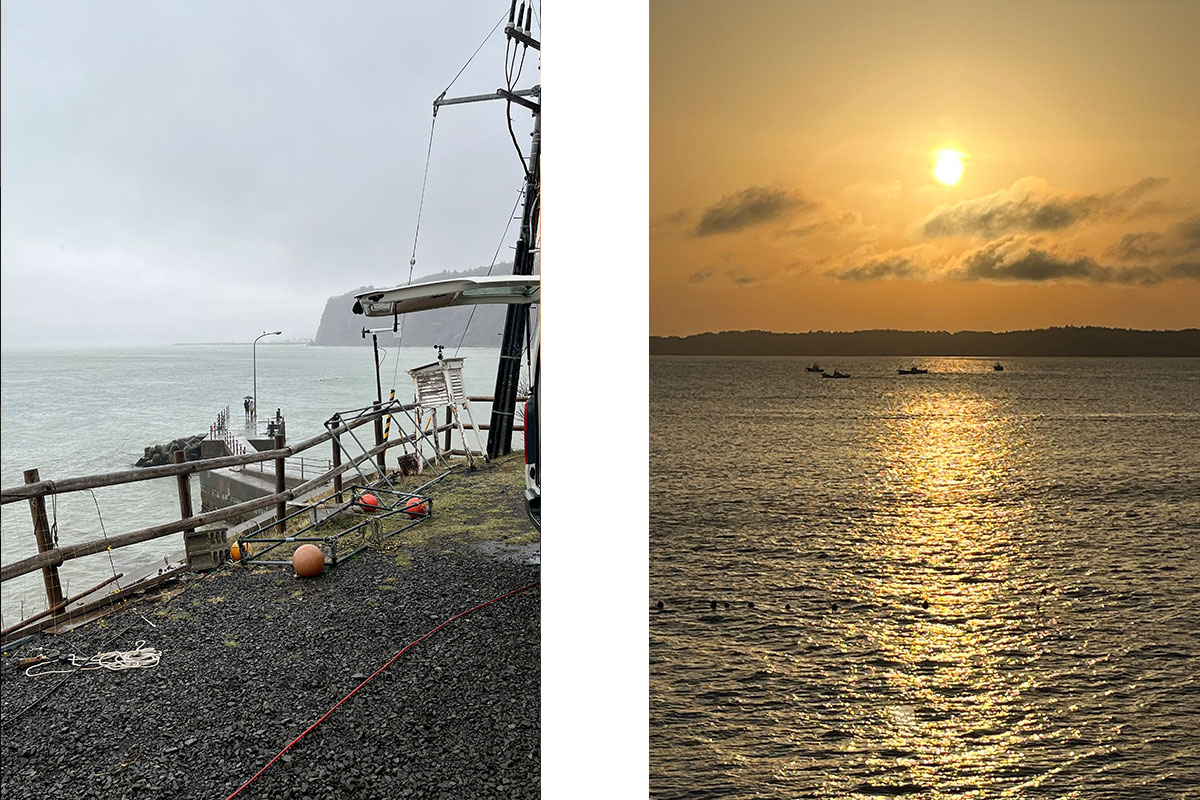
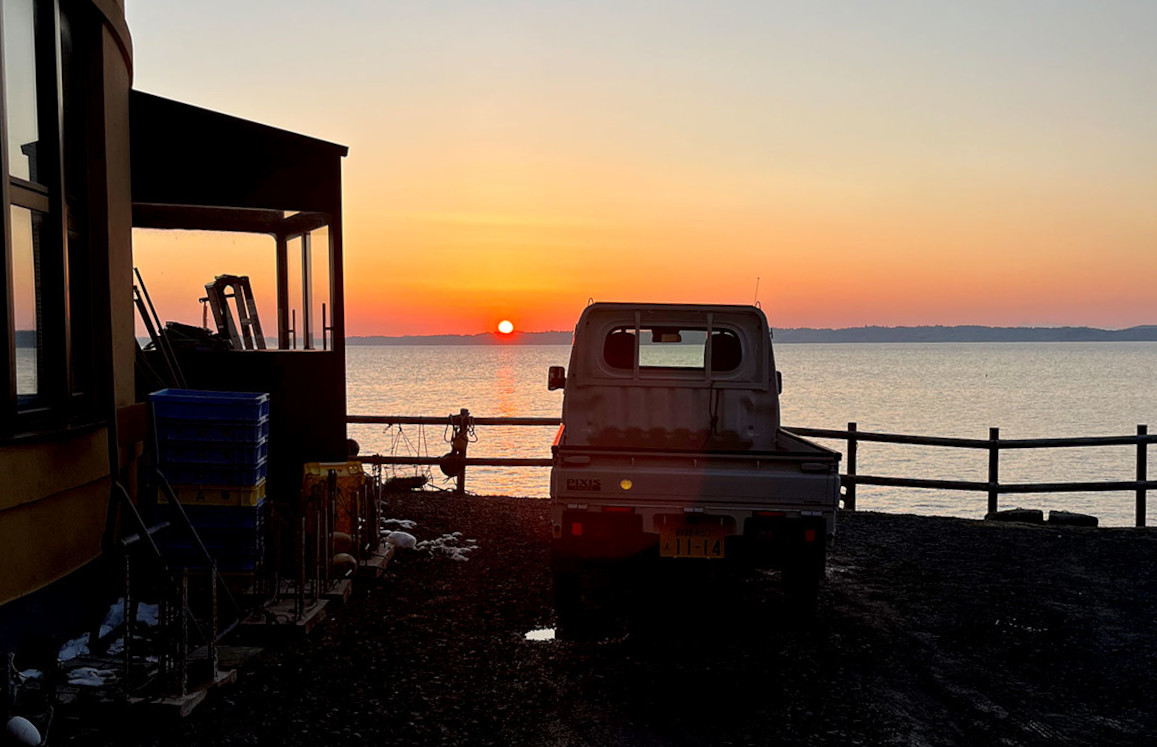
A crucial part of my project so far has been documenting the conditions at the experimental site. To make sure that the experimental setup will not be damaged, it was important to get to know the tides, the currents and the weather conditions. At times, harsh weather conditions forced us to take a break from field work. In those moments, I enjoyed the cinematic scenery of sunsets, and I turned to other tasks, such as sanding the settlement panels in order to make their surface more suitable for colonizers.
Life at the marine station
Life at the marine station is a balance between fieldwork and lab work. After long hours outside, I often return to the lab to clean equipment, process preliminary data, or prepare for the next deployment.
I have also spent time helping others with their work, which has been an important part of integrating into the team. Whether assisting with equipment, handling or sharing observations, these interactions have made the experience of working at AMS more collaborative and less isolating. The station itself is modest but well-equipped. It provides everything that is necessary for field-based marine research, and its proximity to the water makes transitions between lab and field seamless.
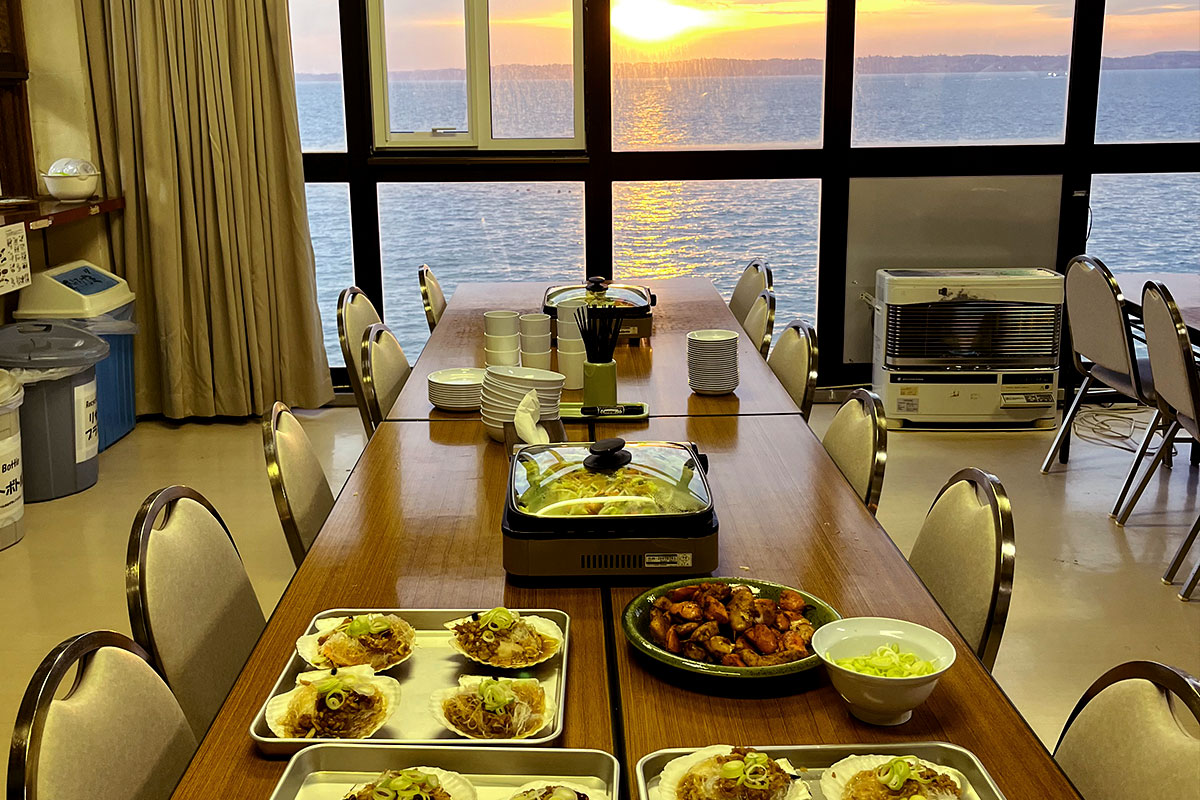
Surprisingly, Jun Hirose and I got a welcome party from the whole office. It was a great opportunity to talk (or gesture) with other members of the station. And of course, there was great food, cooked by some of the researchers.
Nature and wildlife encounters
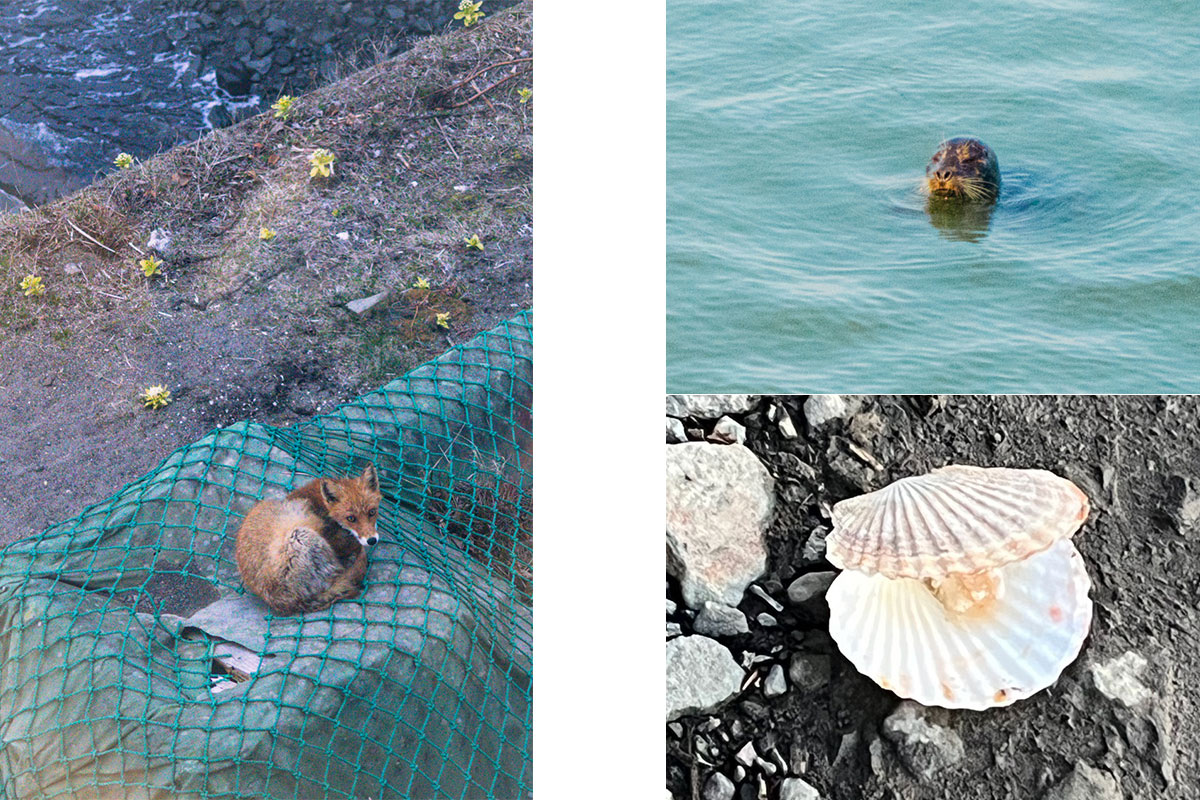
While the focus of my project is on underwater acoustics, the environment near the marine station constantly reminds me that this is a living ecosystem. Deer frequently wander near the station, sometimes appearing unexpectedly along the road. On a few occasions, I have even spotted a fox passing by quietly or lying next to the dining area at the guesthouse.
During a weekend break, I took the opportunity to explore Hokkaidō’s nature further to watch birds and seals. Watching seals swimming in the water, while seabirds circled overhead added another dimension to my understanding of the site. These animals are not just part of the scenery, they are also part of the acoustic environment I am studying.
What comes next
In the next phase of the project, I will shift from preparations to the systematic collection of data. With the setup tested and refined, I will run a controlled experiment to analyze whether sound interferes with the settlement of larvae.
What comes next
In the next phase of the project, I will shift from preparations to the systematic collection of data. With the setup tested and refined, I will run a controlled experiment to analyze whether sound interferes with the settlement of larvae.
I already started collecting data when I did recordings for assessing whether the frame that holds the settlement panels, which will not be exposed to boat noise, is acoustically isolated from the frame that holds the speaker.
Fieldwork is rarely smooth. Equipment fails, weather changes quickly, and even simple tasks can take much longer than expected. There have been days when strong winds made it impossible to deploy the setup, and others when technical issues forced me to repeat tests. However, each challenge has also led to small improvements such as better cable management, clearer protocols, and more efficient workflows.
Beyond the data, this experience has been shaped by the place and the people who made it possible. Working here in Akkeshi is a reminder that research is not just about results. It is about a process, adaptation, and observation. It is about learning to listen, not only to underwater soundscapes, but also to the environment and the people around you. I feel very lucky to be able to be here and I appreciate the moments I have been collecting so far and I am looking forward to the next four months. Because sometimes, the most interesting discoveries are not the ones you set out to find, but the ones you encounter along the way.
厚岸、ありがとうございました。
お疲れ様です。
Maximiliane
Wind, waves, and boat noise: The first four weeks of underwater sound research in Akkeshi, Japan.

When I attended the OBIS Data Mobilization Workshop in the Azores (Thanks to the Air Center) this year, one observation immediately caught my attention: compared with countries such as the United States, Europe still appears surprisingly fragmented and underinvested in biodiversity data mobilization. The issue is not necessarily a lack of biodiversity research. European scientists produce enormous amounts of ecological data. The challenge is that publishing biodiversity observations into global infrastructures such as MBON/GBIF often remains an additional task rather than an integral part of funded research. In the United States, biodiversity data publication is frequently embedded in funding mechanisms and institutional mandates. Data management, curation, and dissemination seem to be recognized research activities. In much of Europe, including Denmark, researchers often mobilize data on top of their existing responsibilities, with limited dedicated funding for long-term stewardship.
I asked myself how is Denmark performing compared with its Nordic and neighboring countries?
Denmark is not lagging behind, but neither is it leading
The numbers reveal a mixed picture.
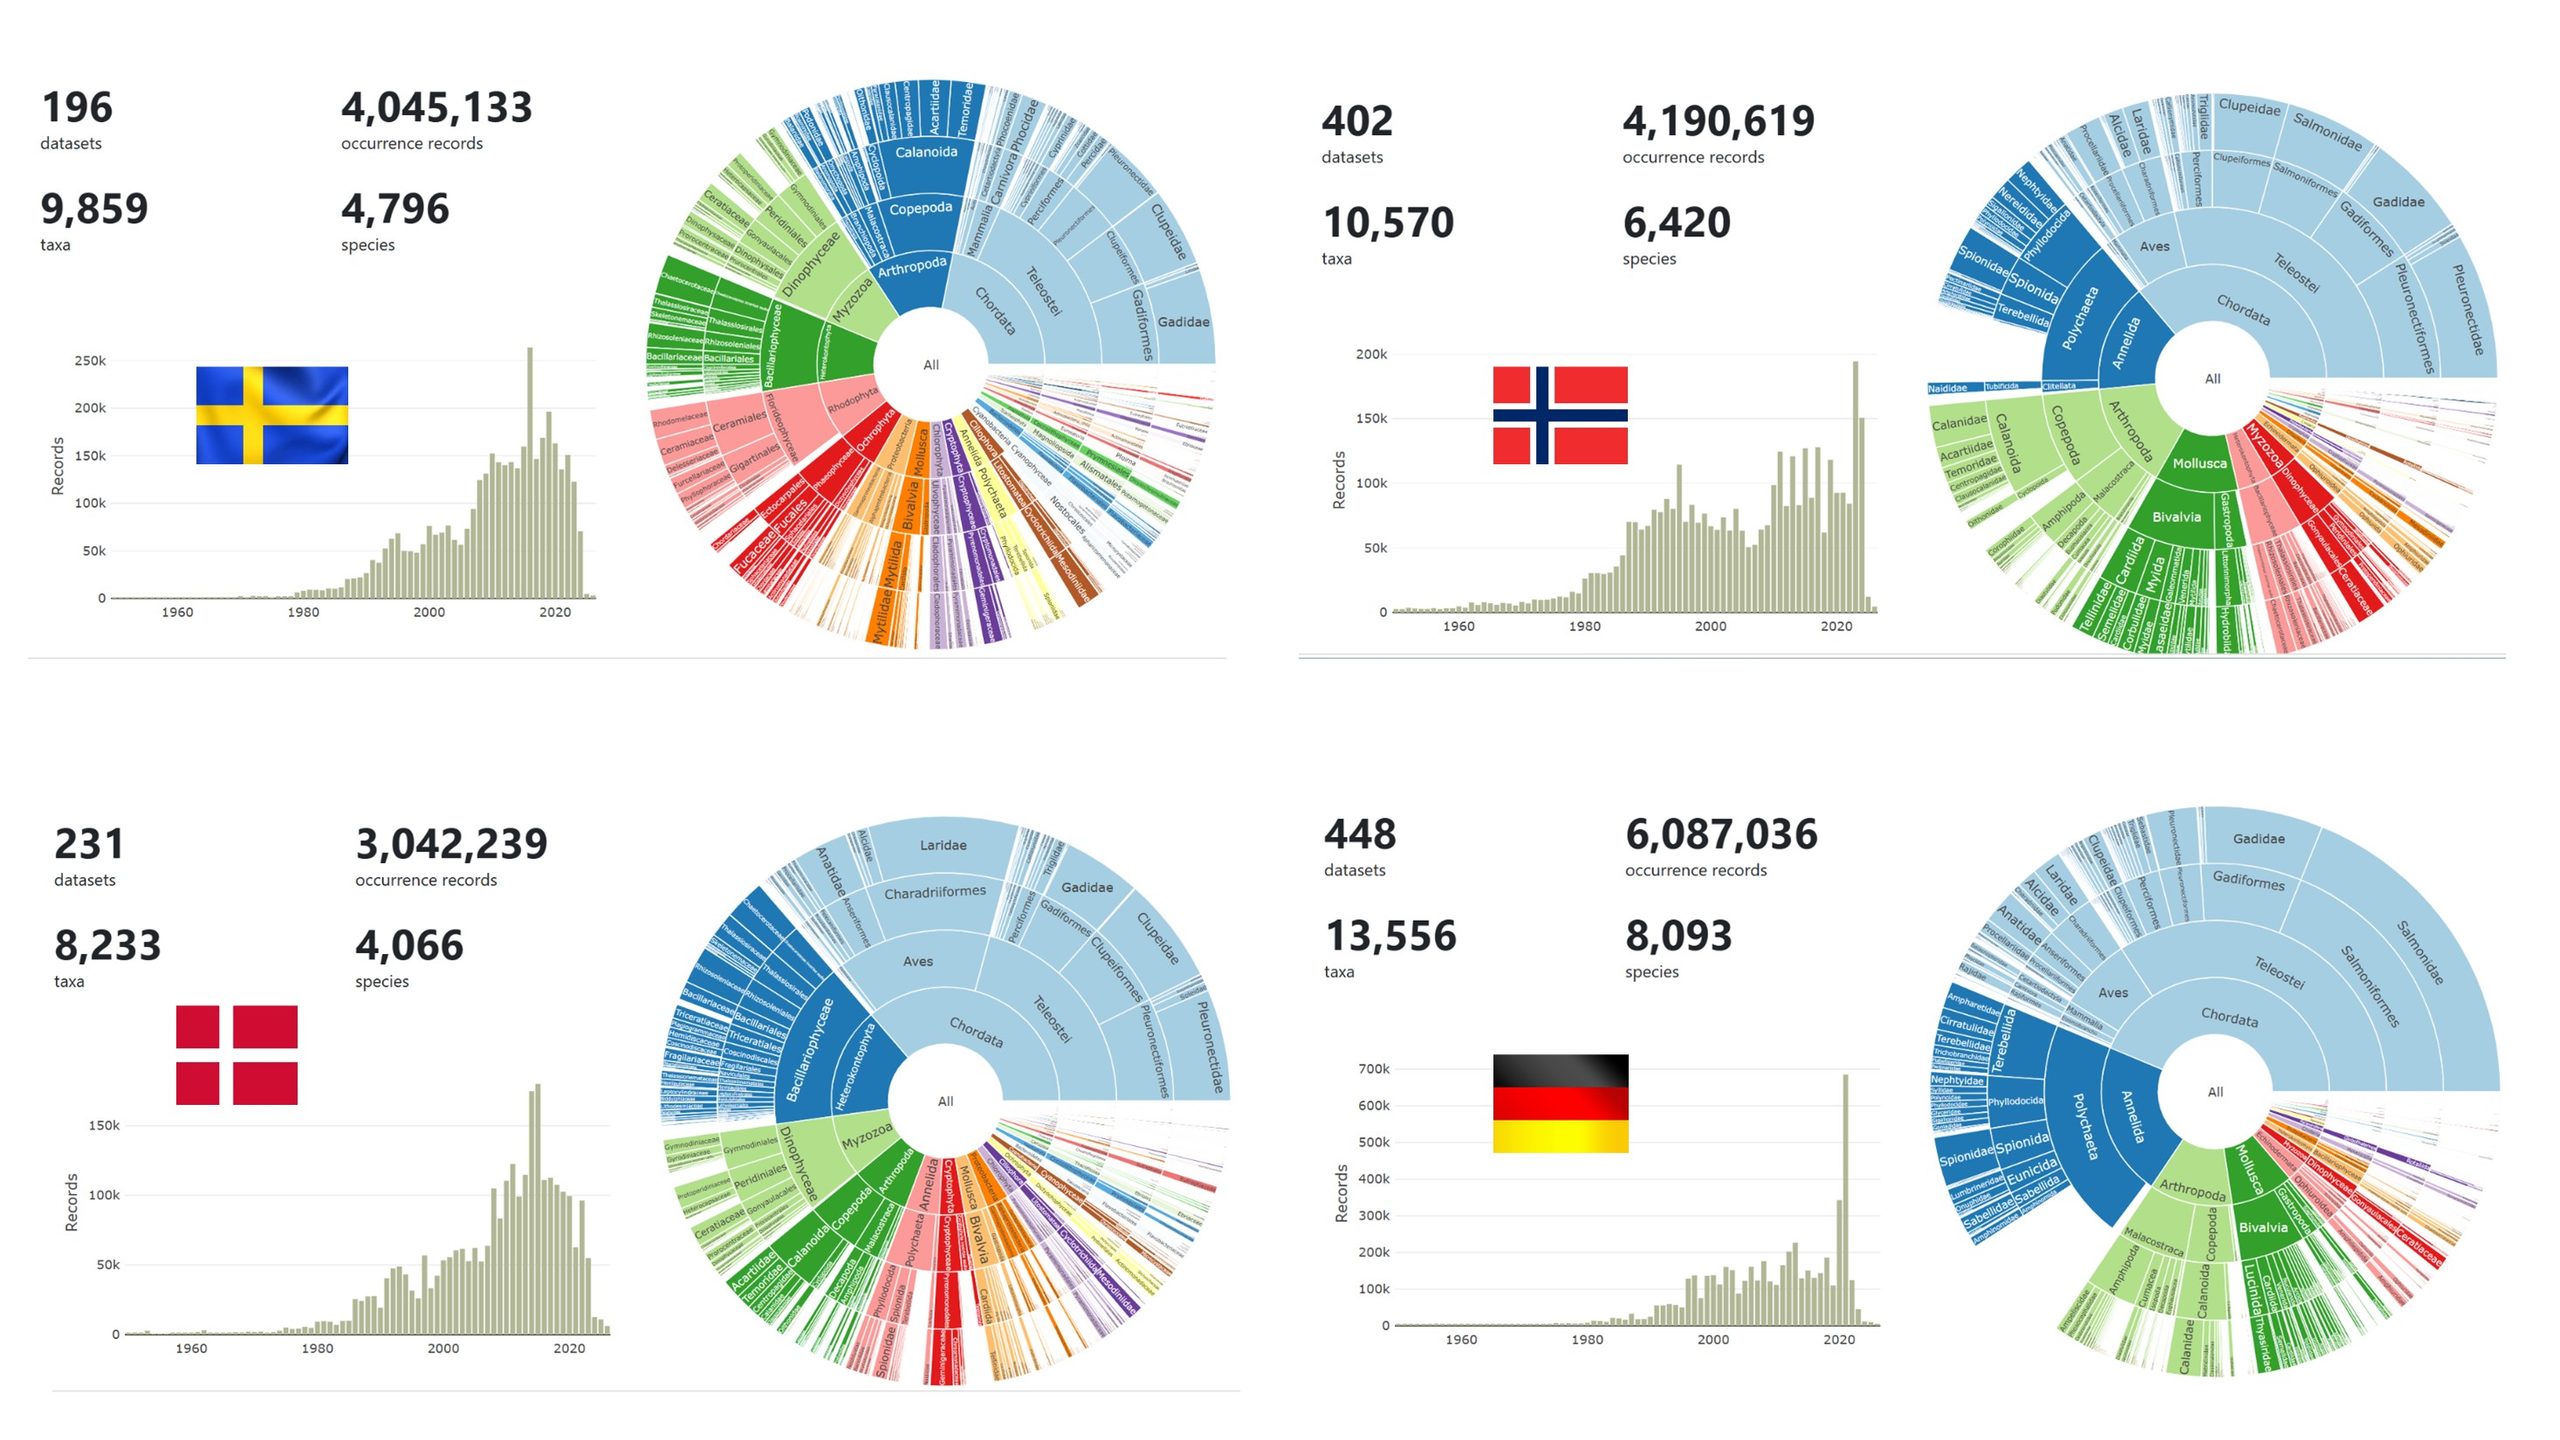
Germany clearly stands out as the regional leader, with both the highest number of datasets and the highest taxonomic coverage. Denmark has the lowest number of occurrence records and species represented among the four countries, despite having a very active biodiversity research community. What is striking is that Denmark does not fall dramatically behind in dataset numbers. Rather, the difference appears in scale and breadth. Danish datasets tend to contain fewer records and cover fewer taxa than those from Germany, Norway, and Sweden.
Different countries tell different biodiversity stories
The taxonomic breakdowns are equally revealing. Denmark should appreciate its fish and birds’ activists. Large portions of the records belong to Gadidae (cod family), Clupeidae (herring family), Laridae (gulls), and other marine vertebrates. This reflects Denmark’s historical strengths in fisheries monitoring, marine ecology, and seabird observations. However, many invertebrate groups, microorganisms, and less visible components of biodiversity remain comparatively underrepresented in global data sets despite active programs like national Program like MONIS.
Norway shows stronger contributions from invertebrate sides such as polychaetes, bivalves, copepods, and marine benthic fauna. The Norwegian data landscape appears heavily influenced by aquaculture sectores, long-term marine monitoring programs and offshore environmental surveys. There is greater representation of marine invertebrates, which are often critical indicators of ecosystem change.
What stood out in Sweden’s data profile is the relatively large contribution from copepods, diatoms, dinoflagellates, and macroalgae. These groups are often overlooked in biodiversity databases because they require specialized expertise and monitoring programs. Sweden’s contribution suggests sustained investment in aquatic ecosystem monitoring beyond commercially important species. Well done Sweden!
Germany’s profile appears the most diverse. While fish and vertebrates remain important, there are strong contributions from polychaete worms, molluscs, arthropods, plankton in general term and benthic organisms. Germany not only contributes more records but also appears to mobilize a wider variety of biodiversity data types. You made me proud Germany 
The real gap may be invisible biodiversity
One lesson from the workshop was that biodiversity databases often reflect what is easiest to observe, identify, and fund. Fish, birds, and mammals are well represented almost everywhere. The groups that drive ecosystem processes, such as jellyfish, zooplankton, benthic invertebrates, phytoplankton, and microbial communities, remain far less visible. This is particularly relevant for marine ecosystems. Some of the most important ecological changes currently occurring in our seas involve gelatinous zooplankton, plankton communities, and benthic assemblages, yet these groups remain underrepresented in many biodiversity repositories. For someone working with jellyfish and marine food webs, this raises an important question:
Are we documenting the biodiversity that is easiest to count, or the biodiversity that is most important for understanding ecosystem change?
This fall, Ocean Conservancy is celebrating its 41st annual International Coastal Cleanup® (ICC), once again bringing together volunteers to protect the beaches and waterways we all love. Ocean Conservancy recently hosted flagship events in Long Beach and Washington, D.C. that celebrated this global movement close to home.
Over the past four decades, nearly 20 million volunteers have rolled up their sleeves to remove more than 405 million pounds of trash from beaches and waterways around the world. And their impact extends far beyond what they collect. ICC volunteers have documented nearly 440 million individual items, creating the world’s largest marine debris database and providing invaluable information that helps Ocean Conservancy and others better understand—and tackle—ocean plastic pollution.
This year’s celebration continued that incredible legacy. At Alamitos Beach in Southern California, more than 150 volunteers gathered on September 19 and removed 1,109 pounds of trash, alongside members of Team USA Artistic Swimming and Olympic and Paralympic athletes. In Washington, D.C., 439 volunteers gathered on September 26 to remove 2,182 pounds of trash from Anacostia Park along the Anacostia River.


“I am so grateful to all of the volunteers who came out today for our ocean—and every volunteer who has made the last 41 years of impact possible,” said Ocean Conservancy’s Senior Director of Conservation Cleanups, Allison Schutes. “Every piece of plastic collected helps protect marine animals and habitats and contributes to research and advocacy.”
And the impact doesn’t stop when the cleanup ends. During International Coastal Cleanup events, volunteers do more than remove trash: They document what they find, helping build a clearer picture of the plastic pollution threatening our waterways and wildlife. Through the Clean Swell® app or paper data sheets, ICC volunteers contribute to Ocean Conservancy’s online, open-access database, the world’s largest repository of marine debris data. These records help scientists, conservation groups and governments understand pollution trends and identify solutions.
That data can also drive meaningful policy change. ICC data were recently used in a peer-reviewed study showing that plastic bag bans lead to reduced plastic bag pollution. The data have also helped advance policies ranging from California’s SB 54 to Florida’s balloon release ban and the federal Farewell to Foam Act. From a neighborhood cleanup to statewide action, every piece of documented trash helps build the evidence needed to tackle plastic pollution at its source.