

This post is the last blog of the GAME 2025 project. Unfortunately, it was delayed by several months (the project ended in December 2025), but it was not forgotten. Read now about the extraordinary and dramatic experiences that Andrea and Sarah made in Cabo Verde in 2025.
In April 2025, GAME returned once again to the islands of Cabo Verde, this time with Andrea (Technical University of the Atlantic, Cabo Verde) and Sarah (University of Potsdam, Germany). As in previous years, we were exploring the influence of artificial light at night (ALAN) on coastal organisms. The project in 2025 was supposed to bring more knowledge about its influence on the growth of marine epiphytes.
Cabo Verde comprises 10 main islands and a few islets, which are lined up in an arc in the Northern Atlantic. The archipelago was formed by underwater volcanoes that started to emerge from the depths of the ocean about 20 million years ago. The islands are characterized by a dry landscape that has arid and poorly permeable soils, which are almost infertile, and by rainfalls that do not appear every year. Hence, the inhabitants of the archipelago always found their greatest wealth in the sea. As the westernmost African country, its isolation has led to the evolution of marine species that are unique to the islands, while other species that arrived from elsewhere found favourable conditions here. As a relatively young nation, Cabo Verde has yet to explore much of its biodiversity, as well as the marine ecosystems in its waters. Partnerships between Cabo Verde and Germany, which result in projects such as the one we are participating in in the framework of GAME, are always celebrated as they contribute to the scientific enrichment of the country.
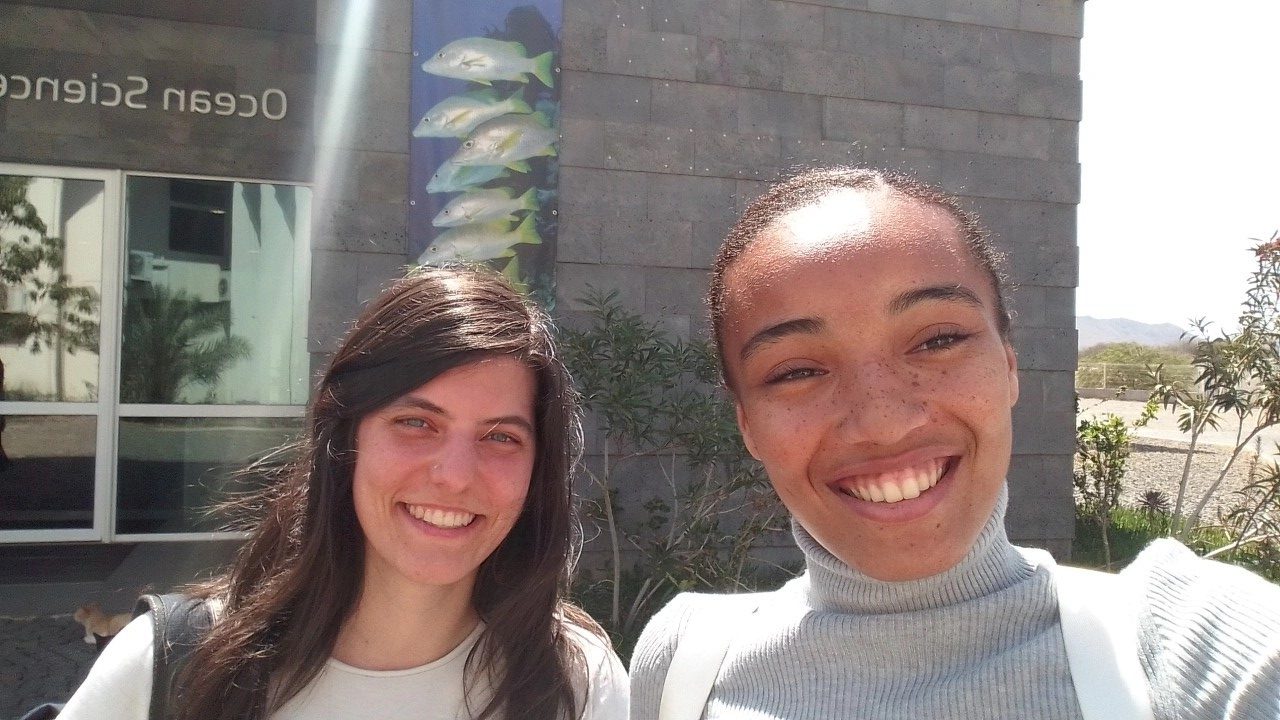
Our project was conducted in collaboration with the OSCM (Ocean Science Center Mindelo). The center is, on the one hand, linked to GEOMAR (GEOMAR Helmholtz Centre for Ocean Research Kiel) in Germany and, on the other hand, to IMar (Instituto do Mar) in Cabo Verde. It is dedicated to oceanographic observations and research, and also acts as a connection point for common research activities and the exchange between international scientific institutions. Laboratory work can, for instance, be carried out by using the center facilities and the available equipment. Our experiment, however, was conducted in the field, because of the need for a constant supply with seaweed spores that mediated the colonization of the substrates we provided by epiphytes.
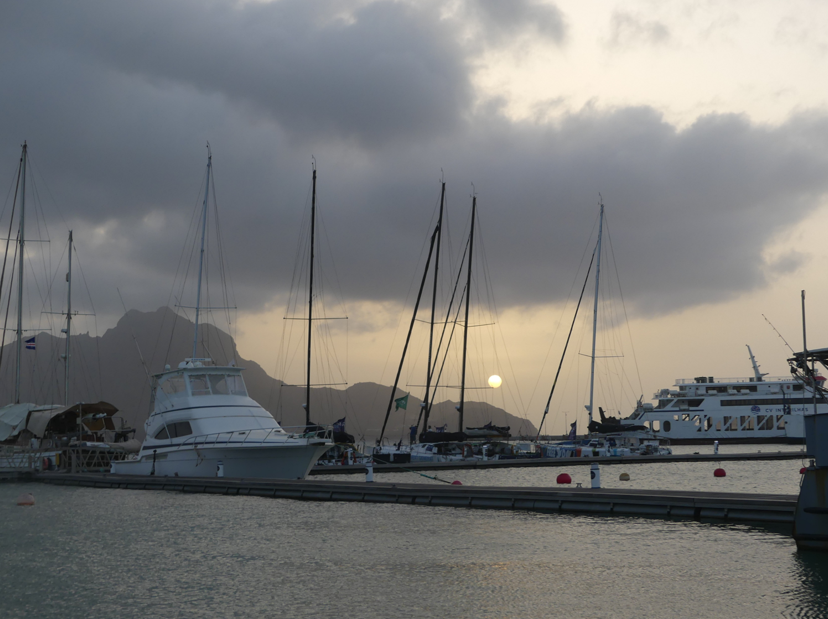
To meet the specific requirements of our study, Porto Grande Bay, more specifically the Mindelo Marina, was chosen as the study site. As its name suggests, this bay is one of the largest in Cabo Verde, and it is located in the northwest of the island of São Vicente. Its calm and shallow waters made it the ideal site for the study we were planning. Except for the intense sun and very strong wind that we felt during the first months of our field work, the place was one of the most interesting and dynamic ones in Mindelo. We spent our days on pontoon B, in front of the Marina Bistro bar, working from morning to night.
In the mornings, we could smell the aroma of stewed “catchupa” and of the seafood that was served there. In the afternoons, the atmosphere was enlivened by the most famous pop songs played at the Ponte d’Água Hotel. Whenever a familiar song came on, we couldn’t resist singing along: “Kiss me hard before you go, Summertime sadness…” At dawn, everything then became calmer. The water was still, and under the lights of the pier, fish swam in circles and created a silent spectacle. Furthermore, in the months before the nesting season in Cabo Verde, it was common to see sea turtles coming to the surface to breathe. Unfortunately, they were so fast that it was almost impossible to get a photo. So fast that Sarah rarely managed to see them. If it were a game, the score would be: Cabo Verde 7 x 1 Germany.
During our work, we met people, both local and from other countries, who were friendly and willing to help, whether with a screwdriver, a tape measure, or a kayak. They were teaching us how to tie a knot, they took photos and videos of us, were giving us ideas and suggestions, or simply provided us company. However, there were also plenty of curious onlookers, mainly elderly tourists who came from the bar-bistro over to the pier, and were interested in what we were doing.
We started our work with one of the biggest challenges of the project: finding a macroalga that could be suitable for the experiment. This alga would needed to have a leathery texture, a flat and broad surface, and should inhabit the subtidal. This was no easy task for us, because although Cabo Verde has a rich marine biodiversity, the biomass of macroalgal species is limited by the nutrient deficiency in the oligotrophic waters of the archipelago. Hence, macroalgae can only be found in small quantities. Furthermore, as it is a tropical country, this task was further complicated by the fact that the waters are warm and shallow, and such conditions mainly favour encrusting and filamentous macroalgae. We began our endeavor by searching online for inventory lists of marine macroalgae on the island of São Vicente, but this was without success. We then invested in more practical approaches, such as diving and snorkeling. We went to the Laginha Coral Cove accompanied by Professor Guilherme, who is a marine biology enthusiast. There, we found two species of macroalgae, both potentially invasive and possibly belonging to the genus Grateloupia, which were qualified to serve as “living substrates” in our experiment.
We collected several specimens of the two species to hang them into the harbour in Mindelo for a pilot study. This was to test if epiphytes would settle on the macroalgae and whether the macroalgae themselves would survive the conditions in the harbour.
Both species made it into the final round. One of them had the perfect shape, but it was far too rare for our needs, while the other candidate was much more abundant. So, we focused on the second one. A further problem we faced was that the macroalgae we worked with had not been scientifically described for Cabo Verde. This meant that there was no literature that we could have consulted to learn about morphological or physiological traits. Furthermore, we had no idea how the algae would performed at different water depths or during low tide when exposed to air.
After some weeks, however, it became clear that our chosen species were rather trapping sediment on their surface than hosting a healthy community of epiphytes. Actually, even under the microscope, sediment and epiphytes were almost impossible to separate. Our supervisor, Corrine Almeida, suspected that the algae’s branched structure made it a natural sediment trap and this was not ideal for our purposes.
Given the high sediment load and the generally murky water in the harbour, we realized that we needed a new plan. We revisited the idea of using our first, more promising species, but after extensive searching, we had to admit that there simply were not enough specimens.
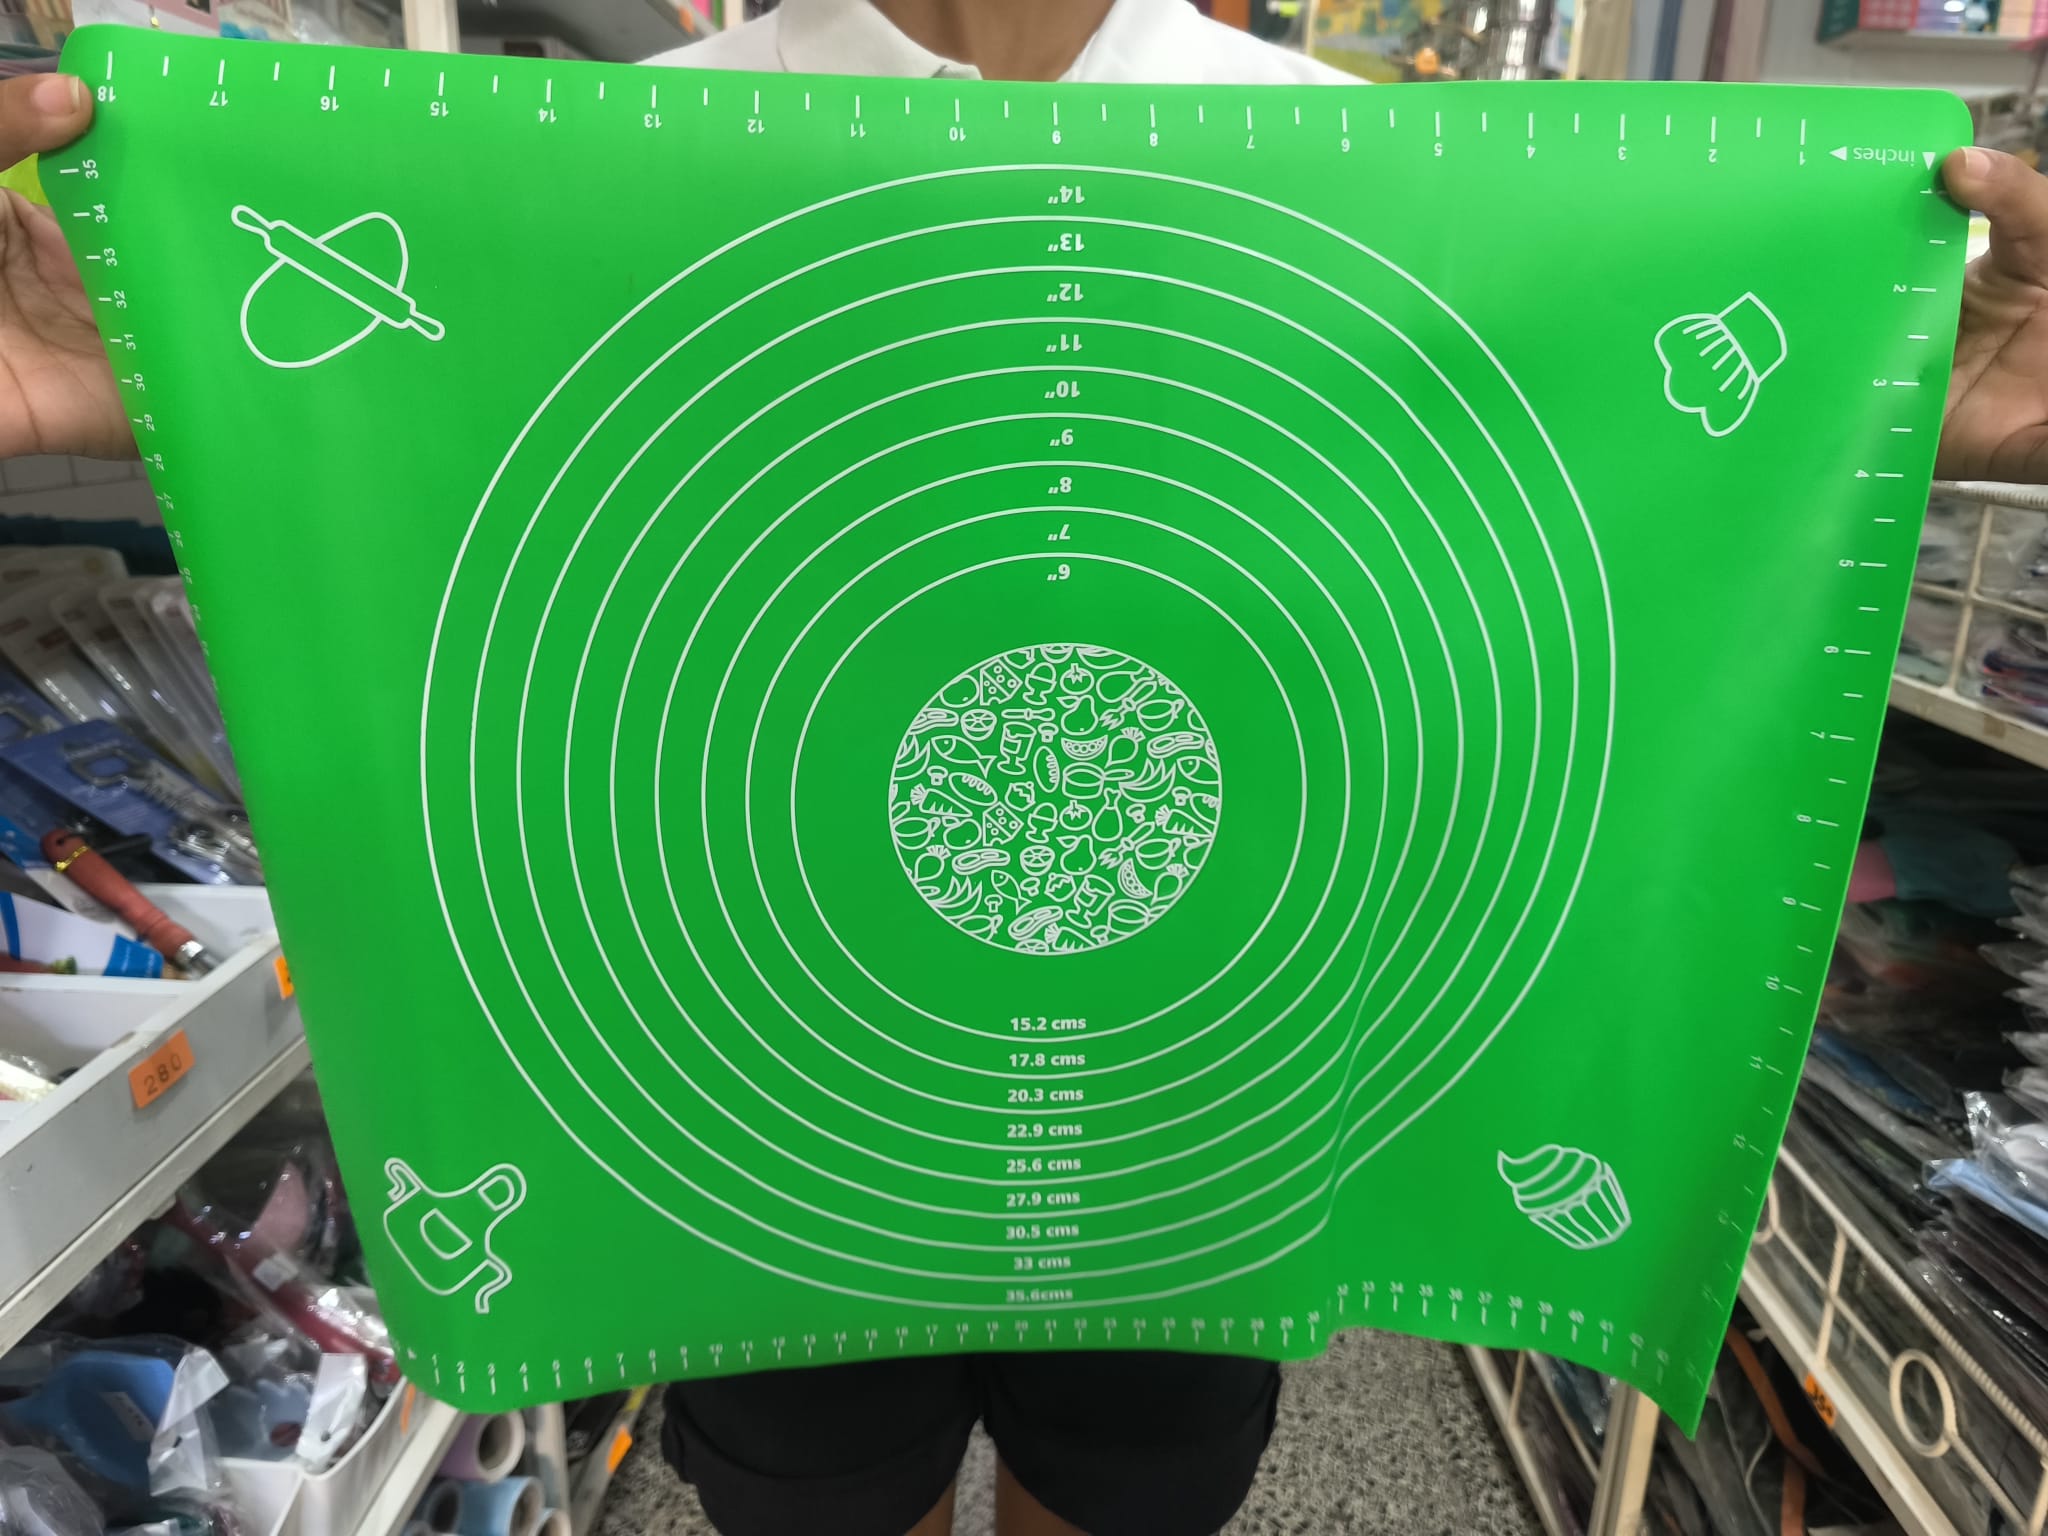
Due to this problem, we were unable to continue with the experiment, but the GAME programme coordinator, Mark, came up with a suggestion. The idea was to replace the living substrate with an artificial material that could, at least partly, simulate the traits of macroalgae, such as a flexible structure. Initially, we thought of using PVC tarpaulin, but this material has high chemical concentrations, which could affect the attachment of epiphytes. We continued searching in Mindelo until we finally found a silicone cooking mat in a Chinese store. The material was thin and malleable, requiring only to be soaked in drinking water for a few days to make its surface rougher. We bought eight green ones, which, after soaking, were cut into pieces that had the same size as the PVC plates.
For building the set up, we unpacked some materials that were left behind at OSCM by previous GAME teams, tested the LEDs, and cleaned the frames. One frame needed patching, while we built another one from the scratch. Mindelo does not have a giant all-in-one hardware store like the ones you can find in Germany – instead, you need to visit several smaller shops, while explaining every time at the counter what excatly you need. If they do not have it, they’ll usually send you to another store that might have it. After a few visits, the shopkeepers start to recognize you and let you rummage around in their storage rooms to find suitable alternatives.
We brought PVC panels from Germany and hand-cut them into 5 × 12 cm pieces. For the frames, we glued PVC pipes together and used thin ropes to create the inner structure. The panels were then attached to the ropes with cable ties, while the fake algae were sewed onto them with needle and thread.
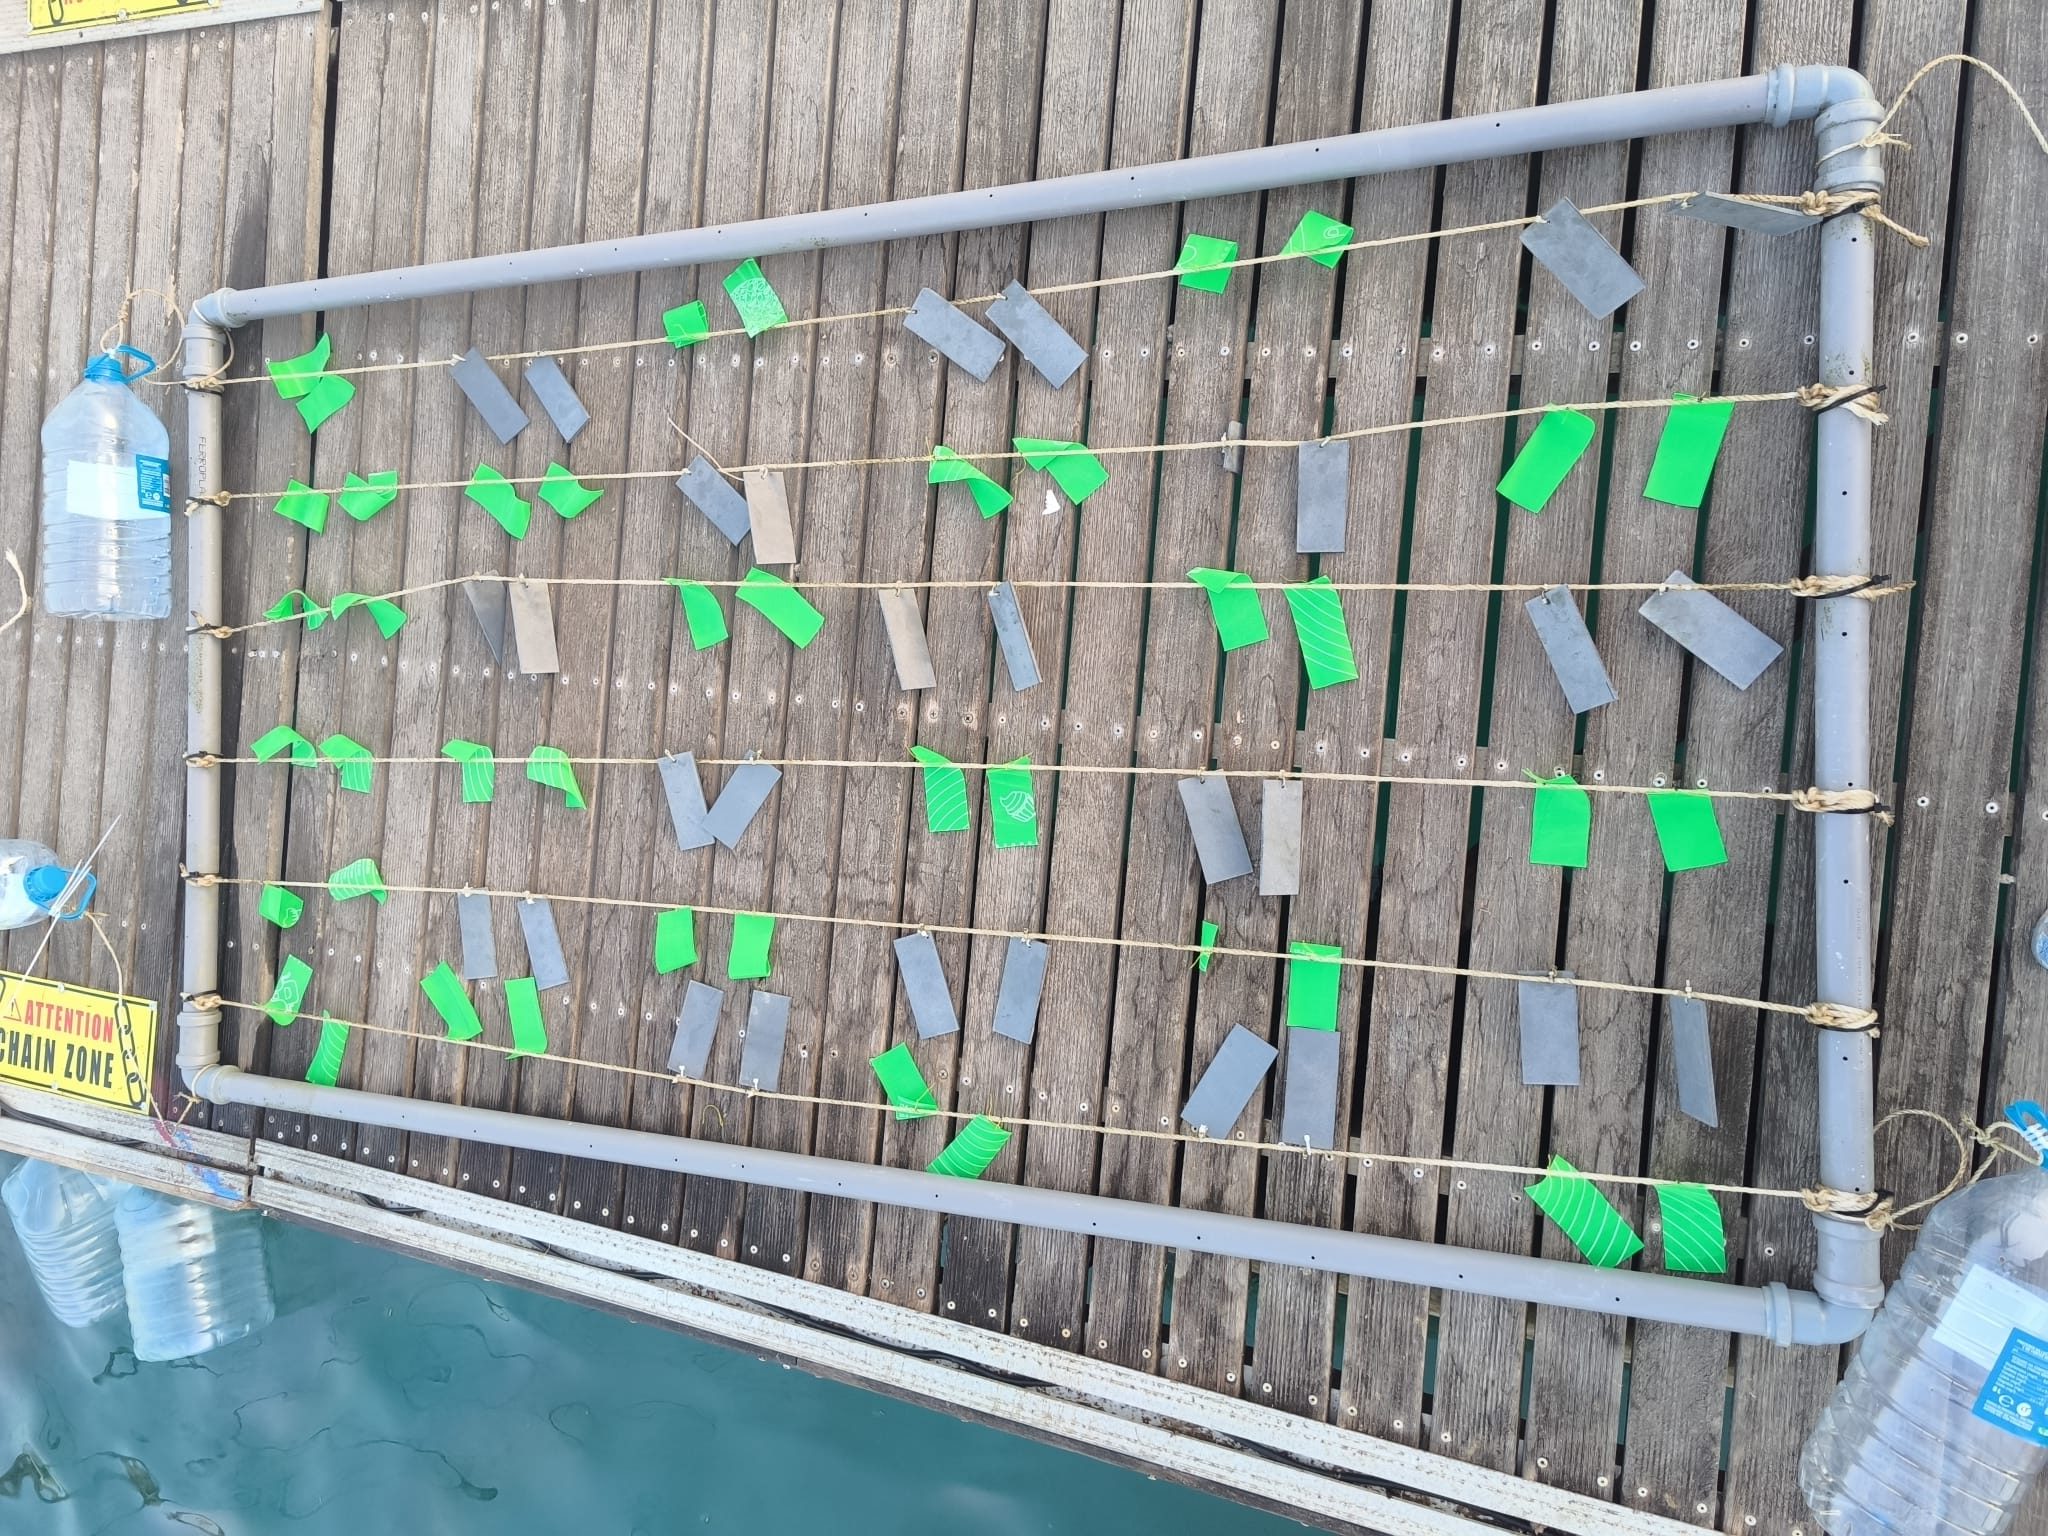
We then installed the lighting system with the help of Eder, who is a technician at OSCM. All electronics were kept in waterproof dry boxes, and we built wooden arms with metal brackets to hold them in their place on the pontoon. We aimed to create similar light fields for both of our frames: Andrea’s with an intensity of 10–20 lux, while Sarah’s had 20–30 lux. After some trial and error, we managed to tune the LEDs perfectly.
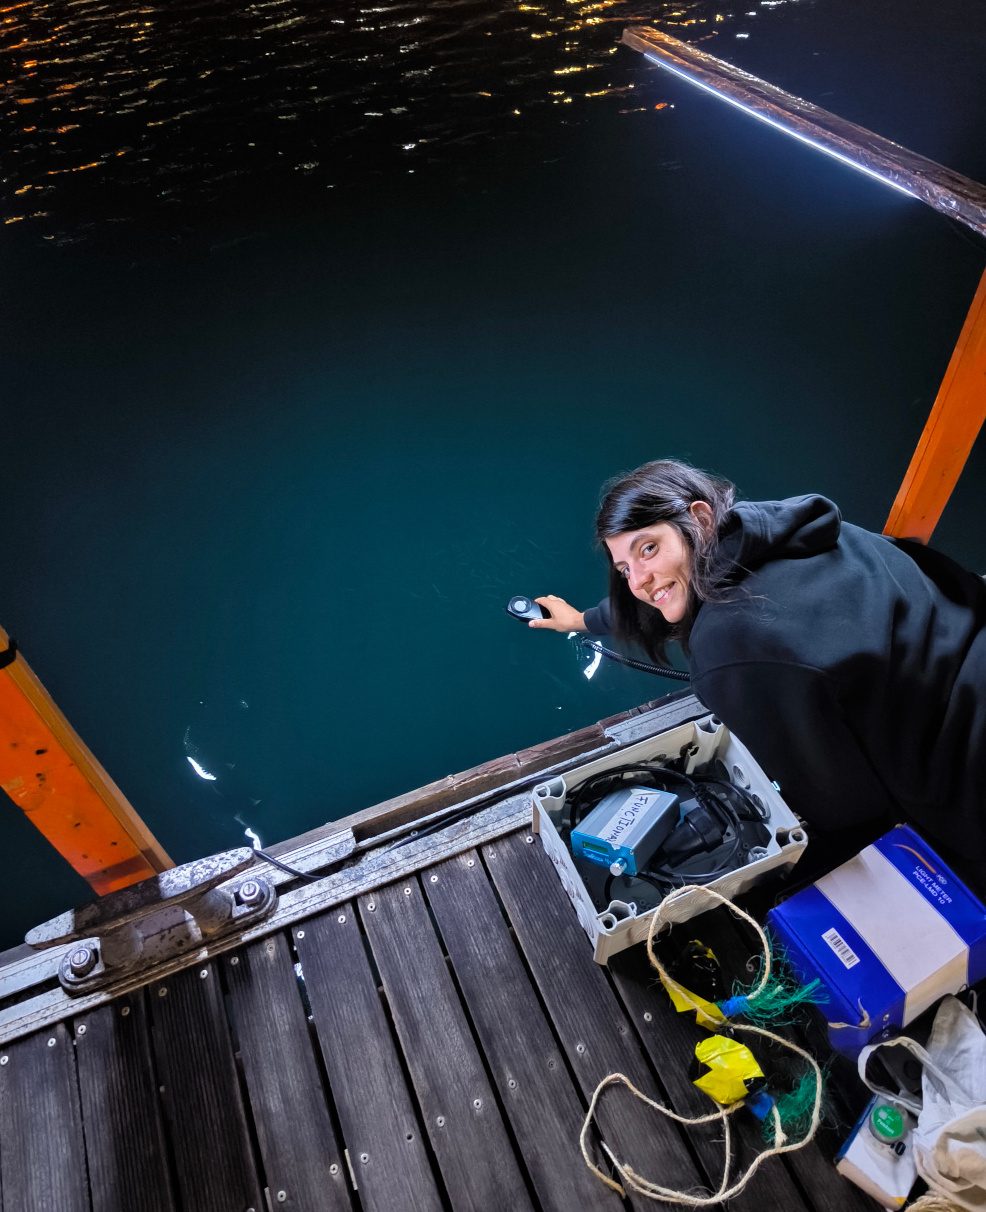
However, the real challenge in June was not the construction – it was the wind. With daily gusts of 25–40 km/h, anything lightweight was instantly blown away and we are proud to say that we only lost one measuring tape to the sea. Along the way, we pulled plenty of harbour trash from the water, but also some unusual finds – like a fully inflated unicorn float. We even managed to recover the lid of our dry box from the seafloor, along with a couple of our caps. Hats, in fact, did not stand a chance in the winds of June and keeping them on our heads required constant hand support, so we eventually gave up.
By early July, just in time for our first experiment, the weather turned calmer. This made deploying the frames with our kayak much easier. Earlier, any pause in paddling would have sent us drifting straight back to the pontoon. The kayak also came in handy for measuring the water depth at the experimental site and for adjusting our mooring lines.
In this moment, we were optimistic: The project was starting to get on track. It seemed that we could finally switch on the autopilot and continue the work as outlined in the GAME 2025 manual. However, first we had to test the different steps of the analytical processes in the laboratory. We collected some of the fake algae that we had placed on the frames as backups in case of losses, put them in freezer bags and packed the freezer bags in larger black bags that we filled with ice and transported them to the laboratory. The first step, i.e. scraping the epiphytes from the substrates, went well, but a problem emerged when we tried to perform vacuum filtration. For this, the suspension of seawater, epiphytes, and sediment was poured into the funnel of the filtration unit, and the device was turned on. After a considerable amount of time, we could see that the volume in the funnel had not changed, because the sediment had clogged the flow of water through the filter. We were once again faced with a new impasse, and this one required a solution within a week. This was because the first experiment had already been running for more than seven days and could only continue for one more week. We tried decanting, but the epiphytes and sediment settled at a similar rate at the bottom of the beaker, making it difficult to separate them. Then we tried sieving through different sized meshes, but in doing so we lost a lot of biomass, what would have compromised our results. We also tried a method involving aliquots, which could have worked, but it took too long to test it a second time.
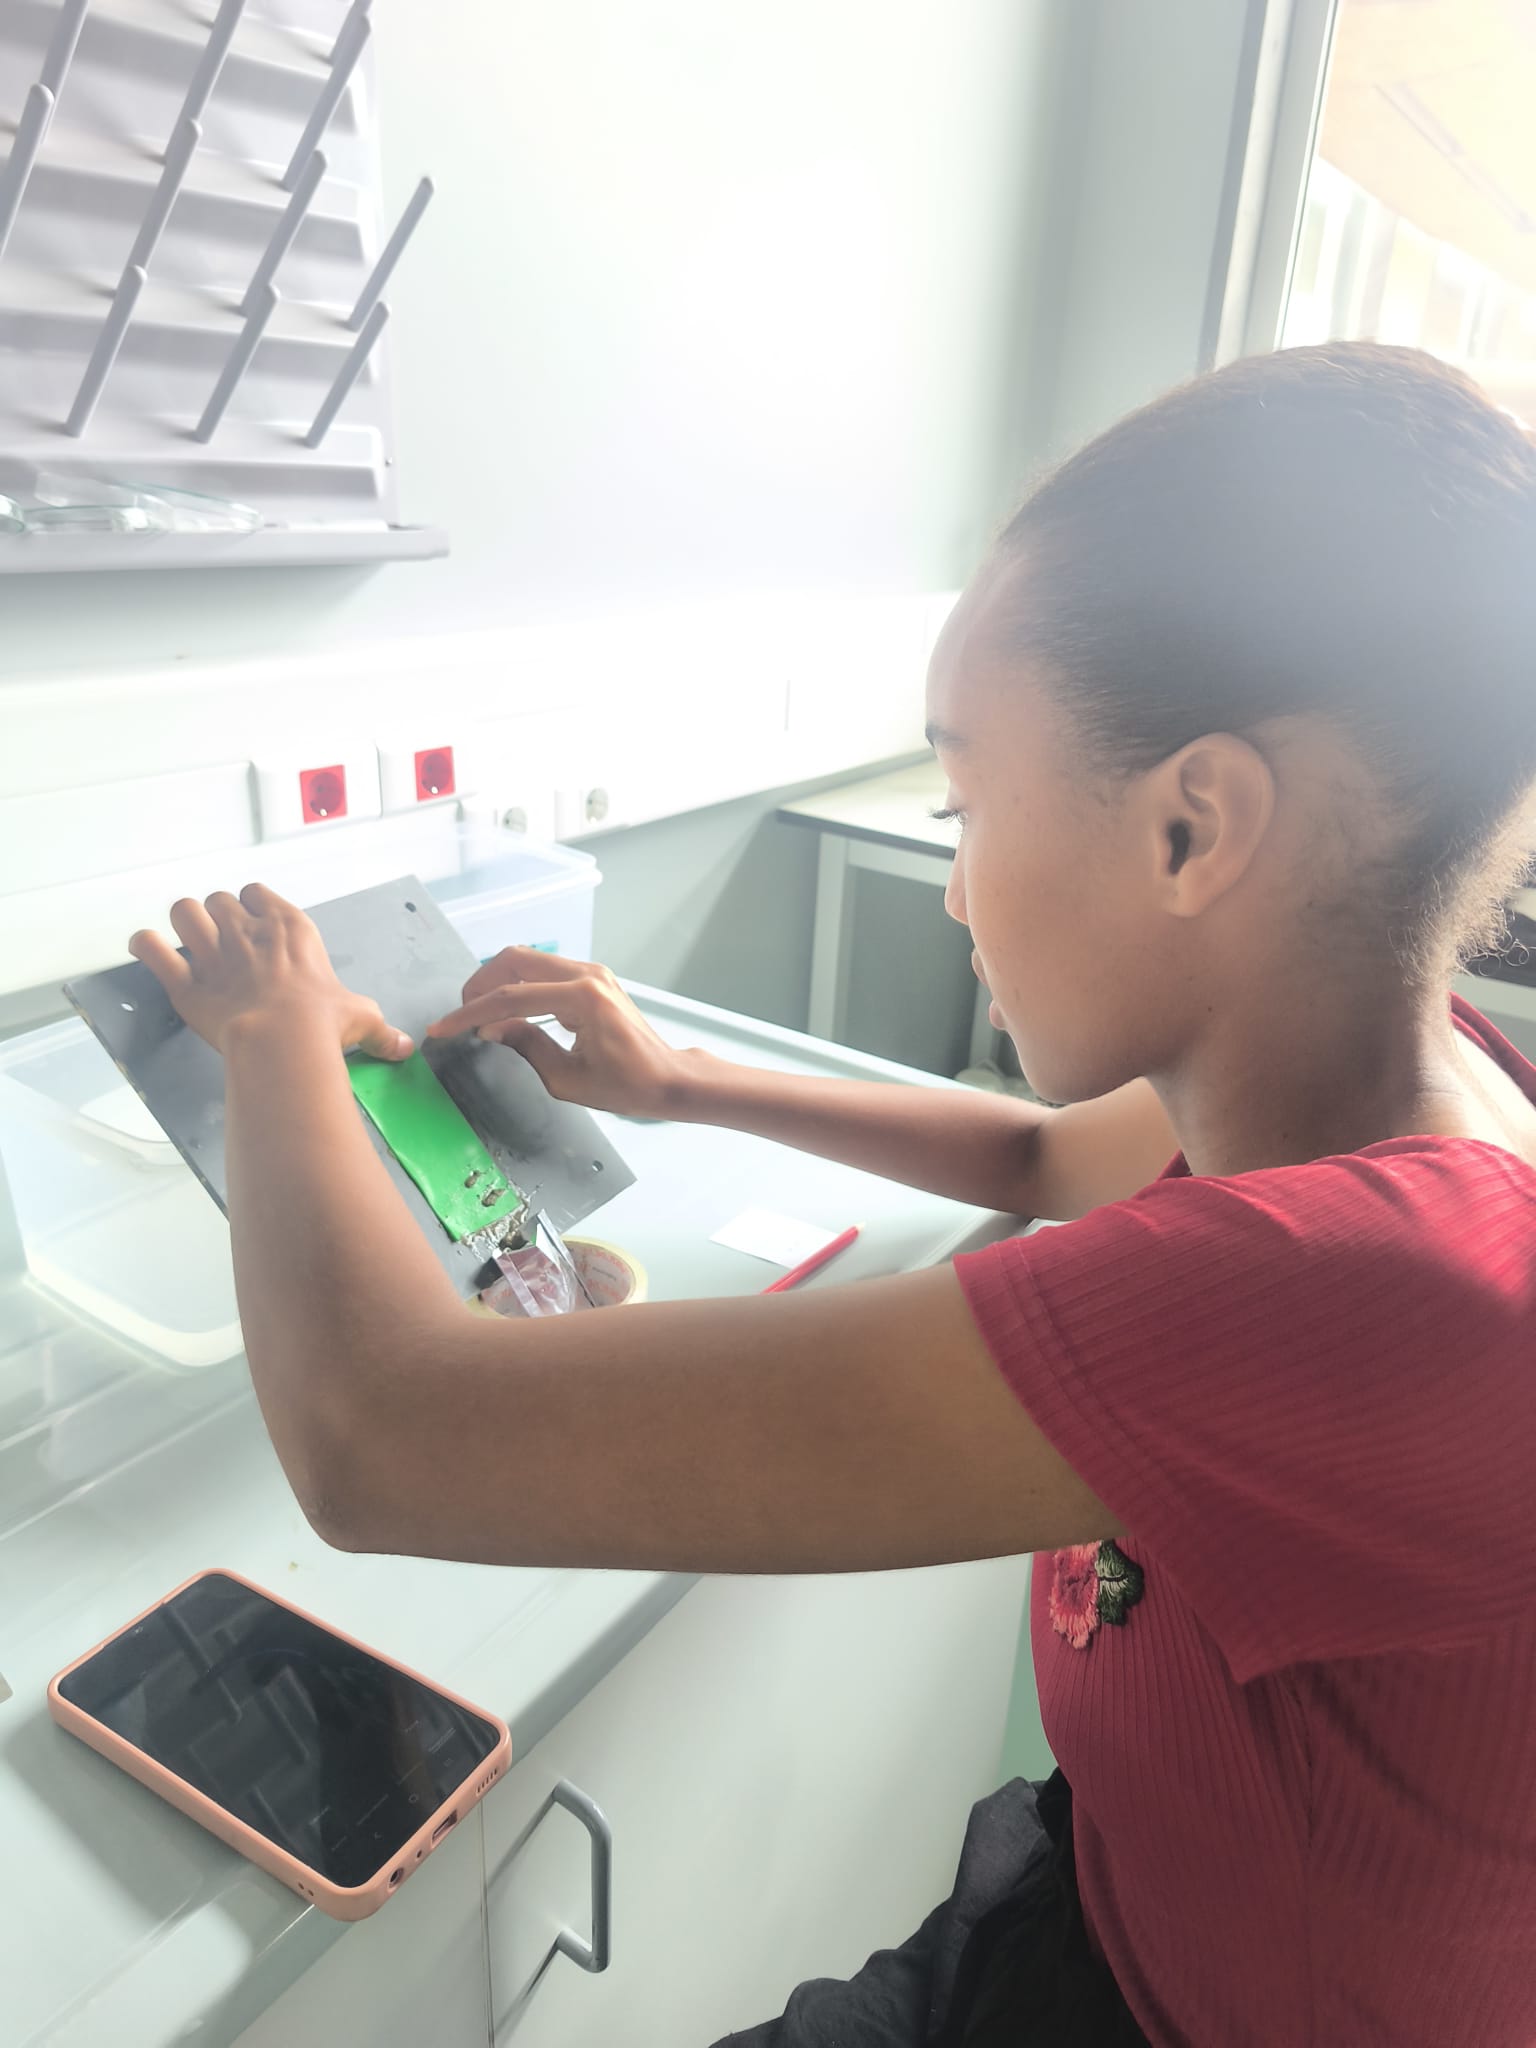
With no time left, we decided to remove the filtration step and to leave the sediment in our samples, as we simply could not get rid of it. Hence, the freezer bags were already drained at the study site. In the laboratory, the epiphytes were scraped off and directly transferred to test tubes, which were then filled up with ethanol. This method proved to be successful as we obtained chlorophyll a concentrations that were similar to those of the other GAME teams. For the biomass samples, a similar method was used, but their processing required the use of a muffle oven to obtain the ash-free dry weight. As none of the institutions here in Mindelo have such equipment, the samples were transported to Germany to muffle them at GEOMAR.
At this point, we were already thinking about what aspects could be improved in our second experiment, which was already underway. Furthermore, Sarah recently completed her first dive, spotting a nurse shark, plenty of fish, and sea turtles. She was hoping to spend more evenings at the beach in the coming weeks, playing volleyball and enjoying live music, especially during the Baía das Gatas Festival—one of the largest festivals in the country—which was approaching. In the words of our advisor, “The project is now running smoothly.” However, no one expected that in August a country that rarely receives rain throughout the year would be shaken by the biggest storm in living memory.
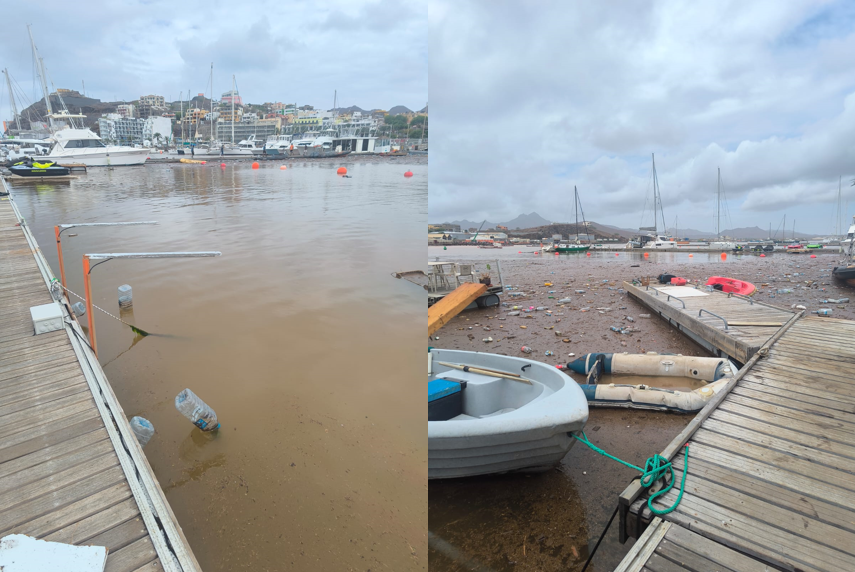
In the early hours of August 11th, storm Erin arrived without warning, causing material losses and, sadly, claiming the lives of nine people on the island of São Vicente. During the night, the scene was one of horror, with streets turned into rivers, lightning illuminating the entire city, and people desperately fighting for their lives and those of their loved ones as rainwater flooded their homes. In the morning, it was then possible to get a real sense of what had happened. Buildings had been knocked down, cars carried out to sea, shops destroyed, all caused by the force of the rainwater. The Mindelo micro-watershed, characterized by a mountainous terrain and a rugged topography, allowed the rainwater that fell on the city to flush to Porto Grande Bay, resulting in an exacerbated discharge of muddy water accompanied by trash. Experiment 2, which had already been in the water for a week, was canceled as the conditions in the bay no longer met the requirements for conducting an experiment. Square kilometers of water that had been crystal clear had turned brown and opaque, and we had no idea how long these conditions would last.
Soon after the storm, it was decided that the team would split up: Sarah would go to Finland to continue her project with the GAME team there, and Andrea would stay here to continue as soon as conditions had improved. A month passed, and the bay was slowly returning to its normal colour, but then another rain came and turned it brown again. Then it was too late to repeat experiment 2. But all is not lost. In January 2026, after we had completed the last phase of the project at GEOMAR in Kiel, Andrea considered to continue with the experimental work. At this time, the rainy season in Cabo Verde was over, and the water was still at mild temperatures.
The unforgettable catastrophe of August 11th 2025 in São Vicente allowed us to speculate on the origin of the mud/sediment that affected our experiment. The sediment that accumulated on the substrates probably came from the muddy water that floods Porto Grande Bay every year during the rainy season. Somehow—possibly due to the regular entry and exit of ferries from the port—the sediment gets resuspended frequently and travels through the water column by the forces of tidal currents and others. At least one riddle was solved.

When I attended the OBIS Data Mobilization Workshop in the Azores (Thanks to the Air Center) this year, one observation immediately caught my attention: compared with countries such as the United States, Europe still appears surprisingly fragmented and underinvested in biodiversity data mobilization. The issue is not necessarily a lack of biodiversity research. European scientists produce enormous amounts of ecological data. The challenge is that publishing biodiversity observations into global infrastructures such as MBON/GBIF often remains an additional task rather than an integral part of funded research. In the United States, biodiversity data publication is frequently embedded in funding mechanisms and institutional mandates. Data management, curation, and dissemination seem to be recognized research activities. In much of Europe, including Denmark, researchers often mobilize data on top of their existing responsibilities, with limited dedicated funding for long-term stewardship.
I asked myself how is Denmark performing compared with its Nordic and neighboring countries?
Denmark is not lagging behind, but neither is it leading
The numbers reveal a mixed picture.
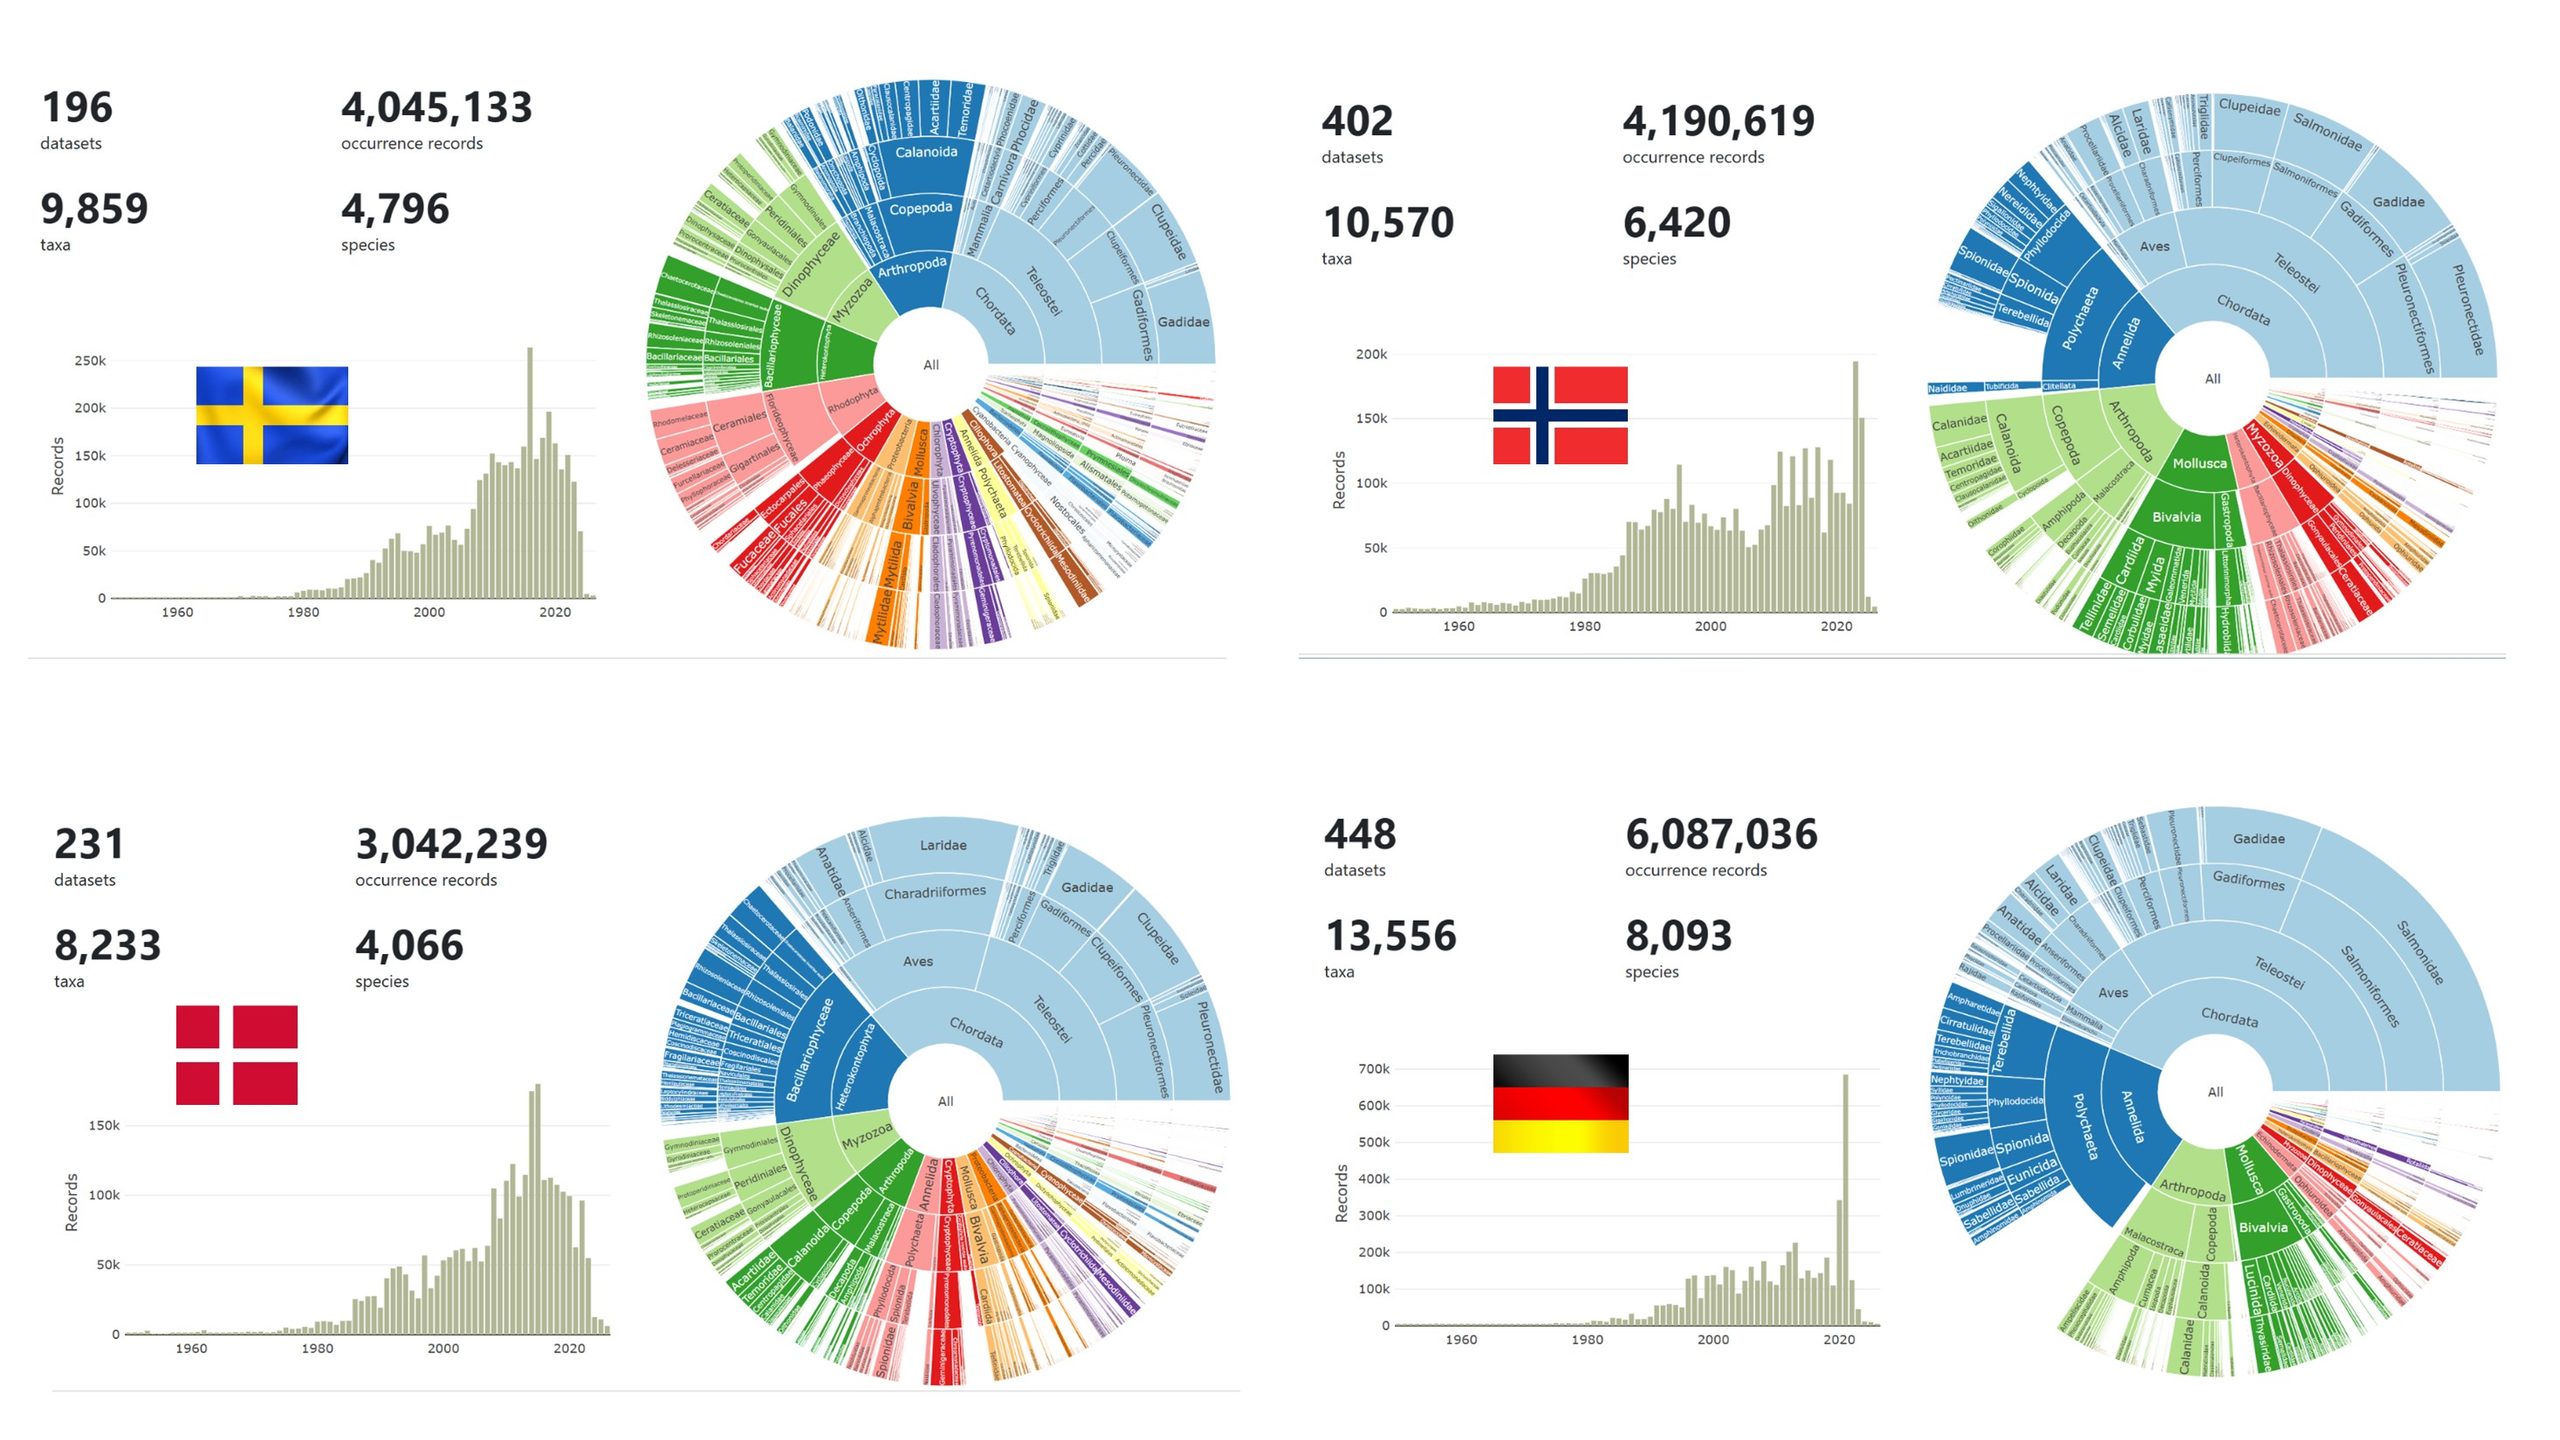
Germany clearly stands out as the regional leader, with both the highest number of datasets and the highest taxonomic coverage. Denmark has the lowest number of occurrence records and species represented among the four countries, despite having a very active biodiversity research community. What is striking is that Denmark does not fall dramatically behind in dataset numbers. Rather, the difference appears in scale and breadth. Danish datasets tend to contain fewer records and cover fewer taxa than those from Germany, Norway, and Sweden.
Different countries tell different biodiversity stories
The taxonomic breakdowns are equally revealing. Denmark should appreciate its fish and birds’ activists. Large portions of the records belong to Gadidae (cod family), Clupeidae (herring family), Laridae (gulls), and other marine vertebrates. This reflects Denmark’s historical strengths in fisheries monitoring, marine ecology, and seabird observations. However, many invertebrate groups, microorganisms, and less visible components of biodiversity remain comparatively underrepresented in global data sets despite active programs like national Program like MONIS.
Norway shows stronger contributions from invertebrate sides such as polychaetes, bivalves, copepods, and marine benthic fauna. The Norwegian data landscape appears heavily influenced by aquaculture sectores, long-term marine monitoring programs and offshore environmental surveys. There is greater representation of marine invertebrates, which are often critical indicators of ecosystem change.
What stood out in Sweden’s data profile is the relatively large contribution from copepods, diatoms, dinoflagellates, and macroalgae. These groups are often overlooked in biodiversity databases because they require specialized expertise and monitoring programs. Sweden’s contribution suggests sustained investment in aquatic ecosystem monitoring beyond commercially important species. Well done Sweden!
Germany’s profile appears the most diverse. While fish and vertebrates remain important, there are strong contributions from polychaete worms, molluscs, arthropods, plankton in general term and benthic organisms. Germany not only contributes more records but also appears to mobilize a wider variety of biodiversity data types. You made me proud Germany 
The real gap may be invisible biodiversity
One lesson from the workshop was that biodiversity databases often reflect what is easiest to observe, identify, and fund. Fish, birds, and mammals are well represented almost everywhere. The groups that drive ecosystem processes, such as jellyfish, zooplankton, benthic invertebrates, phytoplankton, and microbial communities, remain far less visible. This is particularly relevant for marine ecosystems. Some of the most important ecological changes currently occurring in our seas involve gelatinous zooplankton, plankton communities, and benthic assemblages, yet these groups remain underrepresented in many biodiversity repositories. For someone working with jellyfish and marine food webs, this raises an important question:
Are we documenting the biodiversity that is easiest to count, or the biodiversity that is most important for understanding ecosystem change?
This fall, Ocean Conservancy is celebrating its 41st annual International Coastal Cleanup® (ICC), once again bringing together volunteers to protect the beaches and waterways we all love. Ocean Conservancy recently hosted flagship events in Long Beach and Washington, D.C. that celebrated this global movement close to home.
Over the past four decades, nearly 20 million volunteers have rolled up their sleeves to remove more than 405 million pounds of trash from beaches and waterways around the world. And their impact extends far beyond what they collect. ICC volunteers have documented nearly 440 million individual items, creating the world’s largest marine debris database and providing invaluable information that helps Ocean Conservancy and others better understand—and tackle—ocean plastic pollution.
This year’s celebration continued that incredible legacy. At Alamitos Beach in Southern California, more than 150 volunteers gathered on September 19 and removed 1,109 pounds of trash, alongside members of Team USA Artistic Swimming and Olympic and Paralympic athletes. In Washington, D.C., 439 volunteers gathered on September 26 to remove 2,182 pounds of trash from Anacostia Park along the Anacostia River.


“I am so grateful to all of the volunteers who came out today for our ocean—and every volunteer who has made the last 41 years of impact possible,” said Ocean Conservancy’s Senior Director of Conservation Cleanups, Allison Schutes. “Every piece of plastic collected helps protect marine animals and habitats and contributes to research and advocacy.”
And the impact doesn’t stop when the cleanup ends. During International Coastal Cleanup events, volunteers do more than remove trash: They document what they find, helping build a clearer picture of the plastic pollution threatening our waterways and wildlife. Through the Clean Swell® app or paper data sheets, ICC volunteers contribute to Ocean Conservancy’s online, open-access database, the world’s largest repository of marine debris data. These records help scientists, conservation groups and governments understand pollution trends and identify solutions.
That data can also drive meaningful policy change. ICC data were recently used in a peer-reviewed study showing that plastic bag bans lead to reduced plastic bag pollution. The data have also helped advance policies ranging from California’s SB 54 to Florida’s balloon release ban and the federal Farewell to Foam Act. From a neighborhood cleanup to statewide action, every piece of documented trash helps build the evidence needed to tackle plastic pollution at its source.