

An acceleration in human-caused global warming could see the Paris Agreement’s 1.5C limit breached before 2030, a new study suggests.
The paper, published in Geophysical Research Letters, finds that, over the past decade, the planet has been warming at its fastest rate on record.
The authors isolate the trend of human-driven warming in the long-term global temperature record, removing the influence of natural factors, such as El Niño, volcanic eruptions and solar variation.
They find that the world had been warming at a rate of around 0.2C per decade since the 1970s, but has “accelerated” since 2015 to a rate of 0.35C per decade.
The study warns that if the current rate of warming persists, the 1.5C Paris threshold will be breached in the next few years.
“The essential result of this paper isn’t how fast we’re warming, but that warming is now happening faster than before and that the difference isn’t negligible,” an author on the study tells Carbon Brief.
Warming signal
The year 2024 was the hottest on record, with global average temperatures at the surface exceeding 1.5C above pre-industrial levels for the first time.
Crossing the 1.5C threshold in a single year is not equivalent to a breach of the Paris Agreement, which refers to long-term warming – typically interpreted as over a 20-year period.
However, rapidly rising global temperatures are prompting scientists to ask when this internationally recognised threshold might be broken.
Human activity has been the primary driver of rising global temperature in the long term, through greenhouse gas emissions and land-use change. However, natural factors also have warming and cooling effects from year to year.
The study authors identified three main sources of this natural variability.
El Niño and La Niña – collectively referred to as the El Niño-Southern Oscillation (ENSO) – are generally the largest drivers of year-to-year fluctuations in global temperatures. The study authors identify volcanic activity and changes in solar variation as the other two main natural influences on global temperature trends.
Study author Dr Grant Foster, formerly from the consulting firm Tempo Analytics and now retired, describes these sources of natural variability as “random noise” that sits on top of the long-term warming signal. He explains that “the larger the noise, the harder it is to see the real trend”.
To isolate the warming trend, the authors used a statistical technique that they first employed in a 2011 paper to remove the contributions of ENSO, volcanic activity and solar variation from the global temperature record.
The authors carried out this analysis on five separate datasets of global average surface temperature – NASA, NOAA, the Met Office Hadley Centre and University of East Anglia’s HadCRUT5, Berkeley Earth and Copernicus ERA5.
The plots below show the global temperature between 1880 and 2024, relative to pre-industrial temperatures, from the five datasets.
Each plot shows the original warming record (light blue), in which all drivers of warming are included, as well as the adjusted record (dark blue) which excludes the effects of ENSO, volcanoes and solar activity.
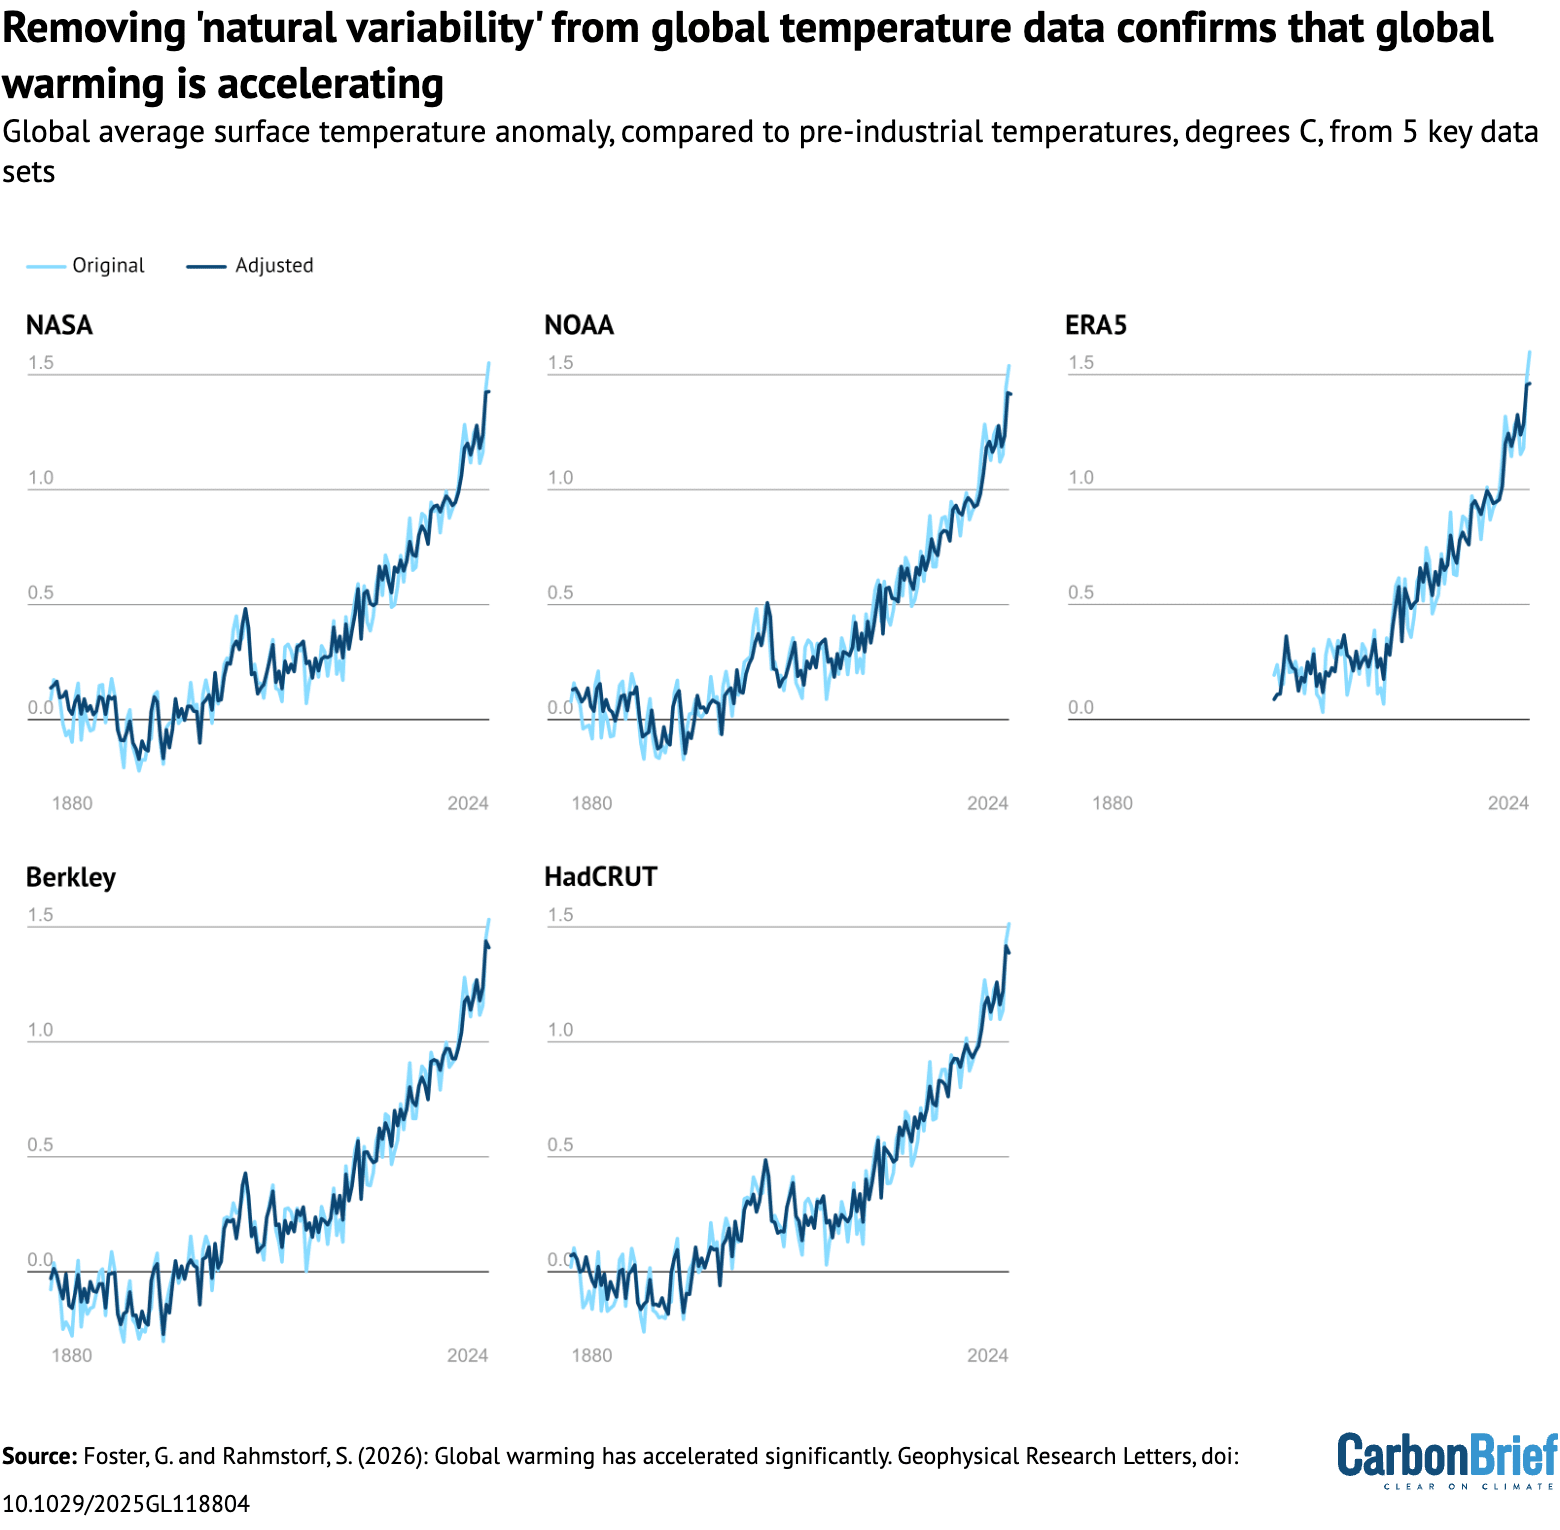
Removing the effects of natural variability makes the years 2023 and 2024 slightly cooler, the study notes, but they remain the two warmest years since the beginning of instrumental record.
Acceleration
Record-high temperatures in recent years have led scientists to ask whether global warming is accelerating.
The authors of the new study decided to use two different statistical approaches to test whether they can identify a “statistically significant” acceleration in global warming from the long-term temperature record.
The “noise” from natural drivers of temperature change, such as ENSO, can make it tricky to spot underlying trends. However, Foster tells Carbon Brief that after removing the influence of natural variability, “acceleration is easy to prove statistically – some might even say it becomes obvious”.
Both tests find that warming is accelerating with more than 98% confidence for each of the five datasets. When the same tests were run on the unadjusted data, they failed to reach even 95% confidence, showing the importance of removing natural variability from the warming signal, according to the study authors.
Under the first statistical approach, called a quadratic analysis, the authors applied a single curved trend line to the warming signal.
For the second approach, the authors used a technique to identify the month when the rate of global warming changed noticeably. The different datasets estimated this date to range from February 2013 to February 2014. They then calculated the speed of global warming both before and after these dates.
Global temperatures increased at an average rate of around 0.2C per decade over 1970-2015, according to the study.
In contrast, the authors find that warming rates have increased to 0.34-0.42C per decade, across the five different datasets, since the February 2013-February 2014 period.
The study reveals that the rate of warming observed over the past decade has been higher than any previous decade in the instrumental record.
Foster tells Carbon Brief that “the essential result of this paper isn’t how fast we’re warming, but that warming is now happening faster than before and that the difference isn’t negligible”.
If this warming rate remains constant, the Paris Agreement 1.5C threshold would be breached between 2026 and 2029, the authors find.
(Their approach estimates the 20-year period where the average exceeds 1.5C of warming, and the breach of the limit is taken as the halfway point in this period.)
The table below shows key results for the five different datasets, including estimates for the date that warming started accelerating, the rate of warming and the year that the Paris Agreement will be breached in each.
| Data source | Date of acceleration | Warming rate (C per decade) | Year to cross 1.5C |
|---|---|---|---|
| NASA | April 2013 | 0.36 | 2028 |
| NOAA | February 2013 | 0.36 | 2028 |
| HadCRUT | January 2014 | 0.34 | 2029 |
| Berkley | February 2014 | 0.36 | 2028 |
| ERA5 | February 2014 | 0.42 | 2026 |
Results for the five different datasets, including estimates for the date that warming started accelerating, the rate of warming and the year that the Paris Agreement will be breached in each. Source: Foster and Rahmstorf (2026).
‘Statistical significance’
There are “many opinions” among climate scientists about how fast the planet is currently warming, Foster tells Carbon Brief.
For example, a study from Dr James Hansen calculates a warming rate of 0.27C per decade after 2010. Similarly, the latest Indicators of Global Climate Change report estimates warming of 0.27C per decade over 2015-24.
Foster continues:
“But we all agree it’s higher than before. [The] thing is, we couldn’t prove that statistically.”
Foster tells Carbon Brief that in 2024, Dr Claudie Beaulieu – an assistant professor at the University of California – led a study which concluded that “a recent surge in global warming is not detectable yet”.
Beaulieu used the same statistical method as Foster to investigate whether global temperature data shows an acceleration in warming. However, she did not first remove the natural drivers of temperature change, such as ENSO.
(Carbon Brief wrote about Beaulieu’s work in more detail when it was published.)
Foster tells Carbon Brief that the study was “excellent”, adding:
“They found that confirming acceleration was a close call – the data are very suggestive – but not quite ‘statistically significant.’”
Foster explains that after removing the natural influence, the warming trend is clearer, making it easier to find statistically significant warming levels.
Beaulieu praises the new study, explaining that “the fact that the acceleration signal appears consistently across all five independent datasets is reassuring”.
However, she stresses that “the acceleration may prove temporary”.
She says that “continued monitoring over the next several years will be essential to determine whether the accelerated warming rate identified here represents a lasting shift”.
The study authors say that the main limitation of their work is that the method of removing natural variability is “empirically based, but approximate and imperfect”.
Foster says:
“We estimate the impact of things like El Niño by comparing past values of the El Niño index to past temperature changes, hence we don’t need to know the physics behind it, just the numbers. Statistical results like this are only approximate.”
Meanwhile, an acceleration in warming is supported by many other observations of the Earth’s climate.
For example, ocean heat content – the measure of the amount of energy stored in the ocean – is rising year on year. There is also evidence of acceleration in recent years, with the period from 2020 onward seeing the largest year-to-year increases in ocean heat content on record.
In addition, the Earth’s energy imbalance, which measures the difference between incoming solar radiation and outgoing radiation, has also increased in recent years.


The post Pace of global warming has nearly doubled since 2015, reveals study appeared first on Carbon Brief.
Pace of global warming has nearly doubled since 2015, reveals study

Scientists have vowed to keep working on the next flagship set of reports for the Intergovernmental Panel on Climate Change (IPCC), after a political row over the timeline for their release saw its latest session suspended on Friday evening without agreement.
During the weekend, government officials and scientists alike expressed disappointment over the inability to reach a compromise before some delegates from developing countries and small island states had to leave the week-long meeting in Ethiopia to catch flights home.
The disagreement – which has persisted since early 2024 – turns on whether the three key parts of the AR7 assessment should all be published before the conclusion of the UN’s next Global Stocktake of global climate action, which is due to be completed in late 2028.
The IPCC issued a statement after the close of the session, saying that “key agenda items” – the timelines for the three AR7 reports, as well as the IPCC budget – remain open and under discussion. It said the IPCC’s plenary session and its deliberations on the pending agenda “will resume at the earliest opportunity”, giving no further details of when.
IPCC Chair Jim Skea told delegates in closing remarks that recent months had been some of the most turbulent for the climate science panel and that, if there were stronger words than “profound disappointment” he would use them, according to a summary published by the Earth Negotiators Bulletin (ENB). IPCC discussions happen behind closed doors.
IPCC scientists remained committed
In an open letter, issued on Monday, a group of nearly 120 scientists – from a total of 664 AR7 authors – said they “stand committed to continue working to deliver the AR7 reports in a manner that is rigorous, timely and inclusive, in line with our mandate to be policy-relevant”.
“An assessment that arrives after the decisions it is meant to inform cannot serve its purpose,” they emphasised. “The second Global Stocktake in 2028 is such a decision point, and the world should not have to face it without the IPCCʼs latest assessment.”
Europe, small islands and the least developed countries, plus many Latin American and developed nations, want the IPCC to meet this deadline, arguing that the findings from the UN climate science body are irreplaceable in the UN climate policy-making process.
However, around a dozen developing countries plus Russia have argued that the reports should come later in order to allow for greater research input from the Global South – something that, in their view, would make the findings fairer. They also claim that a shorter timeline would put excessive pressure on experts.
-
Who shapes climate science? The equity question facing the IPCC
Early completion of the next global climate science assessment reports risks excluding research from the Global South, which is key to ensuring the findings are fair -
Governments that support climate science must stand firm against naysayers
The IPCC is meeting to decide the timing of its next major report, as some countries try to delay it and weaken the case for faster emissions cuts


The most vocal of this group at last week’s meeting were India and Saudi Arabia, according to the ENB summary and a developed country diplomat. Critics see this push for a longer timeline as an excuse to deprive government decision-makers of the latest science and ease pressure on emerging economies to raise their ambition, particularly on cutting emissions.
Commenting on last week’s meeting, France’s ambassador for climate negotiations Benoît Faraco said a broad coalition of developed and developing countries from all five continents, “united in their support for science and the timeline proposed by scientists”, had withstood pressure “from a few countries” seeking to slow down the process of adopting the IPCC reports.
He added that France would not back down and would “continue to fight tirelessly for science, protect the integrity of information, and convince our partners that without the best available scientific data, we will be less effective in tackling climate change and protecting our populations”.
Inclusivity proposal stalled
In a bid to unlock a solution for the AR7 timeline, countries discussed ways to improve the inclusivity of the IPCC’s work. One option put on the table was for the IPCC to expand its funding for delegates from developing countries to attend some or all of its sessions from one to two participants, according to the ENB summary and a delegate speaking to Climate Home News.
That would increase the costs for the IPCC to complete AR7 by up to a quarter, according to an assessment shared by the secretariat. The panel’s budget is under severe strain and its officials have warned that, without additional voluntary contributions, it risks running out of money before it can deliver on this assessment cycle.
Climate Home News understands that some of the IPCC’s traditional donors – which mainly include European countries, Japan and Australia – indicated a willingness to support funding for an additional developing country participant. But without an agreement over the budget or the timeline for the reports, that option was ultimately not adopted.
‘Disappointed and worried’
The three reports are managed by working groups that collate and draw overall findings from the latest scientific studies and data on the physical effects of global warming around the world, how to adapt to it, and pathways for cutting planet-heating emissions in order to meet the temperature goals of the Paris Agreement.
Winston Chow, an urban climate professor at Singapore Management University who co-chairs Working Group II on adaptation, wrote in a LinkedIn post that he was “disappointed and worried” for the IPCC authors who have worked “extraordinarily hard” to assess the relevant climate science over the past two years.
He said he shared their concern that “the rigour, time and goodwill they’ve invested are now being put at risk by the Panel’s stalemate”.
As science comes under attack at UN talks, climate movement splits over how to respond
For Working Group II, a meeting for 250 experts writing that report is scheduled for January 2027, followed by the approval of a special report on cities and climate change in Singapore next March.
But because the IPCC’s budget has not been confirmed due to uncertainty about the AR7 schedule, travel support for those researchers is at risk, wrote Chow. “If they cannot participate, our assessments will lose vital expertise, perspectives and scientific breadth, and the collective effort of our authors will be undermined,” he warned.
Scientific work continues
Despite the political holdups, he – together with French climate scientist Robert Vautard, co-chair of Working Group 1 – agreed with IPCC head Skea who told the IPCC’s closing session on Friday: “The engine room of the IPCC is working, and it’s healthy.”
Vautard commented in a separate post on LinkedIn after it ended: “The boat is at full steam.” Working groups I and II are due to start revising the first drafts of their reports, while Working Group III on reducing emissions is finalising its first draft which will be out soon, he wrote.
“The most exciting two years of the cycle are ahead, for the authors. The momentum in the engine room is here and now. Trust the engine room!” he added.
The IPCC and some scientists report that progress has been made towards achieving an equitable balance of authors from the Global North and the Global South.
The group of researchers who signed the open letter on Monday noted that “inclusivity is at the heart of how we work”, with author teams bringing together experts from developed and developing countries with diverse backgrounds and at different stages of their careers.
Plea to overcome political differences
The signatories include several scientists from some of the countries opposed to the alignment of all IPCC reports with the Global Stocktake.
“We are committed to an assessment in which the knowledge, experience and priorities of every region are fully reflected, a commitment we share with the leadership of the IPCC.
Equity is built into how our assessment is being drafted,” they added.
They appealed to governments that make up the IPCC “to overcome their political differences and work together as we do as a global scientific community, so that we can deliver the IPCC reports the world needs to hear”.
In a statement published on Monday, IPCC chair Skea said reaching consensus on the schedule for the reports is “vital”. He added that the assessments provide authoritative scientific evidence to inform national climate policies, strengthen adaptation and resilience and support access to climate finance, as well as helping communicate the scale of the climate crisis and the urgency of efforts to tackle it.
The post IPCC scientists vow to press on with climate reports despite political deadlock appeared first on Climate Home News.
IPCC scientists vow to press on with climate reports despite political deadlock
An Lambrechts is a biodiversity politics expert at Greenpeace International with extensive experience in biodiversity-related multilateral negotiations. She is the head of the Greenpeace delegation at the Convention on Biological Diversity (CBD) COP17 happening in Yerevan, Armenia.
In 2022, COP15 delivered the landmark Kunming-Montreal Global Biodiversity Framework to halt and reverse biodiversity loss by 2030. With COP17 starting in Yerevan, we are now halfway to the deadline, and according to the first Global Review of progress, countries are not on track to meet the biodiversity targets, and implementation must accelerate fast.
One of the main findings of the Global Review is that funding falls far short of the scale needed to halt and reverse nature loss. But the crisis facing the world’s biodiversity is not an absolute scarcity of capital – it is a profound public policy distortion.
The global economy currently spends roughly $30 destroying nature for every single dollar invested in its protection. According to a report from the Intergovernmental Science-Policy Platform on Biodiversity and Ecosystem Services, a staggering $2.4 trillion is spent in public subsidies for fossil fuels, agriculture and water use, while global investment in biodiversity conservation and restoration stands at a mere $220 billion.
Countries urged to ramp up “insufficient” nature policies at COP17
Yet, discussions about how to close the biodiversity finance gap continue to claim that salvation lies in mobilising private capital, scaling offsets and “derisking” investments in nature. This is a fundamental misunderstanding of both the nature of ecological stewardship and of the global financial architecture.
Biodiversity conservation is not a speculative investment portfolio – it is the foundation of human survival. The health of our planet is a non-monetisable, non-excludable public good. Expecting profit-seeking private capital to protect nature perpetuates the structural drivers of ecosystem destruction in the first place.
But if private market mechanisms cannot save biodiversity, where will the necessary public resources come from?
Money going to the wrong places
The answer lies in recovering the vast public wealth currently drained by cross-border tax abuse, financial secrecy and corporate impunity. Finance and environment ministers meeting in Yerevan must give a strong political signal that, to avert ecological breakdown, countries need to take swift action to reform global tax rules, eliminate harmful public subsidies and cancel unsustainable sovereign debts for the public revenues to end up where they belong.
Extractive sectors such as industrial agriculture, fishing, timber and mining continue business-as-usual, often heavily subsidised by public treasuries, while voluntary carbon and biodiversity offset markets pose a serious risk to nature conservation. Offset schemes have delivered only a negligible fraction of the funding needed to preserve ecosystems, allowing industries to continue with their destructive business-as-usual practices.
-
Global deforestation slowed in 2025 but Brazil’s election could undo “fragile” gains
Countries remain 70% off track to meet a goal to end deforestation by 2030, as progress in Latin America offset by failures in Africa
