

English version below
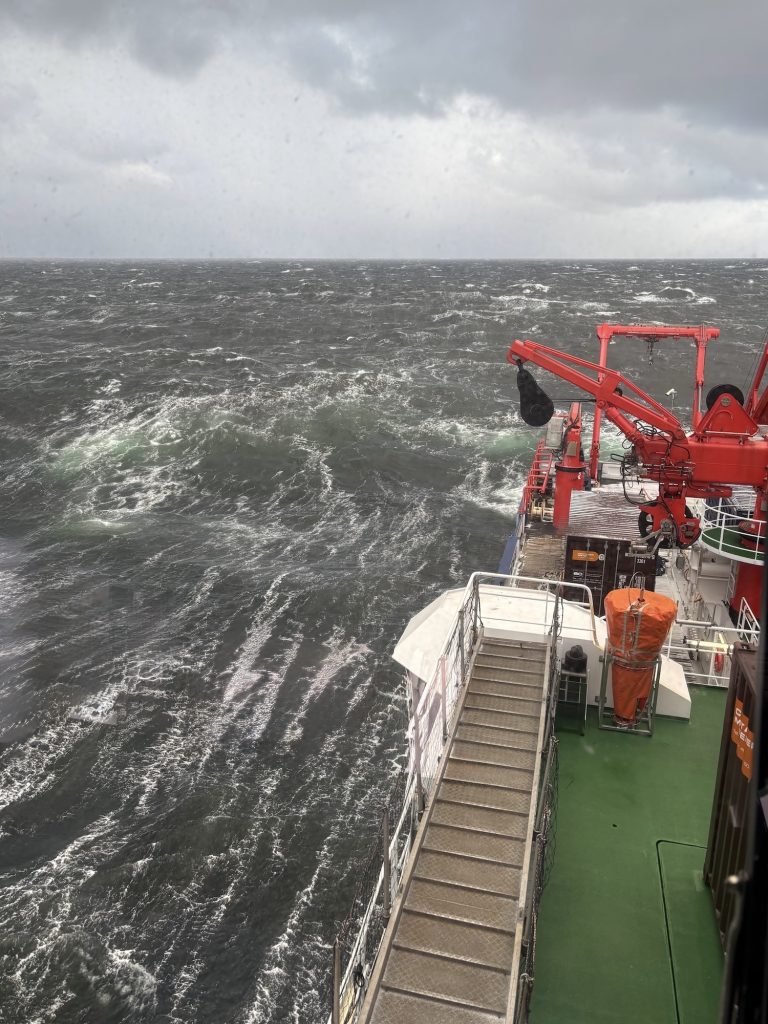
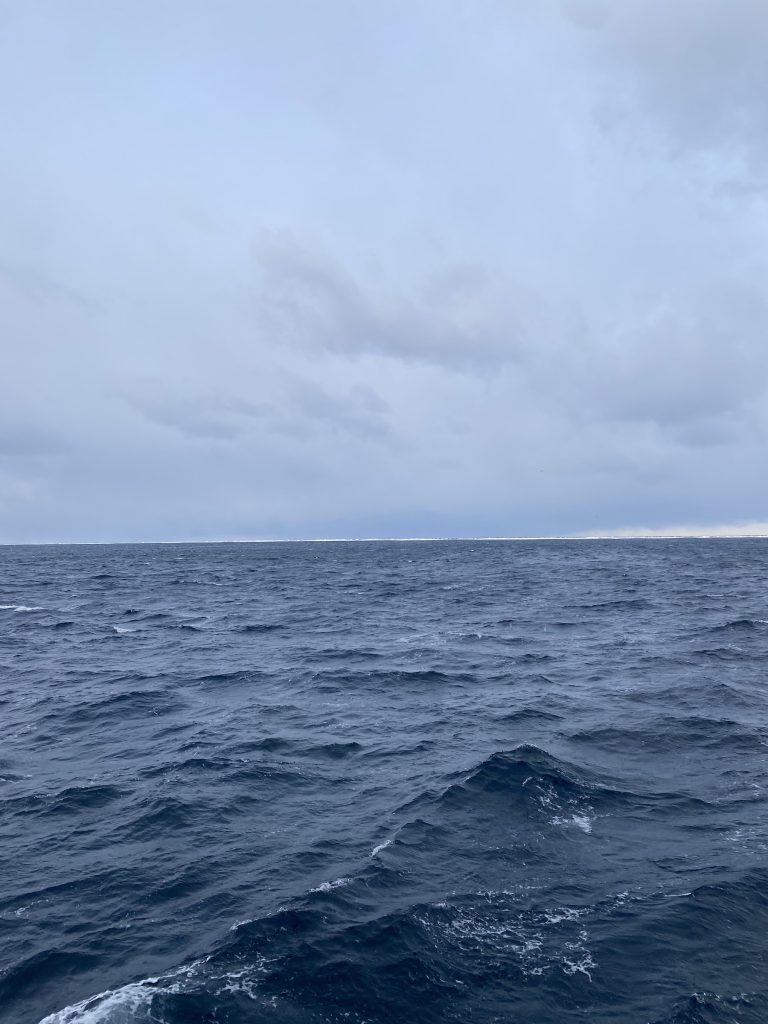
Für viele Menschen war es schwer zu verstehen, warum man im Frühjahr so weit nach Norden in die Labradorsee reist, um dort Forschung zu betreiben. Das Leben an Bord ist anstrengend und wird durch die harschen und schnell wechselnden Wetterbedingungen zusätzlich erschwert, was besonders den Einsatz unserer Forschungsgeräte kompliziert macht.
Worum geht es also bei unserer Expedition?
Diese Forschungsreise verfolgt zwei Hauptziele: die Untersuchung kleinräumiger Strukturen im Ozean und die Beobachtung großräumiger Meeresströmungen.
In den letzten Jahren haben Wissenschaftler erkannt, dass kleinräumige Strukturen im Ozean, wie Wirbel und Fronten, eine sehr wichtige Rolle spielen. Sie können starke Veränderungen in Temperatur und Salzgehalt verursachen, aber auch in anderen Eigenschaften wie Chlorophyll und dem Export von Kohlenstoff. Während dieser Fahrt nutzen wir eine Reihe von Instrumenten, um diese Strukturen detailliert zu beobachten und besser zu verstehen, wie sie funktionieren.
Das zweite Ziel besteht darin zu untersuchen, wie sich die Meeresströmungen im Atlantik im Laufe der Zeit verändern. Ein zentraler Bestandteil davon sind Langzeitbeobachtungen am 53°N-Observatorium. Dort betreiben wir sieben Verankerungen, lange Kabel, die am Meeresboden befestigt und mit Instrumenten ausgestattet sind, welche Temperatur, Salzgehalt, Sauerstoff und Strömungsgeschwindigkeit messen. Alle zwei Jahre bergen wir diese Verankerungen, sammeln die Daten ein und setzen sie anschließend erneut aus, damit die Messungen fortgeführt werden können.
Eine solche Expedition benötigt lange Vorbereitungszeit und einiges an Organisation auf See, deshalb habe ich unserem Chef-Wissenschaftler einige Fragen gestellt:
Wann haben die Vorbereitungen für die Expedition begonnen? Und wie lief das ab?
Der Antrag für diese Forschungsreise wurde bereits 2023 eingereicht. Darin wurden die Motivation, die Forschungsfragen und der Plan beschrieben, die Reise 2025 durchzuführen. Letztendlich wurde sie dann für 2026 angesetzt.
Die detaillierten Vorbereitungen begannen ungefähr ein Jahr im Voraus, also etwa im April 2025. Die Planung einer Forschungsreise umfasst mehrere Schritte. Wir müssen die Logistik organisieren, entscheiden, wer Teil des wissenschaftlichen Teams sein wird, und die wissenschaftlichen Arbeiten planen, die wir durchführen möchten. Und natürlich gehört auch eine ganze Menge Papierkram dazu 
Wann entstand die Idee, die Expedition im Frühling und nicht wie üblich im Sommer durchzuführen?
Die Idee entstand bei einem Projektantrag, den ich 2022 geschrieben habe. Er beinhaltete eine Forschungsfahrt zur Untersuchung kleinräumiger Ozeanstrukturen und ihrer Verbindung zur Frühjahrsblüte in der Labradorsee. Da wir speziell an der Frühjahrsblüte interessiert waren, war es wichtig, zu dieser Jahreszeit hier zu sein.
Das bedeutete, die Reise im Frühling zu planen, obwohl uns bewusst war, dass die Bedingungen schwieriger sein können als im Sommer. Aber wenn ich es noch einmal machen müsste, würde ich vorher einen Wetterbericht suchen, der einen deutlich ruhigeren März und April verspricht.
Was findest Du daran am interessantesten?
Hier draußen mitten im Ozean zu sein und die Daten, die wir sammeln, in Echtzeit zu betrachten. Es hat etwas ganz Besonderes, wenn die Messungen hereinkommen und man weiß, dass man den Ozean genau in diesem Moment beobachtet.
Wie werden die Entscheidungen zwischen Dir und dem Kapitän getroffen – in Bezug auf Wetter, Forschung und Sicherheit? Wann treffen Ihr euch? Und wie oft?
Von Anfang an haben wir vereinbart, etwa 36 Stunden im Voraus zu planen, angesichts des Umfangs der Arbeiten und der oft schwierigen Wetterbedingungen. Falls nötig, passen wir den Plan anschließend an.
Wir treffen uns jeden Morgen, ohne feste Uhrzeit, um gemeinsam den Wetterbericht anzuschauen und zu entscheiden, was machbar ist und was nicht. Bisher hat dieses Vorgehen sehr gut funktioniert. Gelegentlich mussten wir Arbeiten kurzfristig abbrechen, aber wir konnten uns immer anpassen, ohne viel wertvolle Forschungszeit zu verlieren.
Läuft die Expedition bisher wie geplant? Falls nicht, worin unterscheidet sie sich?
Die Daten, die wir bisher gesammelt haben, haben meine Erwartungen bereits übertroffen besonders angesichts der schwierigen Wetterbedingungen. Wir konnten sehr viel erreichen, und das liegt vor allem an der hervorragenden Zusammenarbeit zwischen der Schiffscrew und dem wissenschaftlichen Team an Bord.
Alle waren sehr flexibel und unterstützend, was es uns ermöglicht hat, uns schnell anzupassen und die verfügbare Zeit bestmöglich zu nutzen.
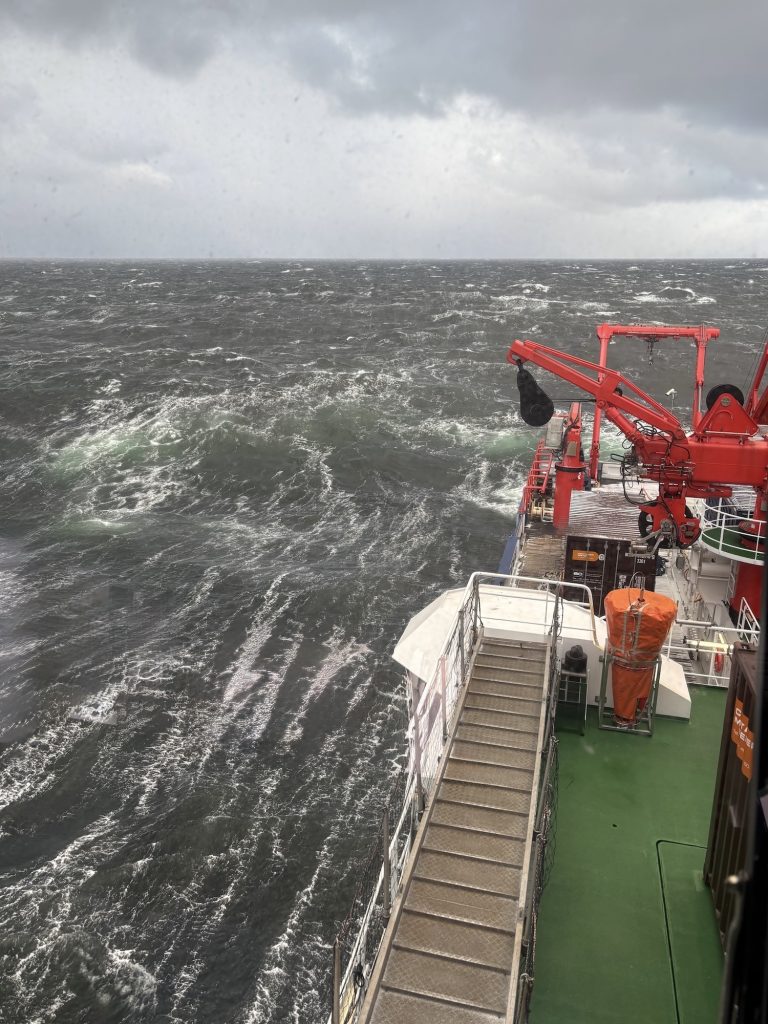
Tipp Nummer 1 für die Arbeit bei 10 Beaufort und 6 Meter hohen Wellen?
Immer eine Hand fürs Schiff und eine für die Wissenschaft
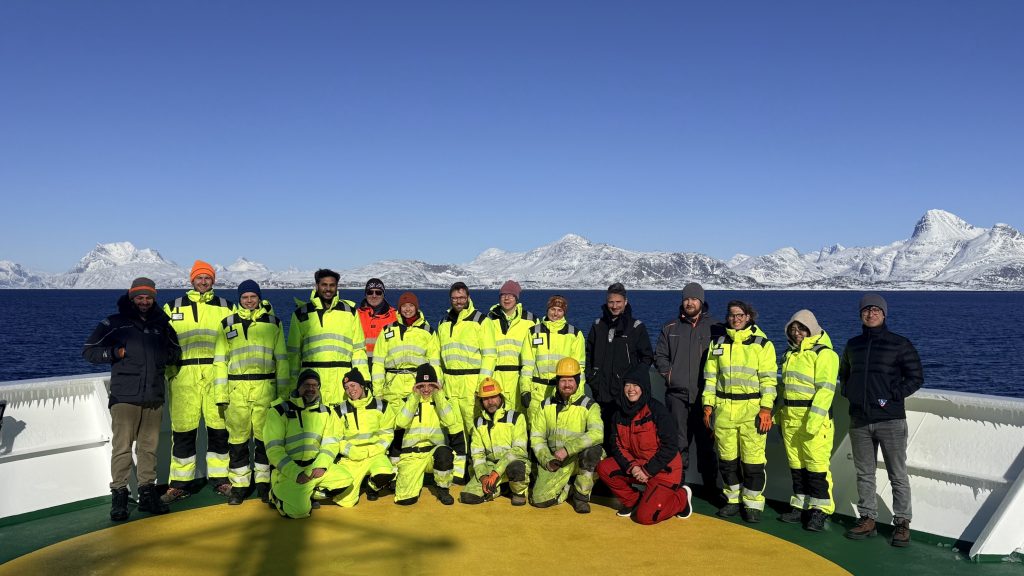
MSM142 – Who are we and why are we here in spring
For many people, it was difficult to understand why one would travel so far north to the Labrador Sea in spring to conduct research. Life on board is exhausting and made more challenging by harsh and rapidly changing weather conditions, which especially complicate the deployment of our research equipment.
So what is our cruise about?
This research cruise has two main goals: studying small-scale ocean features and monitoring large-scale ocean currents.
In recent years, scientists have realised that small-scale features in the ocean such as eddies and fronts play a very important role. They can create strong changes in temperature, salinity, and also in other properties like chlorophyll and carbon export. During this cruise, we use a range of instruments to observe these features in detail so we can better understand how they work.
The second goal is to study how ocean currents in the Atlantic are changing over time. A key part of this is long-term observations at the 53°N observatory. There, we maintain seven moorings long cables anchored to the seafloor and equipped with instruments that measure temperature, salinity, oxygen, and current velocity. Every two years, we recover these moorings to collect the data and then redeploy them to continue the measurements.
Such a cruise needs a long time of preparation and organisation during the cruise, so I asked our Chef Scientist a few questions:
When did you start preparing for the cruise? And how was that going?
The proposal for this cruise was submitted in 2023, which includes motivation and the research questions, with the plan to carry it out in 2025. In the end, it was scheduled for 2026. The detailed preparation really started about a year in advance, around April 2025.
Planning a research cruise involves several steps. We have to organise the logistics, decide who will be part of the science team, and plan the scientific work we want to carry out. And, of course… quite a bit of paperwork
When did you come up with the idea to have the cruise in spring, and not as usually in summer?
The idea goes back to a proposal I was writing in 2022. It included a cruise to study small-scale ocean features and how they are connected to the spring bloom in the Labrador Sea.
Since we were specifically interested in the spring bloom, it was important to be here at that time of year. That meant planning the cruise in spring, even though we knew that the conditions can be more challenging than in summer. But if I would have to do it again, I would look in the weather forecast in advance for a much calmer March and April.
What do you find the most interesting about it?
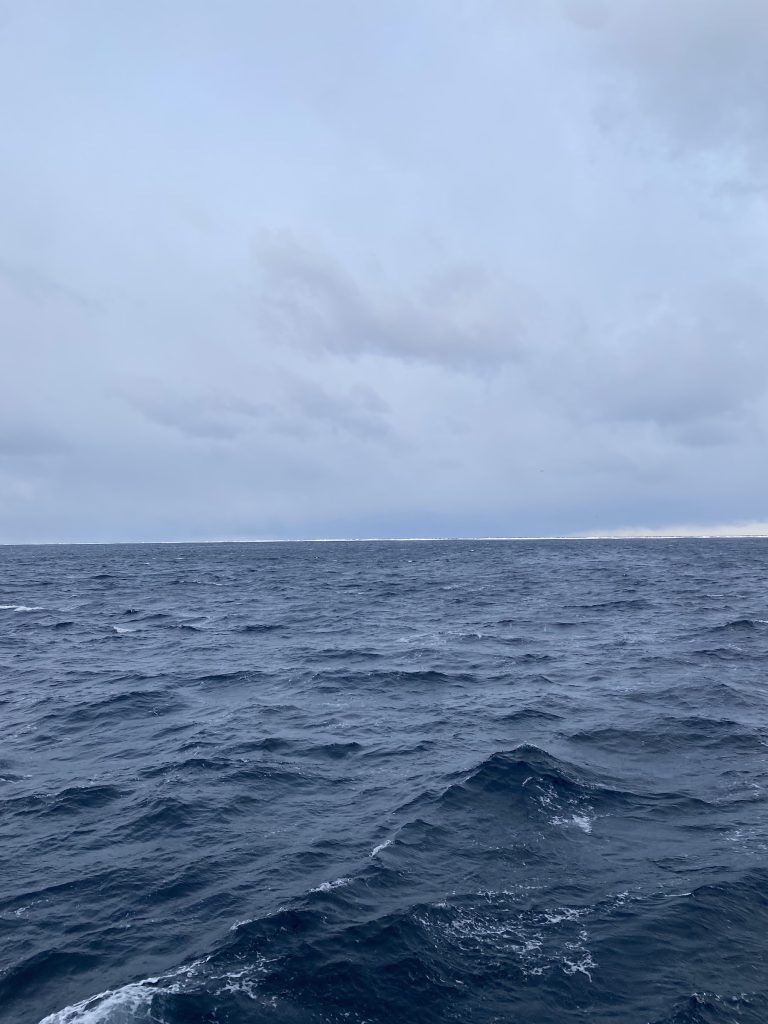
Being here, in the middle of the ocean, and looking in real-time at the data we are collecting. There is something quite special about the measurements coming in and knowing you are observing the ocean as it happens.
How are the decisions made between you and the captain, in terms of weather, research and safety? When do you meet? And how often?
From the beginning, we agreed to plan about 36 hours ahead, given the scope of the work and the often-challenging weather conditions. We then adjust the plan if needed.
We meet every morning, without a fixed time, to look at the weather forecast and decide together what can be done or not.
So far, this approach has worked very well. We have occasionally had to stop operations at short notice, but we have always managed to adapt without losing much valuable science time.
Is the cruise as you have planned it so far? If not, how does it differ?
The data we’ve collected so far has already exceeded my expectations, especially given the challenging weather conditions. We’ve been able to achieve a lot, and this is mainly thanks to the excellent collaboration between the ship’s crew and the scientific team on board.
Everyone has been very flexible and supportive, which has allowed us to adapt quickly and make the most of the time available.
Number 1 Tipp for working at 10bft and 6 meters waves?
Always keep one hand for the ship, and one for the science

Ocean Acidification
Dr Heidarzadeh’s TV interview with SkyNews on the massive M7.7 Panama earthquake on 9 October 2026
Dr Heidarzadeh’s TV interview with SkyNews on the massive M7.7 Panama earthquake on 9 October 2026. Click here for the full story.

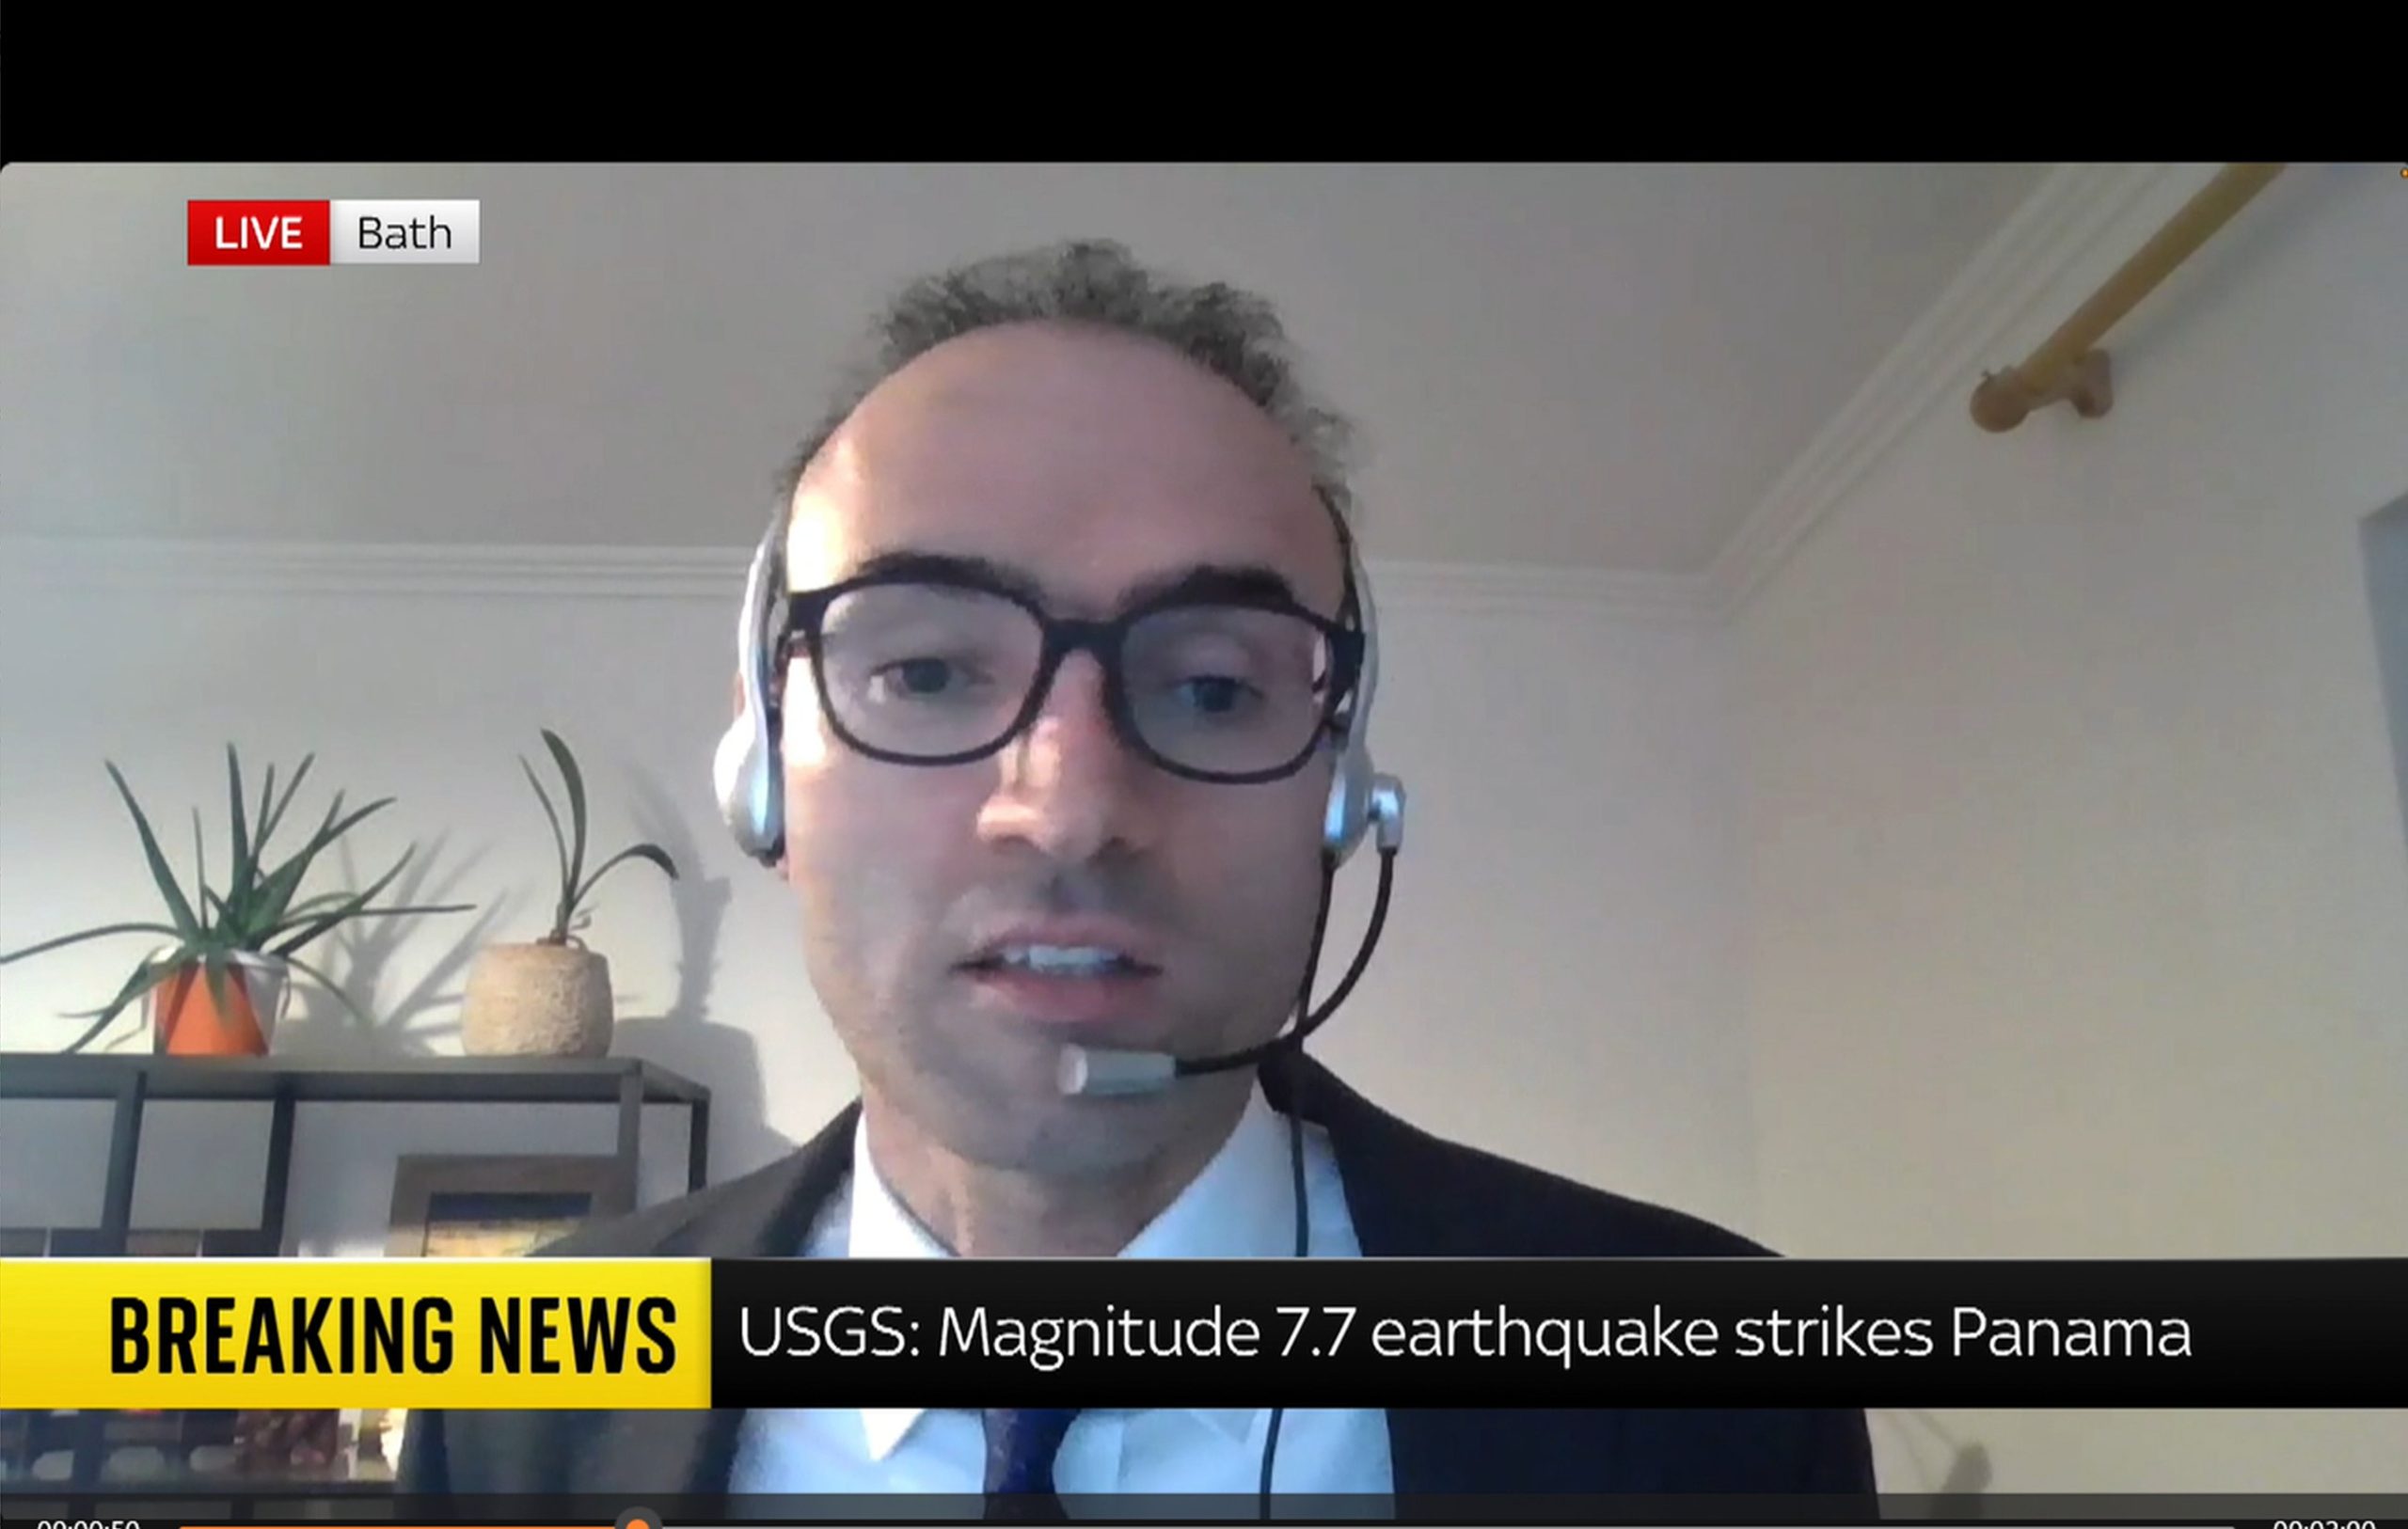
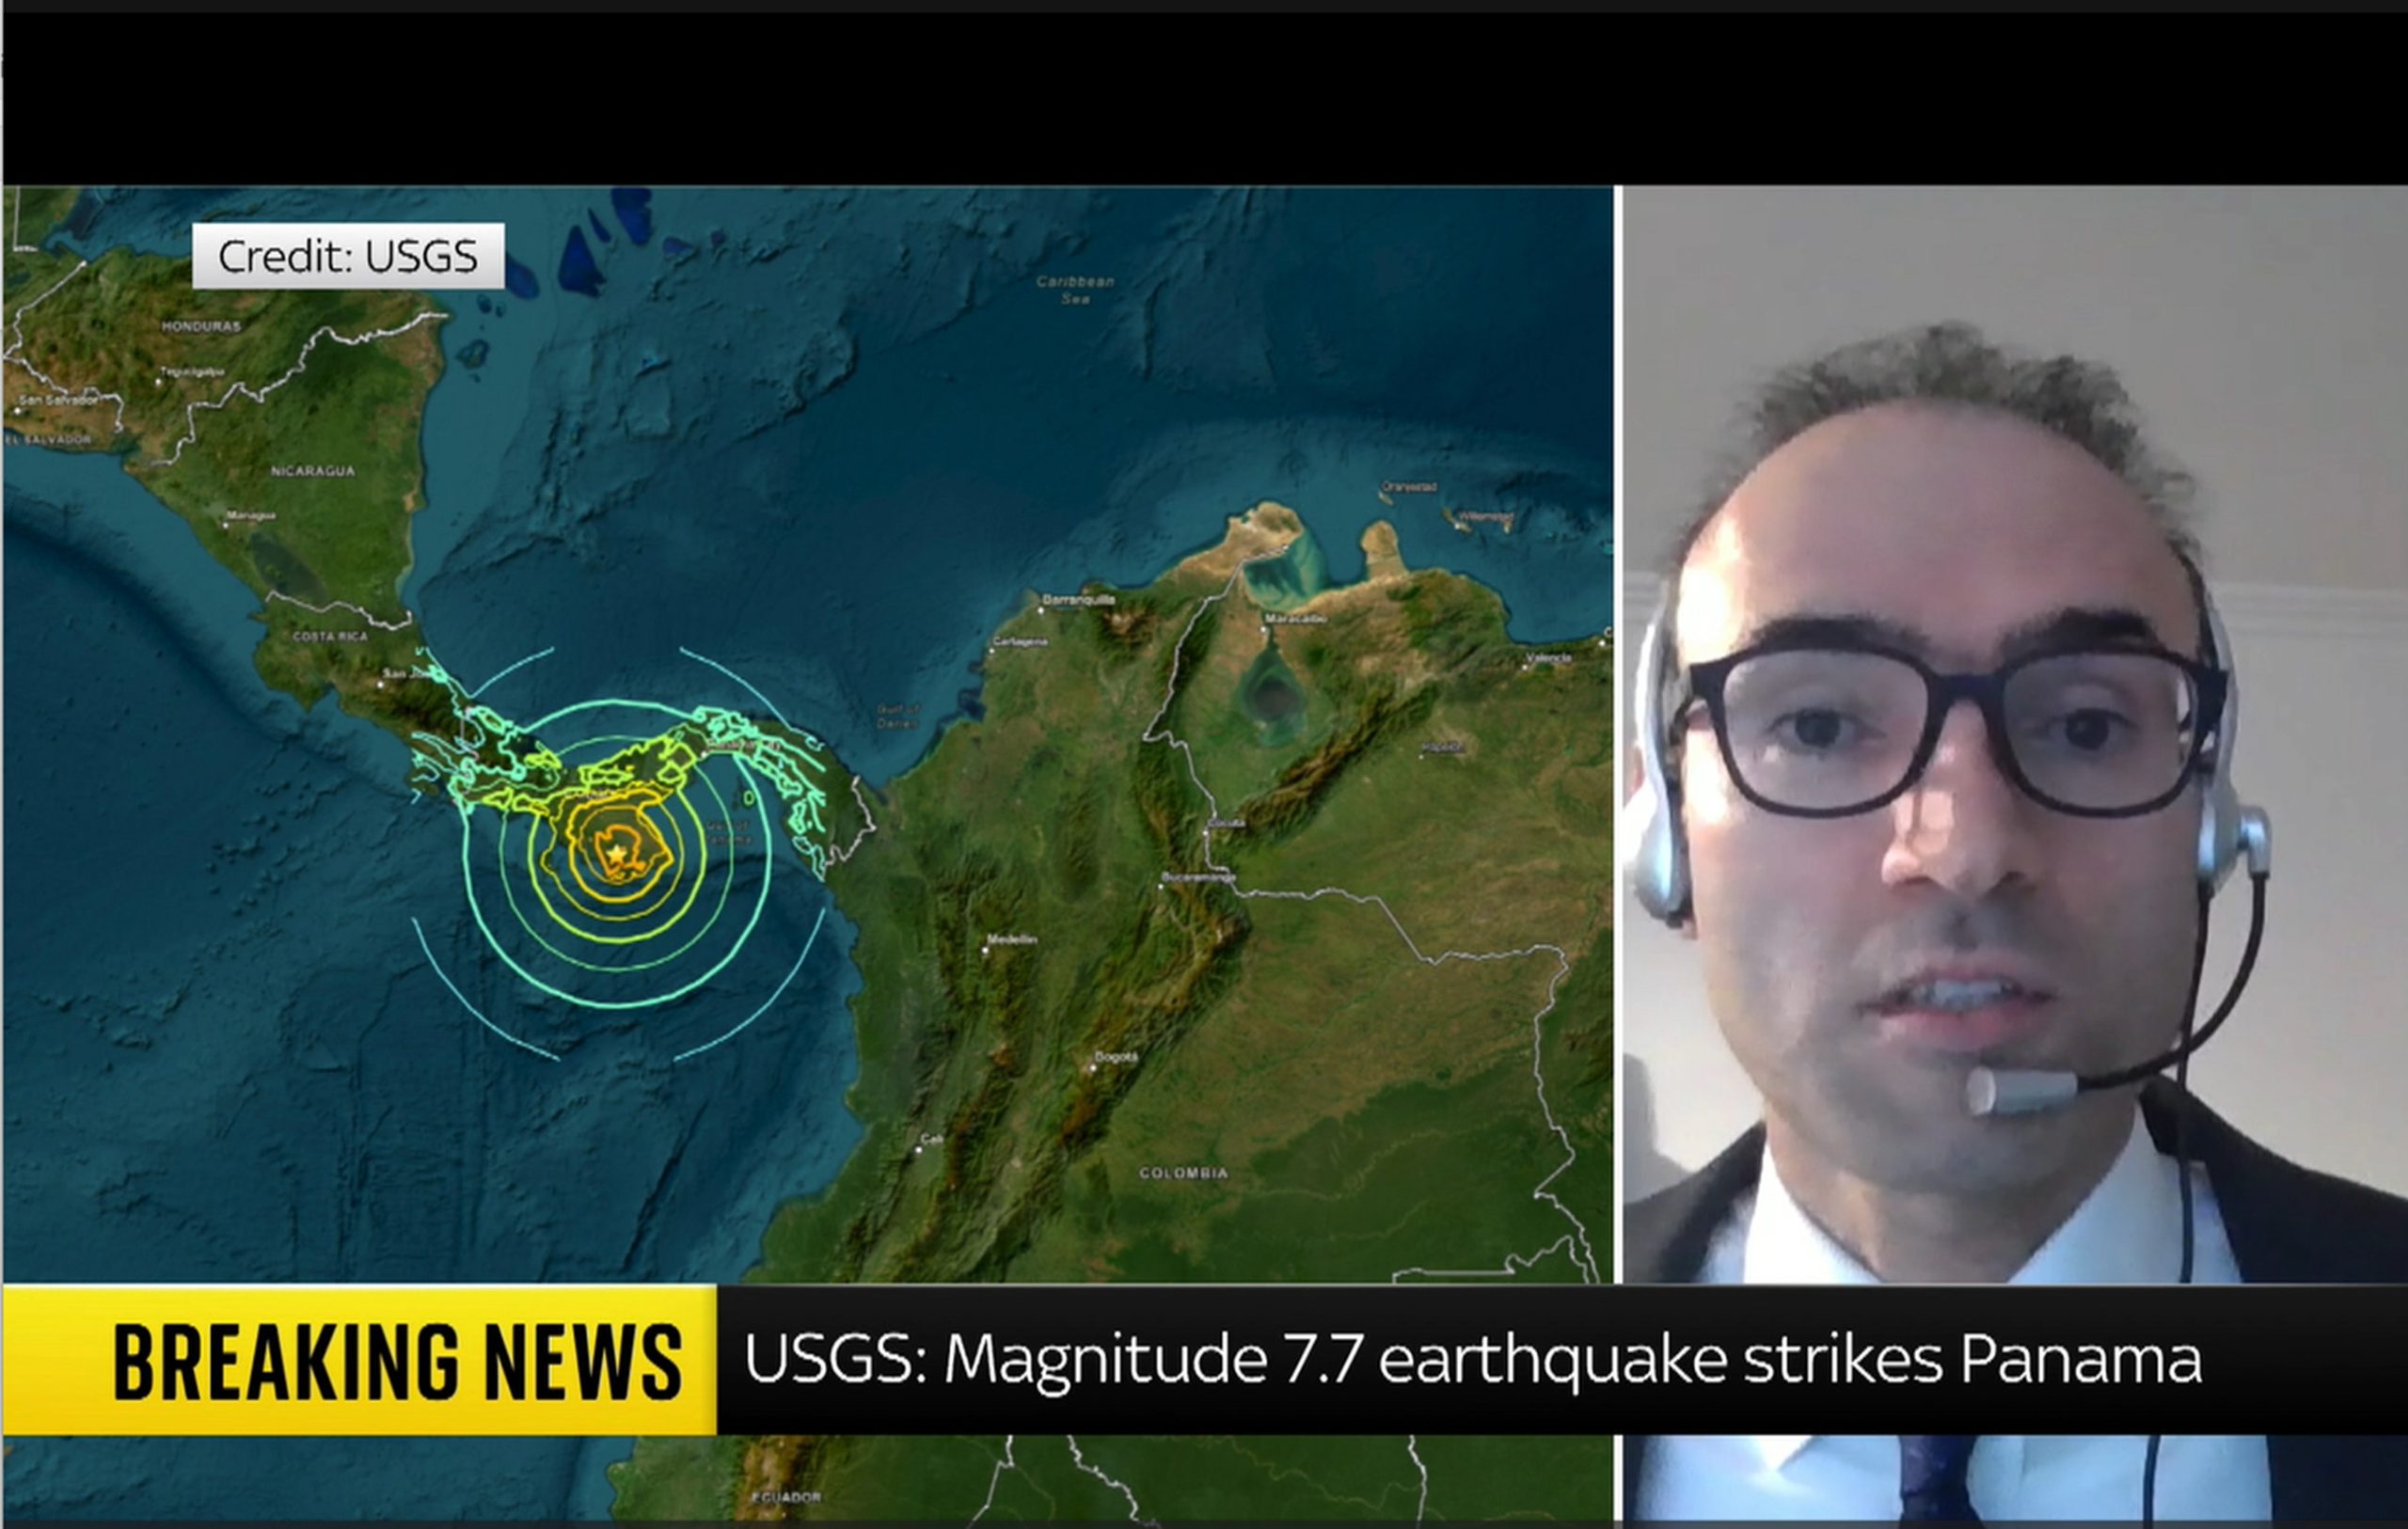
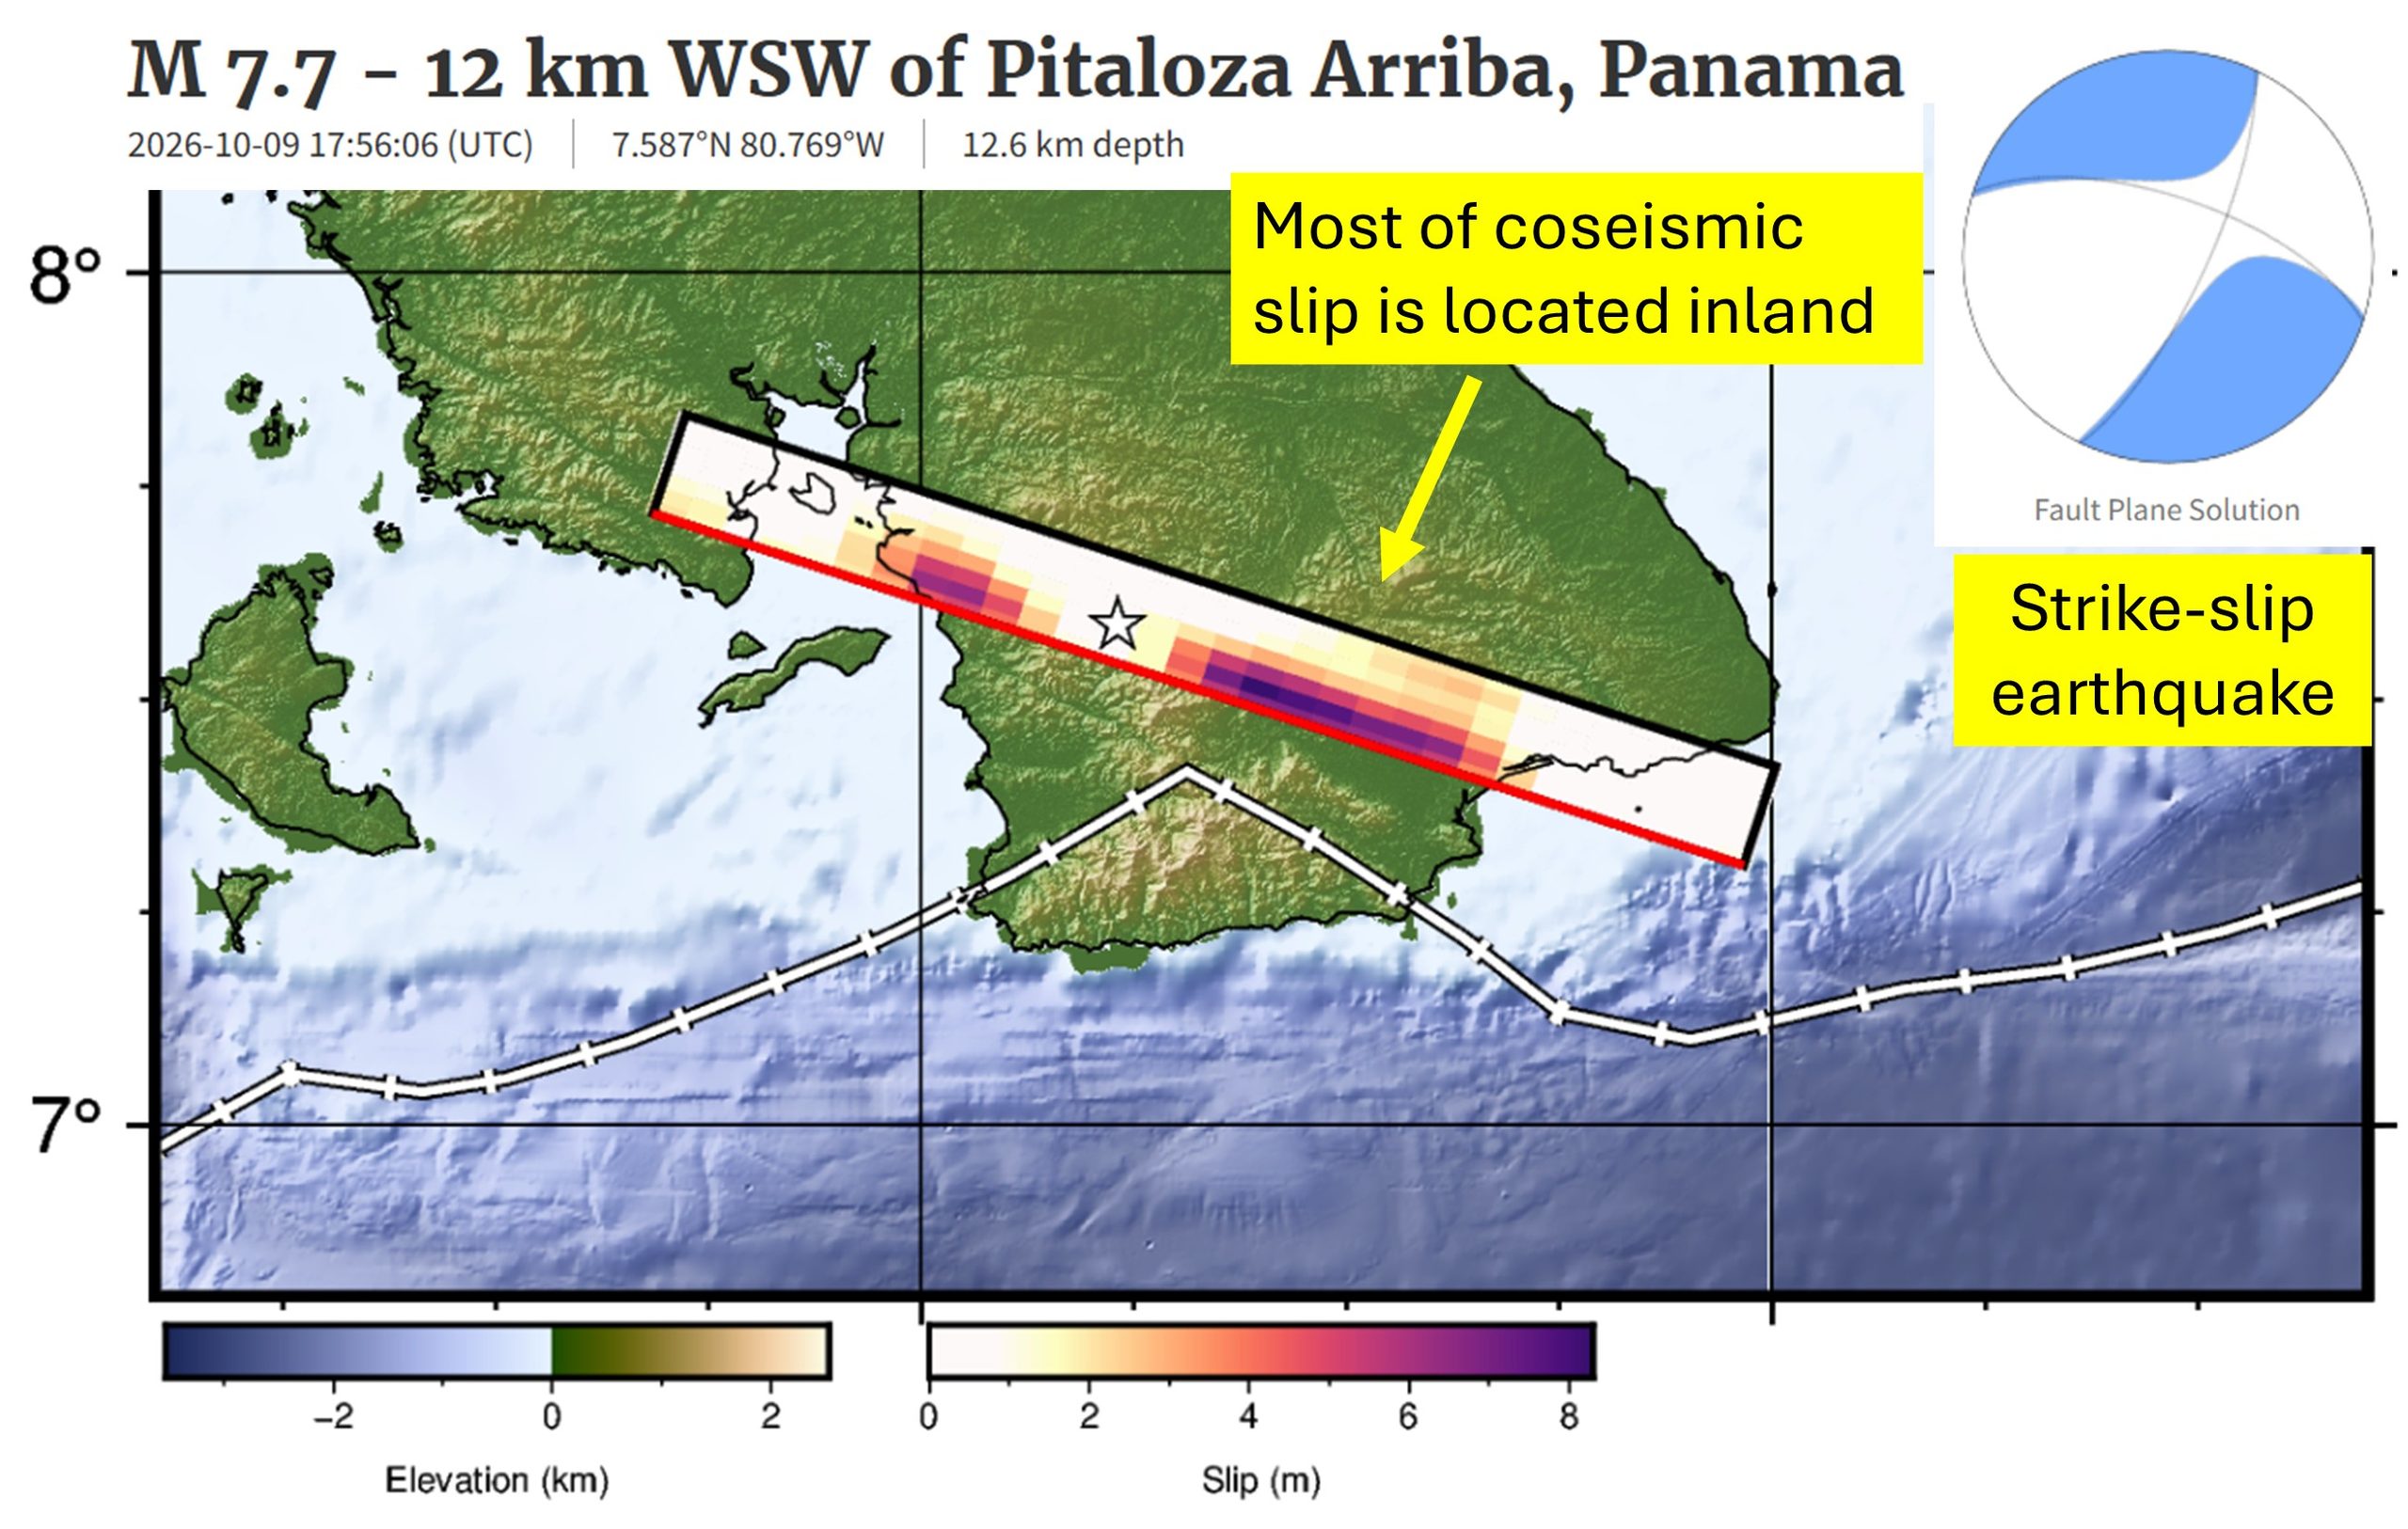
Dr Heidarzadeh’s TV interview with SkyNews on the massive M7.7 Panama earthquake on 9 October 2026
Our ocean is an incredibly vast and mysterious place. And there is no place where that is more evident than the deepest ocean area in the world: the legendary Mariana Trench. Located east of the Philippines, the Mariana Trench lies in the Mariana Archipelago in the western portion of the North Pacific. The greater area of the Mariana Trench Marine National Monument is made up of more than 95,000 square miles of ocean. Beneath these waters lie incredibly complex aggregations of submerged islands and volcanoes … and of course, an astoundingly massive trench.
Dive in with us to have your biggest questions answered about the famed Mariana Trench.
How deep is the Mariana Trench?
The deepest part of the Mariana Trench, known as Challenger Deep, is almost 36,000 feet below the ocean’s surface. For context, Mount Everest is about 29,000 feet above sea level, so the Mariana Trench is about 7,000 feet deeper than Mount Everest is tall. For one more comparison, the RMS Titanic lies at a depth of about 12,500 feet below sea level. The Challenger Deep is in waters nearly three times deeper than this ship’s final resting place.
Due to its enormous size, the Mariana Trench has at times been affectionately nicknamed the Grand Canyon of the ocean. This is certainly a picturesque image, but don’t let the mammoth size of this U.S. national terrestrial park fool you into thinking the Mariana Trench matches its size. The trench’s footprint is estimated to be 120 times larger than the Grand Canyon’s, and to reach the bottom of Challenger Deep, you’d need to descend through almost six Grand Canyons stacked on top of each other before you’d reach the seafloor.
Oh … and did we mention it’s five times wider than it is deep? It’s about 43 miles wide!
What is Challenger Deep, and how long would it take to reach it?
Challenger Deep is the deepest point of the Mariana Trench. Fewer than 30 people have ever journeyed to this area. The trek below the surface is long, dark and time-consuming, and it’s not an expedition considered lightly by scientists and explorers.
The first people to descend into the depths of this area in 1960 were oceanographers Jacques Piccard and Don Walsh, and it took them close to five hours to reach Challenger Deep. Since then, more advanced submersibles have been created, but it still takes two to four hours for modern vessels to reach such depths. For example, explorer and filmmaker James Cameron reached the seafloor in a little more than 2.5 hours in the first documented solo submarine dive to the area, and it took oceanographer Dr. Dawn Wright about four hours in 2022. It is crucial that these submersibles descend slowly and steadily beneath the surface, as the immense water pressure compounds with every mile a submersible descends. Speaking of pressure …
Get Ocean Updates in Your Inbox
Sign up with your email and never miss an update.
What is the water pressure at the bottom of the Mariana Trench?
If you thought the depth of the Mariana Trench was its only jaw-dropping feature, think again. Water pressure is one of the most important factors affecting deep-sea life. In the ocean, pressure increases by one atmosphere for every 33 feet (10 meters) of depth. One atmosphere (a unit of measurement for pressure equivalent to average air pressure at sea level) is equal to about 14.7 pounds per square inch (PSI), which is the approximate standard atmospheric pressure at sea level. If you were to convert atmospheric pressure into weight, one atmosphere is about the weight of a bowling ball. Stay with me, friends.
If a vessel were to dive 2,000 feet below the surface, the pressure would equal that of 60 bowling balls stacked atop every square inch of that submersible. But 60 bowling balls is simply nothing compared to the pressure in the Mariana Trench. The atmospheric pressure at the depths of Challenger Deep is equal to about 16,000 PSI. That pressure is about the same as the weight of an entire full-grown elephant on every square inch of a submersible!
Need a more extreme comparison? If a human were to be placed at the bottom of the Mariana Trench, the pressure would be equal to that of 50 jumbo jets piled on top of a person!
Do any animals live in the Mariana Trench?
The depths of the Mariana Trench come with immense pressure and extreme darkness, but somehow, life finds a way to survive. Organisms that live at an extreme depth, like that of Challenger Deep, have to be highly adapted to low temperatures (typically just above freezing), high pressure and virtually no light at all.
Species found in the depths of the Mariana Trench might look vastly different from animals from other ocean depths because their anatomy has been refined to thrive in harsh conditions. At such great depths, these animals typically depend on chemosynthesis (using nutrient-rich waters being pumped out of hydrothermal vents) or descending detritus (dead matter that has fallen from higher parts of the ocean) for food, such as whale falls. Just a handful of these animals include species of octopuses and squids, sea cucumbers, amphipods, sea jellies, shrimp, sea worms and some wild-looking fish!
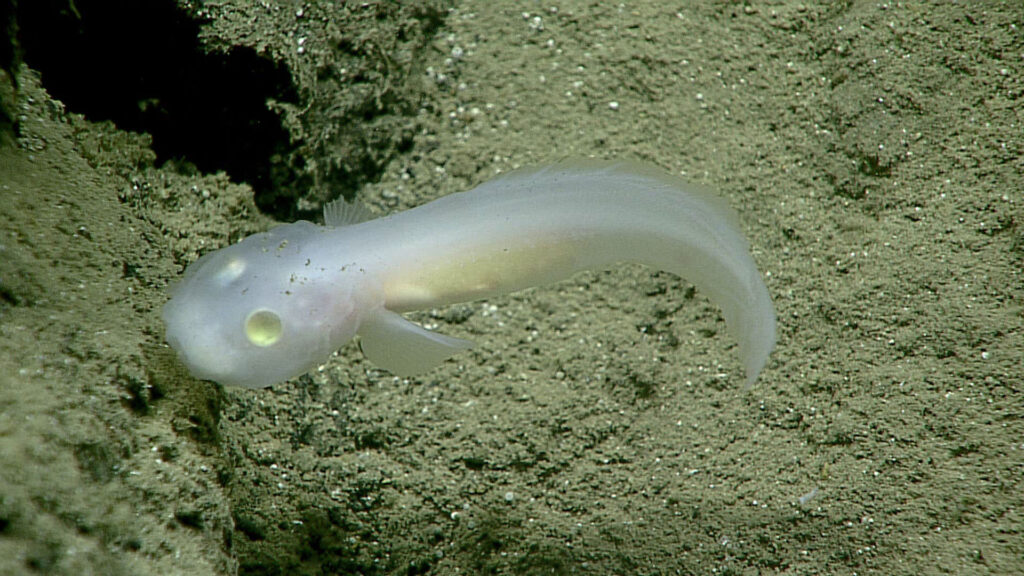
In 2025, more than 7,000 new species were discovered in the Mariana Trench, including the hadal snailfish (Pseudoliparis swirei). This is the deepest-dwelling fish currently known to science. Now, the fish has been dubbed “the Mariana snailfish.”
How was the Mariana Trench formed?
The process by which the Mariana Trench was created is a geologically fascinating one known as subduction. On the Earth’s surface, there are thin plates that cover the planet’s mantle, which is made of molten rock. If two of these plates collide, one pushes down into the Earth’s mantle while the other is pushed over the bottom plate. When this happens, a trench is formed from the drag of the bottom plate. This process can sometimes create incredibly strong earthquakes. The plates that forged the Mariana Trench’s creation are estimated to be up to approximately 180 million years old.
This trench was unknown to scientists until 1875. It was then that a team of explorers on the HMS Challenger measured the depth of the sea by simply lowering a weighted rope into the water. They were baffled when they measured that first portion of the seafloor to be five miles below the surface. And so was born the origin of some of the most daring deep-sea explorations known to mankind to date.
Is the Mariana Trench protected?
The Mariana Trench is in waters off Guam and the Mariana Islands. The region is protected from some human activities under its status as a marine monument. The creation of the Mariana Trench Marine National Monument signified that international, national and local leaders all recognize the importance of protecting this area.
However, just because the region is protected does not mean it’s not vulnerable to modern threats to ocean health. Plastic bags have been spotted in the Mariana Trench during several expeditions, highlighting the far-reaching impact of the marine debris problem. No corner of our ocean is safe from the ever-present threat of plastic pollution. The reality of a changing climate makes the future well-being of wondrous places like the Mariana Trench uncertain. What’s more: More than 70% of the global ocean has yet to be mapped. And what we don’t yet know about, we cannot wisely work to protect.
It’s up to us to work together to defend our ocean, from the sandy shores of our favorite beaches to the deepest, darkest parts of the sea. Together, we can work to protect our ocean as a whole, which ultimately helps protect treasured places like Challenger Deep.
Find out how you can join Ocean Conservancy’s wave of momentum to secure a healthy ocean and a thriving planet, forever and for everyone!
The post The Mysteries of the Mariana Trench appeared first on Ocean Conservancy.