Connect with us

Published

on

China’s leadership has published a draft of its 15th five-year plan setting the strategic direction for the nation out to 2030, including support for clean energy and energy security.

The plan sets a target to cut China’s “carbon intensity” by 17% over the five years from 2026-30, but also changes the basis for calculating this key climate metric.

The plan continues to signal support for China’s clean-energy buildout and, in general, contains no major departures from the country’s current approach to the energy transition.

The government reaffirms support for several clean-energy industries, ranging from solar and electric vehicles (EVs) through to hydrogen and “new-energy” storage.

The plan also emphasises China’s willingness to steer climate governance and be seen as a provider of “global public goods”, in the form of affordable clean-energy technologies.

However, while the document says it will “promote the peaking” of coal and oil use, it does not set out a timeline and continues to call for the “clean and efficient” use of coal.

This shows that tensions remain between China’s climate goals and its focus on energy security, leading some analysts to raise concerns about its carbon-cutting ambition.

Below, Carbon Brief outlines the key climate change and energy aspects of the plan, including targets for carbon intensity, non-fossil energy and forestry.

Note: this article is based on a draft published on 5 March and will be updated if any significant changes are made in the final version of the plan, due to be released at the close next week of the “two sessions” meeting taking place in Beijing.

What is China’s 15th five-year plan?

Five-year plans are one of the most important documents in China’s political system.

Addressing everything from economic strategy to climate policy, they outline the planned direction for China’s socio-economic development in a five-year period. The 15th five-year plan covers 2026-30.

These plans include several “main goals”. These are largely quantitative indicators that are seen as particularly important to achieve and which provide a foundation for subsequent policies during the five-year period.

The table below outlines some of the key “main goals” from the draft 15th five-year plan.

Category Indicator Indicator in 2025 Target by 2030 Cumulative target over 2026-2030 Characteristic
Economic development Gross domestic product (GDP) growth (%) 5 Maintained within a reasonable range and proposed annually as appropriate. Anticipatory
‘Green and low-carbon Reduction in CO2 emissions per unit of GDP (%) 17.7 17 Binding
Share of non-fossil energy in total energy consumption (%) 21.7 25 Binding
Security guarantee Comprehensive energy production
capacity (100m tonnes of
standard coal equivalent)
51.3 58 Binding

Select list of targets highlighted in the “main goals” section of the draft 15th five-year plan. Source: Draft 15th five-year plan.

Since the 12th five-year plan, covering 2011-2015, these “main goals” have included energy intensity and carbon intensity as two of five key indicators for “green ecology”.

The previous five-year plan, which ran from 2021-2025, introduced the idea of an absolute “cap” on carbon dioxide (CO2) emissions, although it did not provide an explicit figure in the document. This has been subsequently addressed by a policy on the “dual-control of carbon” issued in 2024.

The latest plan removes the energy-intensity goal and elevates the carbon-intensity goal, but does not set an absolute cap on emissions (see below).

It covers the years until 2030, before which China has pledged to peak its carbon emissions. (Analysis for Carbon Brief found that emissions have been “flat or falling” since March 2024.)

The plans are released at the two sessions, an annual gathering of the National People’s Congress (NPC) and the Chinese People’s Political Consultative Conference (CPPCC). This year, it runs from 4-12 March.

The plans are often relatively high-level, with subsequent topic-specific five-year plans providing more concrete policy guidance.

Policymakers at the National Energy Agency (NEA) have indicated that in the coming years they will release five sector-specific plans for 2026-2030, covering topics such as the “new energy system”, electricity and renewable energy.

There may also be specific five-year plans covering carbon emissions and environmental protection, as well as the coal and nuclear sectors, according to analysts.

Other documents published during the two sessions include an annual government work report, which outlines key targets and policies for the year ahead.

The gathering is attended by thousands of deputies – delegates from across central and local governments, as well as Chinese Communist party members, members of other political parties, academics, industry leaders and other prominent figures.

Back to top

What does the plan say about China’s climate action?

Achieving China’s climate targets will remain a key driver of the country’s policies in the next five years, according to the draft 15th five-year plan.

It lists the “acceleration” of China’s energy transition as a “major achievement” in the 14th five-year plan period (2021-2025), noting especially how clean-power capacity had overtaken fossil fuels.

The draft says China will “actively and steadily advance and achieve carbon peaking”, with policymakers continuing to strike a balance between building a “green economy” and ensuring stability.

Climate and environment continues to receive its own chapter in the plan. However, the framing and content of this chapter has shifted subtly compared with previous editions, as shown in the table below. For example, unlike previous plans, the first section of this chapter focuses on China’s goal to peak emissions.

11th five-year plan (2006-2010) 12th five-year plan (2011-2015) 13th five-year plan (2016-2020) 14th five-year plan (2021-2025) 15th five-year plan (2026-2030)
Chapter title Part 6: Build a resource-efficient and environmentally-friendly society Part 6: Green development, building a resource-efficient and environmentally friendly society Part 10: Ecosystems and the environment Part 11: Promote green development and facilitate the harmonious coexistence of people and nature Part 13: Accelerating the comprehensive green transformation of economic and social development to build a beautiful China
Sections Developing a circular economy Actively respond to global climate change Accelerate the development of functional zones Improve the quality and stability of ecosystems Actively and steadily advancing and achieving carbon peaking
Protecting and restoring natural ecosystems Strengthen resource conservation and management Promote economical and intensive resource use Continue to improve environmental quality Continuously improving environmental quality
Strengthening environmental protection Vigorously develop the circular economy Step up comprehensive environmental governance Accelerate the green transformation of the development model Enhancing the diversity, stability, and sustainability of ecosystems
Enhancing resource management Strengthen environmental protection efforts Intensify ecological conservation and restoration Accelerating the formation of green production and lifestyles
Rational utilisation of marine and climate resources Promoting ecological conservation and restoration Respond to global climate change
Strengthen the development of water conservancy and disaster prevention and mitigation systems Improve mechanisms for ensuring ecological security
Develop green and environmentally-friendly industries

Title and main sections of the climate and environment-focused chapters in the last five five-year plans. Source: China’s 11th, 12th, 13th, 14th and 15th five-year plans.

The climate and environment chapter in the latest plan calls for China to “balance [economic] development and emission reduction” and “ensure the timely achievement of carbon peak targets”.

Under the plan, China will “continue to pursue” its established direction and objectives on climate, Prof Li Zheng, dean of the Tsinghua University Institute of Climate Change and Sustainable Development (ICCSD), tells Carbon Brief.

Back to top

What is China’s new CO2 intensity target?

In the lead-up to the release of the plan, analysts were keenly watching for signals around China’s adoption of a system for the “dual-control of carbon”.

This would combine the existing targets for carbon intensity – the CO2 emissions per unit of GDP – with a new cap on China’s total carbon emissions. This would mark a dramatic step for the country, which has never before set itself a binding cap on total emissions.

Policymakers had said last year that this framework would come into effect during the 15th five-year plan period, replacing the previous system for the “dual-control of energy”.

However, the draft 15th five-year plan does not offer further details on when or how both parts of the dual-control of carbon system will be implemented. Instead, it continues to focus on carbon intensity targets alone.

Looking back at the previous five-year plan period, the latest document says China had achieved a carbon-intensity reduction of 17.7%, just shy of its 18% goal.

This is in contrast with calculations by Lauri Myllyvirta, lead analyst at the Centre for Research on Energy and Clean Air (CREA), which had suggested that China had only cut its carbon intensity by 12% over the past five years.

At the time it was set in 2021, the 18% target had been seen as achievable, with analysts telling Carbon Brief that they expected China to realise reductions of 20% or more.

However, the government had fallen behind on meeting the target.

Last year, ecology and environment minister Huang Runqiu attributed this to the Covid-19 pandemic, extreme weather and trade tensions. He said that China, nevertheless, remained “broadly” on track to meet its 2030 international climate pledge of reducing carbon intensity by more than 65% from 2005 levels.

Myllyvirta tells Carbon Brief that the newly reported figure showing a carbon-intensity reduction of 17.7% is likely due to an “opportunistic” methodological revision. The new methodology now includes industrial process emissions – such as cement and chemicals – as well as the energy sector.

(This is not the first time China has redefined a target, with regulators changing the methodology for energy intensity in 2023.)

For the next five years, the plan sets a target to reduce carbon intensity by 17%, slightly below the previous goal.

However, the change in methodology means that this leaves space for China’s overall emissions to rise by “3-6% over the next five years”, says Myllyvirta. In contrast, he adds that the original methodology would have required a 2% fall in absolute carbon emissions by 2030.

The dashed lines in the chart below show China’s targets for reducing carbon intensity during the 12th, 13th, 14th and 15th five-year periods, while the bars show what was achieved under the old (dark blue) and new (light blue) methodology.
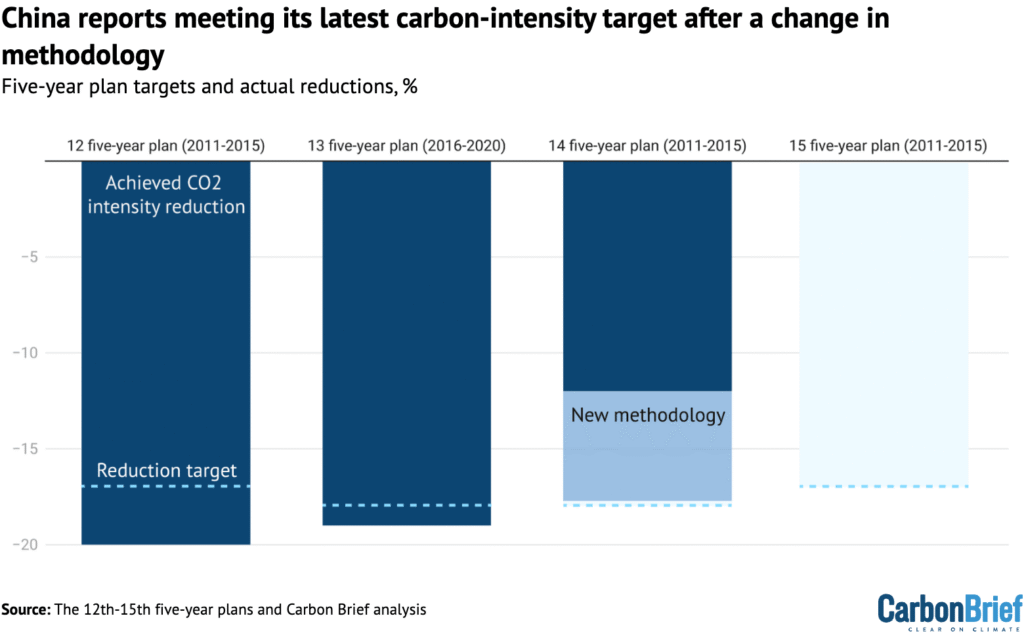
China reports meeting its latest carbon-intensity target after a change in methodology.
Dashed lines: China’s carbon-intensity targets during the 12th, 13th, 14th and 15th five-year plan periods. Bars: China’s achieved carbon-intensity reductions according to either the old methodology (dark blue) and the new one (light blue). The achieved reductions during the 12th and 13th five-year plans are from contemporaneous government statistics and may be revised in future. The reduction figures for the 14th five-year plan period are sourced from government statistics for the new methodology and analysis by CREA under the old methodology. Sources: Five-year plans and Carbon Brief.

The carbon-intensity target is the “clearest signal of Beijing’s climate ambition”, says Li Shuo, director at the Asia Society Policy Institute’s (ASPI) China climate hub.

It also links directly to China’s international pledge – made in 2021 – to cut its carbon intensity to more than 65% below 2005 levels by 2030.

To meet this pledge under the original carbon-intensity methodology, China would have needed to set a target of a 23% reduction within the 15th five-year plan period. However, the country’s more recent 2035 international climate pledge, released last year, did not include a carbon-intensity target.

As such, ASPI’s Li interprets the carbon-intensity target in the draft 15th five-year plan as a “quiet recalibration” that signals “how difficult the original 2030 goal has become”.

Furthermore, the 15th five-year plan does not set an absolute emissions cap.

This leaves “significant ambiguity” over China’s climate plans, says campaign group 350 in a press statement reacting to the draft plan. It explains:

“The plan was widely expected to mark a clearer transition from carbon-intensity targets toward absolute emissions reductions…[but instead] leaves significant ambiguity about how China will translate record renewable deployment into sustained emissions cuts.”

Myllyvirta tells Carbon Brief that this represents a “continuation” of the government’s focus on scaling up clean-energy supply while avoiding setting “strong measurable emission targets”.

He says that he would still expect to see absolute caps being set for power and industrial sectors covered by China’s emissions trading scheme (ETS). In addition, he thinks that an overall absolute emissions cap may still be published later in the five-year period.

Despite the fact that it has yet to be fully implemented, the switch from dual-control of energy to dual-control of carbon represents a “major policy evolution”, Ma Jun, director of the Institute of Public and Environmental Affairs (IPE), tells Carbon Brief. He says that it will allow China to “provide more flexibility for renewable energy expansion while tightening the net on fossil-fuel reliance”.

Back to top

Does the plan encourage further clean-energy additions?

“How quickly carbon intensity is reduced largely depends on how much renewable energy can be supplied,” says Yao Zhe, global policy advisor at Greenpeace East Asia, in a statement.

The five-year plan continues to call for China’s development of a “new energy system that is clean, low-carbon, safe and efficient” by 2030, with continued additions of “wind, solar, hydro and nuclear power”.

In line with China’s international pledge, it sets a target for raising the share of non-fossil energy in total energy consumption to 25% by 2030, up from just under 21.7% in 2025.

The development of “green factories” and “zero-carbon [industrial] parks” has been central to many local governments’ strategies for meeting the non-fossil energy target, according to industry news outlet BJX News. A call to build more of these zero-carbon industrial parks is listed in the five-year plan.

Prof Pan Jiahua, dean of Beijing University of Technology’s Institute of Ecological Civilization, tells Carbon Brief that expanding demand for clean energy through mechanisms such as “green factories” represents an increasingly “bottom-up” and “market-oriented” approach to the energy transition, which will leave “no place for fossil fuels”.

He adds that he is “very much sure that China’s zero-carbon process is being accelerated and fossil fuels are being driven out of the market”, pointing to the rapid adoption of EVs.

The plan says that China will aim to double “non-fossil energy” in 10 years – although it does not clarify whether this means their installed capacity or electricity generation, or what the exact starting year would be.

Research has shown that doubling wind and solar capacity in China between 2025-2035 would be “consistent” with aims to limit global warming to 2C.

While the language “certainly” pushes for greater additions of renewable energy, Yao tells Carbon Brief, it is too “opaque” to be a “direct indication” of the government’s plans for renewable additions.

She adds that “grid stability and healthy, orderly competition” is a higher priority for policymakers than guaranteeing a certain level of capacity additions.

China continues to place emphasis on the need for large-scale clean-energy “bases” and cross-regional power transmission.

The plan says China must develop “clean-energy bases…in the three northern regions” and “integrated hydro-wind-solar complexes” in south-west China.

It specifically encourages construction of “large-scale wind and solar” power bases in desert regions “primarily” for cross-regional power transmission, as well as “major hydropower” projects, including the Yarlung Tsangpo dam in Tibet.

As such, the country should construct “power-transmission corridors” with the capacity to send 420 gigawatts (GW) of electricity from clean-energy bases in western provinces to energy-hungry eastern provinces by 2030, the plan says.

State Grid, China’s largest grid operator, plans to install “another 15 ultra-high voltage [UHV] transmission ​lines” by 2030, reports Reuters, up from the 45 UHV lines built by last year.

Below are two maps illustrating the interlinkages between clean-energy bases in China in the 15th (top) and 14th (bottom) five-year plan periods.

The yellow dotted areas represent clean energy bases, while the arrows represent cross-regional power transmission. The blue wind-turbine icons represent offshore windfarms and the red cooling tower icons represent coastal nuclear plants.
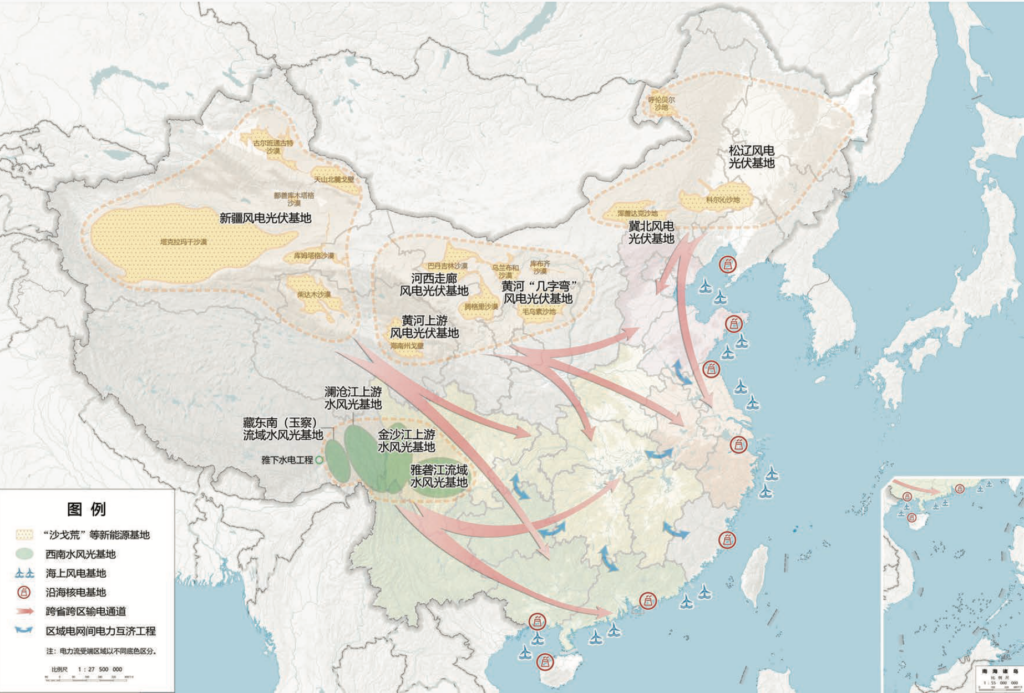
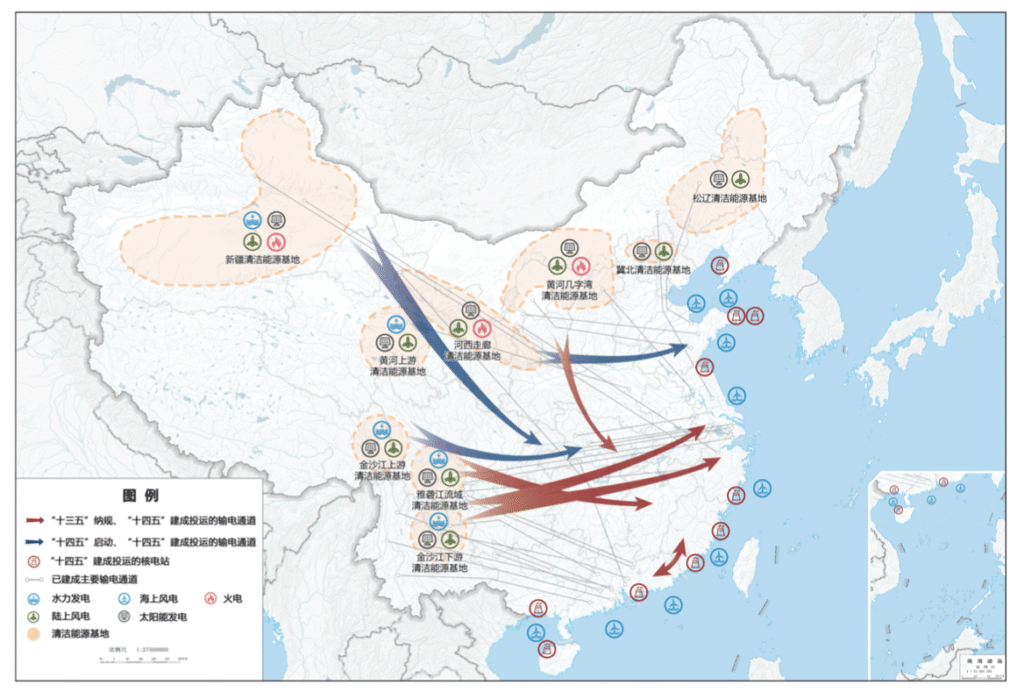
Maps showing layout of key energy projects in China during 2026-2030 (top) and 2021-2025 (bottom). Source: Chinese government’s 15th five-year plan and 14th five-year plan.

The 15th five-year plan map shows a consistent approach to the 2021-2025 period. As well as power being transmitted from west to east, China plans for more power to be sent to southern provinces from clean-energy bases in the north-west, while clean-energy bases in the north-east supply China’s eastern coast.

It also maps out “mutual assistance” schemes for power grids in neighbouring provinces.

Offshore wind power should reach 100GW by 2030, while nuclear power should rise to 110GW, according to the plan.

Back to top

What does the plan signal about coal?

The increased emphasis on grid infrastructure in the draft 15th five-year plan reflects growing concerns from energy planning officials around ensuring China’s energy supply.

Ren Yuzhi, director of the NEA’s development and planning department, wrote ahead of the plan’s release that the “continuous expansion” of China’s energy system has “dramatically increased its complexity”.

He said the NEA felt there was an “urgent need” to enhance the “secure and reliable” replacement of fossil-fuel power with new energy sources, as well as to ensure the system’s “ability to absorb them”.

Meanwhile, broader concerns around energy security have heightened calls for coal capacity to remain in the system as a “ballast stone”.

The plan continues to support the “clean and efficient utilisation of fossil fuels” and does not mention either a cap or peaking timeline for coal consumption.

Xi had previously told fellow world leaders that China would “strictly control” coal-fired power and phase down coal consumption in the 15th five-year plan period.

The “geopolitical situation is increasing energy security concerns” at all levels of government, said the Institute for Global Decarbonization Progress in a note responding to the draft plan, adding that this was creating “uncertainty over coal reduction”.

Ahead of its publication, there were questions around whether the plan would set a peaking deadline for oil and coal. An article posted by state news agency Xinhua last month, examining recommendations for the plan from top policymakers, stated that coal consumption would plateau from “around 2027”, while oil would peak “around 2026”.

However, the plan does not lay out exact years by which the two fossil fuels should peak, only saying that China will “promote the peaking of coal and oil consumption”.

There are similarly no mentions of phasing out coal in general, in line with existing policy.

Nevertheless, there is a heavy emphasis on retrofitting coal-fired power plants. The plan calls for the establishment of “demonstration projects” for coal-plant retrofitting, such as through co-firing with biomass or “green ammonia”.

Such retrofitting could incentivise lower utilisation of coal plants – and thus lower emissions – if they are used to flexibly meet peaks in demand and to cover gaps in clean-energy output, instead of providing a steady and significant share of generation.

The plan also calls for officials to “fully implement low-carbon retrofitting projects for coal-chemical industries”, which have been a notable source of emissions growth in the past year.

However, the coal-chemicals sector will likely remain a key source of demand for China’s coal mining industry, with coal-to-oil and coal-to-gas bases listed as a “key area” for enhancing the country’s “security capabilities”.

Meanwhile, coal-fired boilers and industrial kilns in the paper industry, food processing and textiles should be replaced with “clean” alternatives to the equivalent of 30m tonnes of coal consumption per year, it says.

“China continues to scale up clean energy at an extraordinary pace, but the plan still avoids committing to strong measurable constraints on emissions or fossil fuel use”, says Joseph Dellatte, head of energy and climate studies at the Institut Montaigne. He adds:

“The logic remains supply-driven: deploy massive amounts of clean energy and assume emissions will eventually decline.”

Back to top

How will China approach global climate governance in the next five years?

Meanwhile, clean-energy technologies continue to play a role in upgrading China’s economy, with several “new energy” sectors listed as key to its industrial policy.

Named sectors include smart EVs, “new solar cells”, new-energy storage, hydrogen and nuclear fusion energy.

“China’s clean-technology development – rather than traditional administrative climate controls – is increasingly becoming the primary driver of emissions reduction,” says ASPI’s Li. He adds that strengthening China’s clean-energy sectors means “more closely aligning Beijing’s economic ambitions with its climate objectives”.

Analysis for Carbon Brief shows that clean energy drove more than a third of China’s GDP growth in 2025, representing around 11% of China’s whole economy.

The continued support for these sectors in the draft five-year plan comes as the EU outlined its own measures intended to limit China’s hold on clean-energy industries, driven by accusations of “unfair competition” from Chinese firms.

China is unlikely to crack down on clean-tech production capacity, Dr Rebecca Nadin, director of the Centre for Geopolitics of Change at ODI Global, tells Carbon Brief. She says:

“Beijing is treating overcapacity in solar and smart EVs as a strategic choice, not a policy error…and is prepared to pour investment into these sectors to cement global market share, jobs and technological leverage.”

Dellatte echoes these comments, noting that it is “striking” that the plan “barely addresses the issue of industrial overcapacity in clean technologies”, with the focus firmly on “scaling production and deployment”.

At the same time, China is actively positioning itself to be a prominent voice in climate diplomacy and a champion of proactive climate action.

This is clear from the first line in a section on providing “global public goods”. It says:

“As a responsible major country, China will play a more active role in addressing global challenges such as climate change.”

The plan notes that China will “actively participate in and steer [引领] global climate governance”, in line with the principle of “common,but differentiated responsibilities”.

This echoes similar language from last year’s government work report, Yao tells Carbon Brief, demonstrating a “clear willingness” to guide global negotiations. But she notes that this “remains an aspiration that’s yet to be made concrete”. She adds:

“China has always favored collective leadership, so its vision of leadership is never a lone one.”

The country will “deepen south-south cooperation on climate change”, the plan says. In an earlier section on “opening up”, it also notes that China will explore “new avenues for collaboration in green development” with global partners as part of its “Belt and Road Initiative”.

China is “doubling down” on a narrative that it is a “responsible major power” and “champion of south-south climate cooperation”, Nadin says, such as by “presenting its clean‑tech exports and finance as global public goods”. She says:

“China will arrive at future COPs casting itself as the indispensable climate leader for the global south…even though its new five‑year plan still puts growth, energy security and coal ahead of faster emissions cuts at home.”

Back to top

What else does the plan cover?

The impact of extreme weather – particularly floods – remains a key concern in the plan.

China must “refine” its climate adaptation framework and “enhance its resilience to climate change, particularly extreme-weather events”, it says.

China also aims to “strengthen construction of a national water network” over the next five years in order to help prevent floods and droughts.

An article published a few days before the plan in the state-run newspaper China Daily noted that, “as global warming intensifies, extreme weather events – including torrential rains, severe convective storms, and typhoons – have become more frequent, widespread and severe”.

The plan also touches on critical minerals used for low-carbon technologies. These will likely remain a geopolitical flashpoint, with China saying it will focus during the next five years on “intensifying” exploration and “establishing” a reserve for critical minerals. This reserve will focus on “scarce” energy minerals and critical minerals, as well as other “advantageous mineral resources”.

Dellatte says that this could mean the “competition in the energy transition will increasingly be about control over mineral supply chains”.

Other low-carbon policies listed in the five-year plan include expanding coverage of China’s mandatory carbon market and further developing its voluntary carbon market.

China will “strengthen monitoring and control” of non-CO2 greenhouse gases, the plan says, as well as implementing projects “targeting methane, nitrous oxide and hydrofluorocarbons” in sectors such as coal mining, agriculture and chemicals.

This will create “capacity” for reducing emissions by 30m tonnes of CO2 equivalent, it adds.

Meanwhile, China will develop rules for carbon footprint accounting and push for internationally recognised accounting standards.

It will enhance reform of power markets over the next five years and improve the trading mechanism for green electricity certificates.

It will also “promote” adoption of low-carbon lifestyles and decarbonisation of transport, as well as working to advance electrification of freight and shipping.

Back to top

The post Q&A: What does China’s 15th ‘five-year plan’ mean for climate change? appeared first on Carbon Brief.

Q&A: What does China’s 15th ‘five-year plan’ mean for climate change?

Continue Reading

Climate Change

Most “zombie credits” locked out of new UN carbon market after China and India snub

Published

on

China and India have declined to back any of their old United Nations carbon credit projects seeking to sell offsets under the new UN market, driving a cull of nearly three-quarters of applicants, analysis of official data shows.

Only 415 out of more than 1,500 projects and programmes hoping to move from the Clean Development Mechanism (CDM) to the new carbon market set up under Article 6.4 of the Paris Agreement won the approval of their host governments by the 30 June deadline – a crucial step in transitioning them.

The two Asian giants, home to two-thirds of all applicants, account for the bulk of the exclusions. Brazil, the other heavyweight of the CDM era, took the opposite path, approving nearly all of its projects in a last-minute rush that leaves it with the largest number of activities still in the running to sell credits under the new mechanism.

Carbon market watchers have long regarded the CDM, set up under the Kyoto Protocol which has now been largely replaced by the Paris Agreement, as largely discredited for failing to drive real emission cuts. They also warned that letting its projects live on could dent confidence in the mechanism’s successor.

    If all projects seeking transition had been successful, they could have flooded the market with up to more than 900 million credits generated with largely outdated rules, according to UN estimates. One credit is equivalent to one tonne of carbon dioxide (CO2) and 900 million tonnes is similar to Japan’s annual emissions.

    ‘New era’

    Injy Johnstone, senior research fellow at the Munich-based Max Planck Institute, said the failure of most projects to clear the hurdle sent a significant signal that carbon trading had entered a new era. “The system is trying to remove some of the hot air that had inflated it in the past,” she told Climate Home News.

    “The lack of transition is the biggest contribution that Article 6 has made to climate yet,” she added, arguing that leaving “zombie credits” in the market creates confusion, especially for buyers that might not realise these units have lost their value.

    Among the schemes that failed to win government approval are nine programmes promoted by fossil fuel companies over a decade ago to subsidise the construction of gas plants in the Global South, which Climate Home News has previously reported on.

    Fossil fuel firms seek UN carbon market cash for old gas plants

    But one of them, supporting the Ressano Garcia gas plant in Mozambique, could still profit from the new market after the country’s government granted its approval on deadline day itself.

    Brazil leads projects transition

    Established in 1997 under the Kyoto Protocol, the CDM allowed rich countries to meet part of their climate obligations by financing emission-cutting projects in poorer ones. It drew widespread criticism over its patchy human rights record and for failing to deliver promised climate benefits. Backers of the Article 6.4 market say it is a higher-integrity successor.

    CDM projects were given a route back into the new mechanism under certain conditions at COP26 in Glasgow in November 2021, when governments agreed the rules for the Paris Agreement market.

    Project developers had until the end of 2023 to apply and host governments were originally given until the end of 2025 to grant approval. But, after requests from many developing countries for an extension, at COP30 in Belém countries agreed to push the deadline back six months to the end of June.

    Brazil was the single largest beneficiary of the decision, with all of its 92 approvals coming during the extension window. Hydropower plants, landfill gas schemes and wind farms make up the bulk of the South American country’s surviving portfolio, and hydro is the single most common project type in the global transition pipeline.

    Peru greenlit the move of nearly a dozen hydropower plants, Thailand backed a batch of biogas and waste-to-energy schemes, and Mexico squeezed all of its approvals – including a controversial industrial gas project – into the final week. African nations including Zambia, Malawi and Ethiopia backed programmes aiming to switch households to cleaner cooking stoves, which have the potential to generate millions of offsets and are set to be the biggest source of credits among the surviving projects.

    Long way from selling credits

    Securing government support does not mean a scheme can now automatically sell credits under the Article 6 mechanism. Developers are required to submit additional documentation by the end of 2026 demonstrating that their programmes respect the mechanism’s stricter rules on environmental and social safeguards and on the risk of emission cuts being reversed. The Article 6.4 Supervisory Body, the mechanism’s regulator, has the final say on which projects are allowed into the market.

    Those that make it through can sell credits for emission reductions achieved between 2021 and 2025 under the old CDM methodologies, with some adjustments aimed at preventing the creation of excess credits not backed by real emission cuts. For reductions achieved from 2026 onwards, projects will need to switch to new methodologies, which the regulator is currently developing.

    So far, 30 programmes have completed the process, and only two cookstove projects in Myanmar have been formally approved to issue credits.

    Civil society groups have called for an investigation into the activities in Myanmar over its ties to Myanmar’s military junta – which the UN says is guilty of human rights abuses – and allegations of “massively” overstating its climate impact.

    The company behind the scheme said its engagement with authorities “should not be interpreted as political endorsement” of the junta, while disputing the calculations underpinning the claim that too many credits had been issued.

    The post Most “zombie credits” locked out of new UN carbon market after China and India snub appeared first on Climate Home News.

    Most “zombie credits” locked out of new UN carbon market after China and India snub

    Continue Reading

    Climate Change

    Debriefed 17 July 2026: UK ‘firewave’ | Fossil-fuelled heat deaths | London’s Natural History Museum spotlights climate

    Published

    on

    Welcome to Carbon Brief’s DeBriefed.
    An essential guide to the week’s key developments relating to climate change.

    This week

    Heat and firewaves

    ‘FIREWAVE’: Wildfires ravaged Europe and North America this week. France utilised water-dumping planes collecting from the Seine to contain a fire in the Fontainebleau forest near Paris, according to the Associated Press. The Financial Times reported that the UK has had “25 non-consecutive days with temperatures of 30C or more, including nine days above 34C”, creating a “firewave” and putting pressure on emergency services. Meanwhile, an “orange haze from Canada wildfires” could be “seen in Ontario and northern US”, said BBC News.

    ‘NEW NORMAL’: Climate events previously seen as extreme are becoming the “new ‘normal’”, said the Met Office, in a report on the UK’s climate. While last year was the UK’s hottest on record, rising temperatures mean it is expected to be surpassed in the next few years, reported Reuters. Liz Bentley, head of the Royal Meteorological Society, told the Guardian that “climate change has been described by scientists for many years but is now increasingly being felt by the UK population in their own homes and communities”.

    Around the world

    • ELECTRIFYING PUSH: The European Commission has announced a target for electricity to account for 46% of energy consumption across the bloc by 2040, reported Carbon Pulse. The commission has also made plans to adapt its emissions trading system to “bring relief to industry”, it said.
    • FALLING OIL: The International Energy Agency said that global oil demand is expected to decline this year for the first time since 2020, reported the Associated Press.
    • US ROLLBACKS: Trump cuts to clean energy support “led to the cancellation ​or delay of $83bn in investment across hundreds of projects”, reported Reuters. The Trump administration has also changed environmental law to allow development in the habitats of endangered species, according to CNN
    • BURNHAM BEGINS: Incoming UK prime minister Andy Burnham is preparing to announce new North Sea drilling “within days of taking office”, said Bloomberg. Carbon Brief looked at 28 statements that Burnham has made about climate change and fossil fuels.
    • DRY JULY: Drought in Uganda led to significant crop losses and at least 16 deaths from starvation, said BBC News
    • ON AI: Australia planned to implement restrictions on energy and water usage for datacentres “amid [an] AI boom”, said the New York Times

    38%

    The drop in Brazilian Amazon deforestation in the first half of 2026, compared to last year, reported Al Jazeera.


    Latest climate research

    • The area of land burned by wildfires in Africa each year has reduced due to a shrinking dry season | Geophysical Research Letters
    • Most people do not distinguish between climate adaptation and mitigation when thinking about tackling climate change | Climate Outreach
    • An “effort-sharing framework” has been developed to support progress towards the Paris Agreement | npj Climate Action

    (For more, see Carbon Brief’s in-depth daily summaries of the top climate news stories on Monday, Tuesday, Wednesday, Thursday and Friday.)

    Captured

    Chart showing that climate change drove 42% of death in England and Wales during the May and June heatwaves

    Carbon Brief explained how more than 1,000 heat-related deaths in England and Wales during May and June were attributed to climate change, accounting for almost half of all heat-related deaths experienced during those months. The article also unpacked the different methods for estimating heat deaths around the world.

    Spotlight

    Natural History Museum exhibits climate change

    This week, Carbon Brief interviews Meaghan Macdonald, senior project and programme manager for London’s Natural History Museum, about their first permanent climate-themed exhibition, Fixing Our Broken Planet.

    Carbon Brief: Why are programmes such as Fixing Our Broken Planet so important?

    Meaghan Macdonald: One of the main things we’re trying to achieve with Fixing Our Broken Planet is to place the museum as a convener of conversations around the planetary emergency…trying to bring together the different groups of people who need to be involved in this conversation in order to work together to find a solution.

    And we find that a lot of the people who come into the gallery weren’t necessarily coming here to see it; they come across it, which is a really great way to engage people who may not have been engaged in that discussion previously.

    CB: How does the exhibition engage and inspire visitors?

    MM: A driving force for this exhibition is that you are dealing with a subject matter that can be quite disheartening, and one of the things that we were very careful about is to try to make sure that woven throughout the scientific data… is a sense of hope… to enable people to feel empowered to make a difference.

    We were able to do things like our “what you can do” labels, which give an example that people can take away with them. We also have “conversation starters”, which is a digital screen that asks people a series of questions related to the planetary emergency. Things like: “Should we mine the deep sea to power the green economy?”…And there’s no right or wrong answer.

    We [also] set out very specifically to…forefront the science that’s happening here. We know from multiple studies from thinktanks and organisations that people actually trust our scientists the most.

    Natural History Museum’s Fixing Our Broken Planet exhibition.
    Natural History Museum’s Fixing Our Broken Planet exhibition. Credit: Micheal Melia / Alamy Stock Photo

    CB: The museum has set out a goal to “create advocates for the planet”. What does this mean? How does it relate to the exhibition and the museum’s wider climate action?

    MM: The aim of the museum is to get to a place where both people and the planet thrive. Being a library of the natural world, it is our duty to be standing up for it and to help people find their way, fighting for nature’s side.

    In order to create those advocates, the aim of the [exhibition] and the wider advocacy programmes at the museum is to try to find ways to bring all these people [individuals, policymakers, industry, scientists] together.

    We have the wider programme with Fixing Our Broken Planet. We have Generation Hope…a free graphic panel version of our display in the gallery that we have been able to get into a number of venues in Bangalore…the very long-standing and beloved wildlife photographer of the year [exhibition]…our urban nature movement…[and] an initiative that we are doing with the Department for Education called the National Education Nature Park.

    Watch, read, listen

    STUBBORN HOPE: For the Conversation, climate scientist Prof Peter Stott argued that researchers need to “talk more about the very worst-case scenarios” and the possibility for action.

    EXTREME: Vox’s the Gray Area podcast spoke to New York Times journalist David Wallace-Wells about the possibility of a “Godzilla” El Niño.

    RESPONSIBILITY: For Climate Home News, two researchers from the Center for International Environmental Law explored how “major emitting countries knew of climate risks decades earlier than claimed”.

    Coming up

    Pick of the jobs

    DeBriefed is edited by Daisy Dunne. Please send any tips or feedback to debriefed@carbonbrief.org.

    This is an online version of Carbon Brief’s weekly DeBriefed email newsletter. Subscribe for free here.

    The post Debriefed 17 July 2026: UK ‘firewave’ | Fossil-fuelled heat deaths | London’s Natural History Museum spotlights climate appeared first on Carbon Brief.

    Debriefed 17 July 2026: UK ‘firewave’ | Fossil-fuelled heat deaths | London’s Natural History Museum spotlights climate

    Continue Reading

    Climate Change

    Q&A: Europe’s May and June heatwave deaths – and how they were counted

    Published

    on

    Recent weeks have seen a flurry of reports from public health authorities and scientists that estimate the deaths caused by Europe’s record-breaking summer heatwaves.

    In France, the national public health agency reported 2,025 excess deaths over the week where the heatwave peaked in June.

    Authorities in Germany and Netherlands put the excess death toll during the same seven-day period at 5,753 and 533, respectively.

    An analysis from climate scientists in Carbon Brief found that France saw more than 2,700 heat-related deaths over 17 days in June.

    Separate research estimated there had been 2,700 heat-related deaths in the UK’s May and June heatwaves – 42% of which had been caused by human-caused climate change.

    There are a number of methods for how academics and governments tally deaths caused by extreme heat, each with their own advantages and drawbacks.

    Here, Carbon Brief looks at the different ways scientists and public health authorities have calculated the death toll of Europe’s record-breaking summer heat.

    How established is the science of calculating heat deaths?

    Economists and epidemiologists have been studying the relationship between heat and mortality for nearly a century.

    A pioneering study published in 1923 by geographer Ellsworth Huntington and economist Margaret Justin that looked at mortality data for New York City over 1882-88 found that deaths increased rapidly as temperatures rose above 17C.

    As global temperatures have risen in response to human-caused carbon emissions, scientists have increasingly sought to understand how warming could impact mortality.

    The study of mortality caused by specific heatwave events dates back a few decades, with a 1995 heatwave in Chicago among the earliest events to be studied in detail.

    Image showing an academic article titled "Heat-Related Death during the July 1995 Heat Wave in Chicago"

    Over the past decade, a growing number of studies have gone a step further, by estimating the number of deaths caused by a specific heatwave event and then attributing a percentage or number of those deaths to human-caused climate change.

    Carbon Brief covered the first study of this type, which was published in Environmental Research Letters in 2016 and focused on a 2003 summer heatwave that caused tens of thousands of deaths across Europe.

    The study estimated that 506 of the 735 summer fatalities in Paris and 64 of the 315 in London were a result of human influence on the climate.

    More recently, a study in Climatic Change found that 27% of deaths in a 2018 heatwave in Zurich, Switzerland were linked to human-caused climate change and a paper in Science Advances estimated that 11-15% of deaths in a 2021 heatwave in British Columbia were attributable to global warming.

    Dr Christopher Callahan, assistant professor at the O’Neill School of Public and Environmental Affairs at Indiana University, tells Carbon Brief this type of “two-step” study has “really exploded” in recent years:

    “It is really only in the last five to 10 years that we have seen this, partly because it does require interdisciplinary expertise. You need people who know how to run the epidemiological models and you need a climate analysis of the counterfactual [world] without climate change, which is its own effort.”

    What are the different approaches to counting heat deaths?

    A central challenge in estimating deaths from a heatwave is that heat is rarely recorded as the primary cause of death on death certificates.

    However, exposure to high temperatures has wide-ranging effects on the human body, including the strain of keeping cool. This effort places pressure on the heart and kidneys.

    As a result, heat extremes can worsen health risks from chronic conditions and cause acute kidney injury. Researchers have linked heat to increased mortality from respiratory and cardiovascular diseases, as well as dementia and Alzheimer’s.

    As a result, public health authorities and scientists cannot depend on death certificates for a full count of heat-related deaths. They instead estimate heat deaths using a number of different approaches, each with assumptions baked into their calculations.

    Dr Garyfallos Konstantinoudis, who researches methods for calculating excess mortality due to extreme events at the Grantham Institute for Climate Change and the Environment at Imperial College, tells Carbon Brief there is “no ground truth” when it comes to tallying heat-related deaths:

    “We don’t know what the heat-related deaths are, so we rely on different models to describe the picture.”

    This makes the study of deaths from heatwaves similar to those from air pollution, he says:

    “This sort of health-impact assessment has been done for years on studies related to deaths from air pollution, which have the same problem. Air pollution, until very recently, was not recorded on death certificates.

    “[However], for air pollution, the [scientific] literature is much larger, so no one questions that air pollution is toxic and kills. This sort of messaging for heat is more recent.”

    There are, broadly speaking, two approaches to calculating deaths during a heatwave.

    The first involves counting the number of excess deaths relative to a period in the past.

    This method – often referred to as an “excess deaths” approach – looks at how many people died during a particular time period compared to a baseline period where there was no heatwave.

    To do this, public health authorities and researchers rely on official death figures reported by country authorities.

    The heat death tolls published in recent weeks by public health agencies in Belgium, France, Germany and the Netherlands relied on this approach.

    (For more, see: What are the pros and cons of the ‘excess deaths’ method?)

    The second method uses long-term mortality data to understand the statistical relationship between temperature and mortality in a given place. The model that emerges can be used to infer the number of deaths from a heatwave in that place.

    In a rapid analysis published this week, researchers at Imperial College London, the London School of Hygiene and Tropical Medicine (LSHTM) and the Met Office used this approach to estimate that the May and June heatwaves in the UK caused the deaths of 2,700 people.

    Dr Callahan – working with Prof Andrew Dessler, director of the Texas Center for Extreme Weather at Texas A&M University – used this method to estimate that more than 2,700 people had died in France over a 17-day period in June in an analysis for Carbon Brief.

    (For more: see: What are the pros and cons of the ‘statistical modelling’ method?)

    The majority of the figures released in the wake of Europe’s June heatwave have relied on these two methods.

    There is a third way to calculate heat deaths, which is to look at official counts of deaths attributed on death certificates to heatstroke.

    Callahan tells Carbon Brief that the “death-certificate coding” appears to have fallen out of favour in Europe – which he says is a “smart move” given that it does not provide a “full accounting”.

    Nevertheless, some public health authorities are still using this method. For example, in the wake of the heatwave in the US earlier this month, public health data showed 29 people in New Jersey and three people in New York had died from “heat-related illnesses”.

    Scientists tell Carbon Brief the excess deaths and statistical modelling approaches both have advantages and drawbacks. These are explored below.

    What do the latest figures show for Europe’s May and June heatwaves?

    The table below shows the death numbers that have been reported by governments and researchers for Europe’s May and June heatwaves, including the approach used to reach the figures.

    It suggests that multiple countries in Europe experienced more than 1,000 heat-related deaths during the late June heatwave, with authorities in Germany counting more than 5,000.

    Meanwhile, the EuroMoMo mortality monitoring system estimated there were more than 10,500 excess deaths across 27 countries during the June heatwave.

    Reported Source Country / region Dates Days Deaths Link Approach
    28/06/2026 Public Health France ​ France 22-27 June 6 1,000 santepubliquefrance.fr Excess deaths
    29/06/2026 World Health Organization Europe 21-28 June 8 1,300 x.com/DrTedros/status Excess deaths
    01/07/2026 Carlos III Health Institute (MoMo) Spain 1-30 June 30 1,033 dw.com Excess deaths (all-cause and temperature-attributable)
    02/07/2026 National Institute for Public Health and the Environment Netherlands 22-28 June 7 480 rivm.nl Excess deaths
    03/07/2026 Public Health France ​ France 22-28 June 7 2,025 santepubliquefrance.fr Excess deaths
    07/07/2026 Chris Callahan/Andrew Dessler France 12-29 June 18 2,766 carbonbrief.org Statistical modelling
    08/07/2026 Chris Callahan Europe 15-28 June 14 13,975 zenodo.org Statistical modelling
    08/07/2026 Sciensano Belgium 18 June – 1 July 14 1,747 brusselstimes.com

    Excess deaths
    09/07/2026 Robert Koch Institute Germany 22-28 June 7 5,120 rki.de Statistical modelling
    13/07/2026 Met Office/LSHTM/Imperial England and Wales 22-27 June 6 2,183 drive.google.com Statistical modelling
    13/07/2026 Met Office/LSHTM/Imperial England and Wales 24-26 May 3 553 drive.google.com

    Statistical modelling
    13/07/2026 EURO Mo/Mo 27 European countries 22-28 June 7 10,650 reuters.com Excess deaths
    07/07/2025 National Institute for Public Health and the Environment Netherlands 22-28 June 7 577 archive.ph

    Excess deaths
    14/07/2026 Germany Federal Statistical Office (Destatis) Germany 22-28 June 7 5,753 destatis.de Excess deaths

    In most instances, Carbon Brief has linked to the figures published by public health authorities, where numbers were first reported. In some instances, figures were released on dashboards or webpages that are updated weekly. In these cases, Carbon Brief has linked to media reports or archived web content.

    What are the pros and cons of the ‘excess deaths’ method?

    The excess deaths approach looks at how many more people died during a particular time period compared to a baseline period of the same length.

    For instance, on 14 July, Germany’s federal statistics agency, Destatis, published figures showing Germany saw 32% more deaths than the average in the week of 22-28 June, which was dominated by the heatwave.

    Specifically, the agency said that 23,932 deaths had been recorded that week, compared to an average of 18,179 in that calendar week across the years 2022-25.

    This suggests there were 5,753 excess deaths during the heatwave week. (This was a slight increase from preliminary Destatis figures released a week earlier, covered by Bloomberg.)

    The Netherlands similarly calculates excess deaths by comparing death figures against an average of deaths in a similar period during unspecified “previous years”.

    Data published by the country’s National Institute for Public Health and the Environment (RIVM) shows that, during the week of 22-28 June, an estimated 3,626 people died in total in the northern European country.

    This is 577 more deaths than the 3,049 expected at that time of year, it said. (This is a slight revision upwards from the 480 excess deaths reported on 4 July by NL Times based on preliminary figures from NVIM.)

    Callahan says that the excess deaths approach has the benefit of being rapid and relatively uncomplicated:

    “It is something that public health authorities can put out fairly quickly without having to run a fancy model and do coding like the academic scientists do. It is a short-term, high-impact, rapid estimate of mortality.”

    The drawback to the approach is that it is impossible to decipher what percentage of these “all-mortality” excess deaths are, in fact, heat-related.

    Imperial College’s Konstantinoudis notes that the public often “feels more comfortable” with the excess deaths approach over the statistical modelling approach because the data it is using – the official death numbers – is based on real-world data.

    However, he stresses that excess deaths figures are based on a series of assumptions, including the reference period picked by researchers and how the numbers are interpreted.

    Statisticians and researchers have to make a series of decisions, including what period to use as a comparative baseline. For example, the baseline period could be the week before a heatwave, the same week a year before – or an average of the same week across multiple years in the past. If averaging mortality of a similar period across a number of previous years, they must decide how much “weight”, or influence, each year should have.

    They must also decide how to account for spikes in deaths during the Covid-19 pandemic years, as well as the gradual rise in average temperatures due to global warming.

    During the pandemic, many governments and the World Health Organization (WHO) used the excess deaths approach to count deaths. The WHO said this metric was more “comparable” and “objective” than relying on national reports of Covid-19 deaths, given that different countries used different criteria for this classification.

    A notable example of how assumptions can skew excess death figures came during this period, when the WHO estimated in 2022 that Germany had seen 195,000 excess deaths over two years of pandemic.

    However, after statisticians and epidemiologists pointed out the assumptions in the model were not suited to Germany’s demographics, the WHO retracted the figure and eventually reduced it to 122,000 and then later to 102,000.

    Konstantinoudis explains:

    “Covid taught us that it is complicated. Depending on the different assumptions used in the excess-mortality approach, you get different results…There is a scientific basis, but we should acknowledge the assumptions.”

    What are the pros and cons of the ‘statistical modelling’ method?

    In the statistical modelling approach, researchers use models to determine the specific relationship between mortality and temperature for a particular location and then apply it to temperatures observed during a heatwave.

    This allows them to estimate the overall number of deaths that were caused by a heatwave.

    Previous research has revealed that, in most places of the world, there is a U-shaped response of mortality to temperature – where deaths increase rapidly in cold or hot conditions as daily maximum temperatures depart further from an “optimum temperature”.

    For example, research published in Proceedings of the National Academy of Sciences in 2025 found that mortality rates in France rise as daily maximum temperatures move away from approximately 20C. This is shown in the chart below.

    Chart showing extreme heat and mortality in France
    Relationship between daily high temperature and all-cause mortality rates in France, estimated using data over 2004-19. Credit: Dr Christopher Callahan, based on data and methods in Callahan et al. (2025)

    Indiana University’s Callahan say this approach allows scientists to “formally establish a relationship between the temperature and the mortality”, adding:

    “If you do these calculations right, you can credibly say your entire estimate of mortality is heat-related.”

    Prof Antonio Gasparrini, biostatistician and epidemiologist at LSHTM, explains the method relies on “timeseries models that apply relatively sophisticated statistical methods in which you ‘smooth’ trends occurring in time, so you control for long-term trends and seasonality”.

    He says that these models also allow researchers to “remove” trends affecting mortality that are unrelated to heat – for instance, the impacts of the pandemic. They can also “add” other information, such as around how air pollution combines with heat to threaten vulnerable populations.

    Gasparrini adds:

    “What statistical modelling can bring is that it is more refined. It can link specific temperatures to specific impacts rather than just looking at the event [in the whole]. And also, it can be localised – [data] can be stratified at a fine scale and we can look at impacts at different scales.

    “So, it is more informative. But, at the same time, of course, it’s based on more assumptions than the [excess deaths approach] and, of course, needs to be checked and compared.”

    The approach depends on a number of judgment calls from scientists and statisticians, including the years picked to underpin the model and how to capture the lag in deaths in the days and weeks after a heatwave event.

    They must also decide at what threshold to start counting deaths – in other words, whether to count all deaths above the “optimum temperature” or set a higher, more extreme value – and whether and how to account for any adaptation to heat extremes that may have been put in place in the study area.

    A benefit of the statistical modelling approach is that it opens the door for being able to attribute a specific number of deaths to human-caused climate change.

    By applying the temperature-mortality curve to both the temperatures of the recent heatwave and a counterfactual world without climate change, scientists can estimate what proportion of estimated deaths only occurred because the world is warming.

    For instance, Imperial College, LSHTM and Met Office researchers found that 59% and 38% of heat-related deaths in the UK’s May and June heatwaves, respectively, could be attributed to climate change. Their findings are shown in the chart below.

    Chart showing that climate change drove 42% of death in England and Wales during the May and June heatwaves
    Number of heat deaths in England and Wales over 21-29 May and 18-28 June attributable to climate change. Source: Barnes et al (2026).

    Some climate-sceptic commentators have argued that modelled estimates are hypotheses and should therefore be treated with caution.

    On 13 July, climate-sceptic news website GB News covered a blog post by Oxford academics that argued the figure that 2,700 people had died in the UK’s May and June heatwaves was not reflected in the provisional “all-mortality” data put out by the UK’s Office for National Statistics (ONS). Quoting the blog, GB News said:

    “Modelling tells us nothing. Models explore possibilities; surveillance tells us what happened. When the two disagree, our instinct should be to investigate the data rather than simply trust the model.”

    However, Imperial’s Konstantinoudis – who worked on the models behind the 2,700 figure – says it is important to await the UK Health and Security Agency (UKHSA)’s annual heat mortality report before arriving at any conclusions. He explains:

    “While we are entirely clear that our current findings are modelled estimates, this methodology has consistently delivered comparable results to the UKHSA’s own official analyses of observed deaths for past heat events.”

    (The UKHSA report will include updated figures and estimate excess deaths from heat based on specific periods of heat in different regions, whereas the provisional ONS figures cover all national deaths during a full-week period.)

    Konstantinoudis says both the excess deaths and statistical modelling approaches have been the subject of extensive peer-reviewed scientific study and can provide a “holistic view of what is happening” when used together.

    Studies that have compared statistical modelling approaches for estimating heatwave deaths with excess death figures in the UK have found they yield broadly similar results.

    The post Q&A: Europe’s May and June heatwave deaths – and how they were counted appeared first on Carbon Brief.

    Q&A: Europe’s May and June heatwave deaths – and how they were counted

    Continue Reading

    Trending

    Copyright © 2022 BreakingClimateChange.com