Climate Change
Pace of global warming has nearly doubled since 2015, reveals study
An acceleration in human-caused global warming could see the Paris Agreement’s 1.5C limit breached before 2030, a new study suggests.
The paper, published in Geophysical Research Letters, finds that, over the past decade, the planet has been warming at its fastest rate on record.
The authors isolate the trend of human-driven warming in the long-term global temperature record, removing the influence of natural factors, such as El Niño, volcanic eruptions and solar variation.
They find that the world had been warming at a rate of around 0.2C per decade since the 1970s, but has “accelerated” since 2015 to a rate of 0.35C per decade.
The study warns that if the current rate of warming persists, the 1.5C Paris threshold will be breached in the next few years.
“The essential result of this paper isn’t how fast we’re warming, but that warming is now happening faster than before and that the difference isn’t negligible,” an author on the study tells Carbon Brief.
Warming signal
The year 2024 was the hottest on record, with global average temperatures at the surface exceeding 1.5C above pre-industrial levels for the first time.
Crossing the 1.5C threshold in a single year is not equivalent to a breach of the Paris Agreement, which refers to long-term warming – typically interpreted as over a 20-year period.
However, rapidly rising global temperatures are prompting scientists to ask when this internationally recognised threshold might be broken.
Human activity has been the primary driver of rising global temperature in the long term, through greenhouse gas emissions and land-use change. However, natural factors also have warming and cooling effects from year to year.
The study authors identified three main sources of this natural variability.
El Niño and La Niña – collectively referred to as the El Niño-Southern Oscillation (ENSO) – are generally the largest drivers of year-to-year fluctuations in global temperatures. The study authors identify volcanic activity and changes in solar variation as the other two main natural influences on global temperature trends.
Study author Dr Grant Foster, formerly from the consulting firm Tempo Analytics and now retired, describes these sources of natural variability as “random noise” that sits on top of the long-term warming signal. He explains that “the larger the noise, the harder it is to see the real trend”.
To isolate the warming trend, the authors used a statistical technique that they first employed in a 2011 paper to remove the contributions of ENSO, volcanic activity and solar variation from the global temperature record.
The authors carried out this analysis on five separate datasets of global average surface temperature – NASA, NOAA, the Met Office Hadley Centre and University of East Anglia’s HadCRUT5, Berkeley Earth and Copernicus ERA5.
The plots below show the global temperature between 1880 and 2024, relative to pre-industrial temperatures, from the five datasets.
Each plot shows the original warming record (light blue), in which all drivers of warming are included, as well as the adjusted record (dark blue) which excludes the effects of ENSO, volcanoes and solar activity.

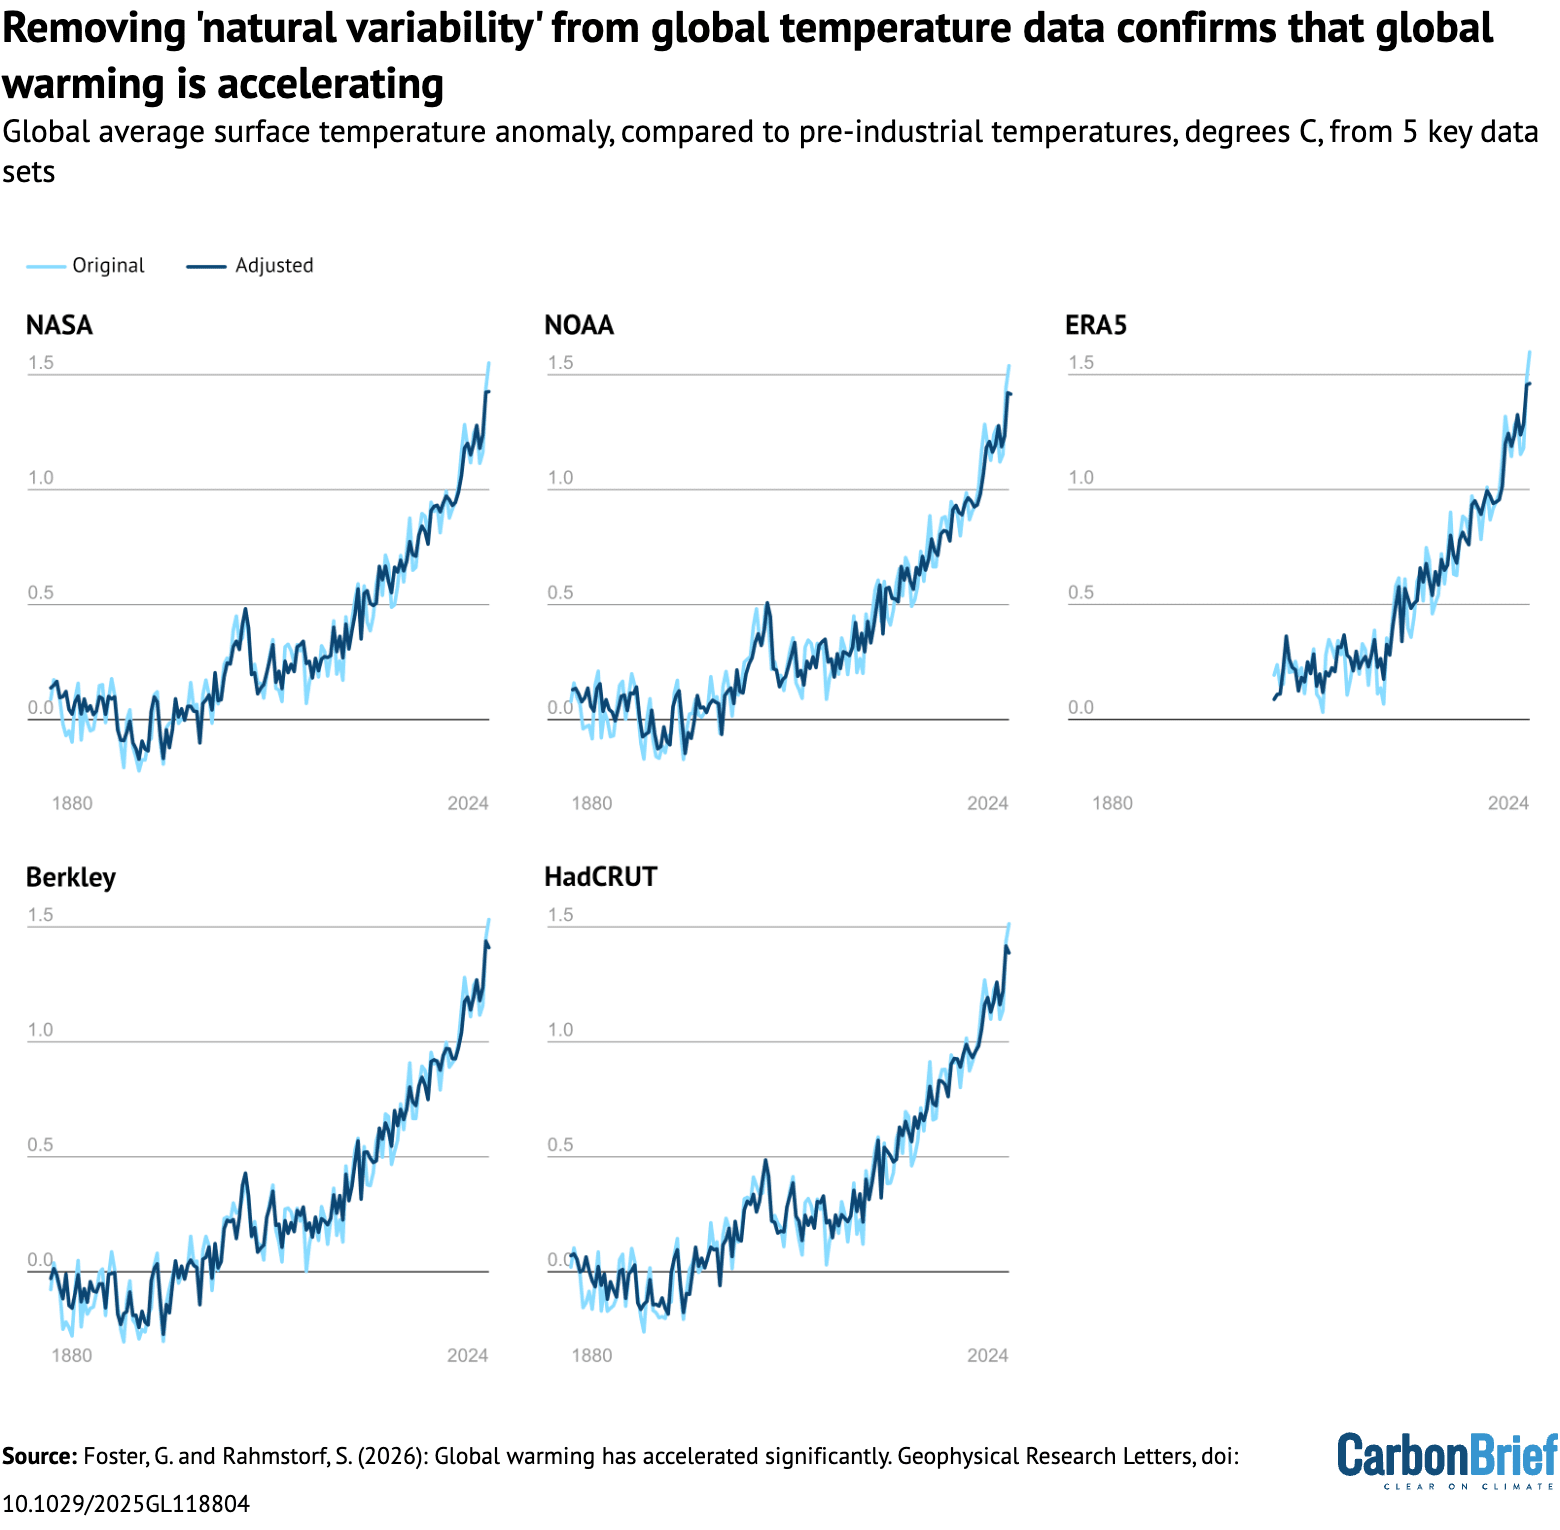
Removing the effects of natural variability makes the years 2023 and 2024 slightly cooler, the study notes, but they remain the two warmest years since the beginning of instrumental record.
Acceleration
Record-high temperatures in recent years have led scientists to ask whether global warming is accelerating.
The authors of the new study decided to use two different statistical approaches to test whether they can identify a “statistically significant” acceleration in global warming from the long-term temperature record.
The “noise” from natural drivers of temperature change, such as ENSO, can make it tricky to spot underlying trends. However, Foster tells Carbon Brief that after removing the influence of natural variability, “acceleration is easy to prove statistically – some might even say it becomes obvious”.
Both tests find that warming is accelerating with more than 98% confidence for each of the five datasets. When the same tests were run on the unadjusted data, they failed to reach even 95% confidence, showing the importance of removing natural variability from the warming signal, according to the study authors.
Under the first statistical approach, called a quadratic analysis, the authors applied a single curved trend line to the warming signal.
For the second approach, the authors used a technique to identify the month when the rate of global warming changed noticeably. The different datasets estimated this date to range from February 2013 to February 2014. They then calculated the speed of global warming both before and after these dates.
Global temperatures increased at an average rate of around 0.2C per decade over 1970-2015, according to the study.
In contrast, the authors find that warming rates have increased to 0.34-0.42C per decade, across the five different datasets, since the February 2013-February 2014 period.
The study reveals that the rate of warming observed over the past decade has been higher than any previous decade in the instrumental record.
Foster tells Carbon Brief that “the essential result of this paper isn’t how fast we’re warming, but that warming is now happening faster than before and that the difference isn’t negligible”.
If this warming rate remains constant, the Paris Agreement 1.5C threshold would be breached between 2026 and 2029, the authors find.
(Their approach estimates the 20-year period where the average exceeds 1.5C of warming, and the breach of the limit is taken as the halfway point in this period.)
The table below shows key results for the five different datasets, including estimates for the date that warming started accelerating, the rate of warming and the year that the Paris Agreement will be breached in each.
| Data source | Date of acceleration | Warming rate (C per decade) | Year to cross 1.5C |
|---|---|---|---|
| NASA | April 2013 | 0.36 | 2028 |
| NOAA | February 2013 | 0.36 | 2028 |
| HadCRUT | January 2014 | 0.34 | 2029 |
| Berkley | February 2014 | 0.36 | 2028 |
| ERA5 | February 2014 | 0.42 | 2026 |
Results for the five different datasets, including estimates for the date that warming started accelerating, the rate of warming and the year that the Paris Agreement will be breached in each. Source: Foster and Rahmstorf (2026).
‘Statistical significance’
There are “many opinions” among climate scientists about how fast the planet is currently warming, Foster tells Carbon Brief.
For example, a study from Dr James Hansen calculates a warming rate of 0.27C per decade after 2010. Similarly, the latest Indicators of Global Climate Change report estimates warming of 0.27C per decade over 2015-24.
Foster continues:
“But we all agree it’s higher than before. [The] thing is, we couldn’t prove that statistically.”
Foster tells Carbon Brief that in 2024, Dr Claudie Beaulieu – an assistant professor at the University of California – led a study which concluded that “a recent surge in global warming is not detectable yet”.
Beaulieu used the same statistical method as Foster to investigate whether global temperature data shows an acceleration in warming. However, she did not first remove the natural drivers of temperature change, such as ENSO.
(Carbon Brief wrote about Beaulieu’s work in more detail when it was published.)
Foster tells Carbon Brief that the study was “excellent”, adding:
“They found that confirming acceleration was a close call – the data are very suggestive – but not quite ‘statistically significant.’”
Foster explains that after removing the natural influence, the warming trend is clearer, making it easier to find statistically significant warming levels.
Beaulieu praises the new study, explaining that “the fact that the acceleration signal appears consistently across all five independent datasets is reassuring”.
However, she stresses that “the acceleration may prove temporary”.
She says that “continued monitoring over the next several years will be essential to determine whether the accelerated warming rate identified here represents a lasting shift”.
The study authors say that the main limitation of their work is that the method of removing natural variability is “empirically based, but approximate and imperfect”.
Foster says:
“We estimate the impact of things like El Niño by comparing past values of the El Niño index to past temperature changes, hence we don’t need to know the physics behind it, just the numbers. Statistical results like this are only approximate.”
Meanwhile, an acceleration in warming is supported by many other observations of the Earth’s climate.
For example, ocean heat content – the measure of the amount of energy stored in the ocean – is rising year on year. There is also evidence of acceleration in recent years, with the period from 2020 onward seeing the largest year-to-year increases in ocean heat content on record.
In addition, the Earth’s energy imbalance, which measures the difference between incoming solar radiation and outgoing radiation, has also increased in recent years.
The post Pace of global warming has nearly doubled since 2015, reveals study appeared first on Carbon Brief.
Pace of global warming has nearly doubled since 2015, reveals study