

China’s power sector is both the world’s largest emitter and the largest source of clean-energy growth, making it essential to global climate efforts.
This means it will be a key part of China’s next nationally determined contribution (NDC) – its climate pledge under the Paris Agreement for 2035 – which all countries are expected to publish by this year.
Yet, at the same time, Chinese policymakers are grappling with perceived tensions between ensuring a reliable energy supply amid uncertain demand growth and future cost trajectories, which have the potential to weigh down climate ambition.
In our new study, co-authored with experts from Tsinghua University and published in Cell Reports Sustainability, we model pathways for China’s power system up to 2035 that are consistent with its wider climate goals, incorporating a wide range of scenarios and uncertainties currently being debated in the country.
We find that China would need to deploy 2,350-2,780 gigawatts (GW) of wind and solar by 2030 and 2,910-3,800GW by 2035 – roughly double current levels – to be consistent with a target of limiting the rise in global temperatures to 2C this century.
Furthermore, ensuring that the share of wind and solar generation reaches around 40% by 2030 and 50% by 2035 would set the power sector up for the longer-term transition to carbon neutrality by 2060.
Electricity generation from non-fossil fuels more broadly would reach around 50% by 2030 and more than 70% by 2035.
China’s climate ambitions
China’s “dual-carbon” goals, announced in 2020, aim to peak carbon emissions by 2030 and reach carbon neutrality by 2060. The country has already surpassed its 2030 renewable deployment target – 1,200GW of wind and solar – six years ahead of schedule, due to record-breaking annual additions of around 300GW of new capacity for two years in a row.
However, new coal-power developments and rapid growth in electricity demand pose a threat to meeting China’s other targets, such as emissions intensity and share of non-fossil fuel in the energy mix.
China began building nearly 95GW of new coal capacity in 2024, representing 93% of the world’s new coal capacity under construction.
If completed, China’s coal fleet – already the largest in the world – would expand to an installed capacity of 1,190GW.
This resurgence stems in large part from concerns surrounding energy security. China faced unprecedented power shortages in 2021 and 2022, while annual electricity demand has recently reached 10 petawatt-hours (PWh, or 10,000 terawatt hours) – a level that most studies predicted would not be reached until 2030.
This keeps the door open to continued growth in China’s electricity generation and emissions from coal, unless the expansion of clean energy is able to keep pace.
Setting the renewable energy pace
Our research looks at the rate of growth from clean energy that would be required to not only meet China’s rapidly rising demand for electricity, but also to push down its coal generation and squeeze emissions from the power sector.
We simulate a range of system “baselines” for 2030 and “scenarios” for 2035, under varying assumptions about electricity demand growth, carbon emissions limits, renewable energy costs and meteorological conditions.
The model includes detailed representations of where renewable energy capacity could be built and how the power sector could be operated efficiently.
It evaluates wind and solar resources and deployment potential at a level that is detailed enough to help capture regional differences and localised impacts, such as land use, socio-economic benefits and infrastructure needs.
The results are organised into 15 scenarios, categorised into three main groups: moderate growth in electricity demand (group A); rapid electrification (group B); and ambitious decarbonisation (group C).
The modelling is based around two different scenarios for China that are compatible with a global limit of 2C warming this century.
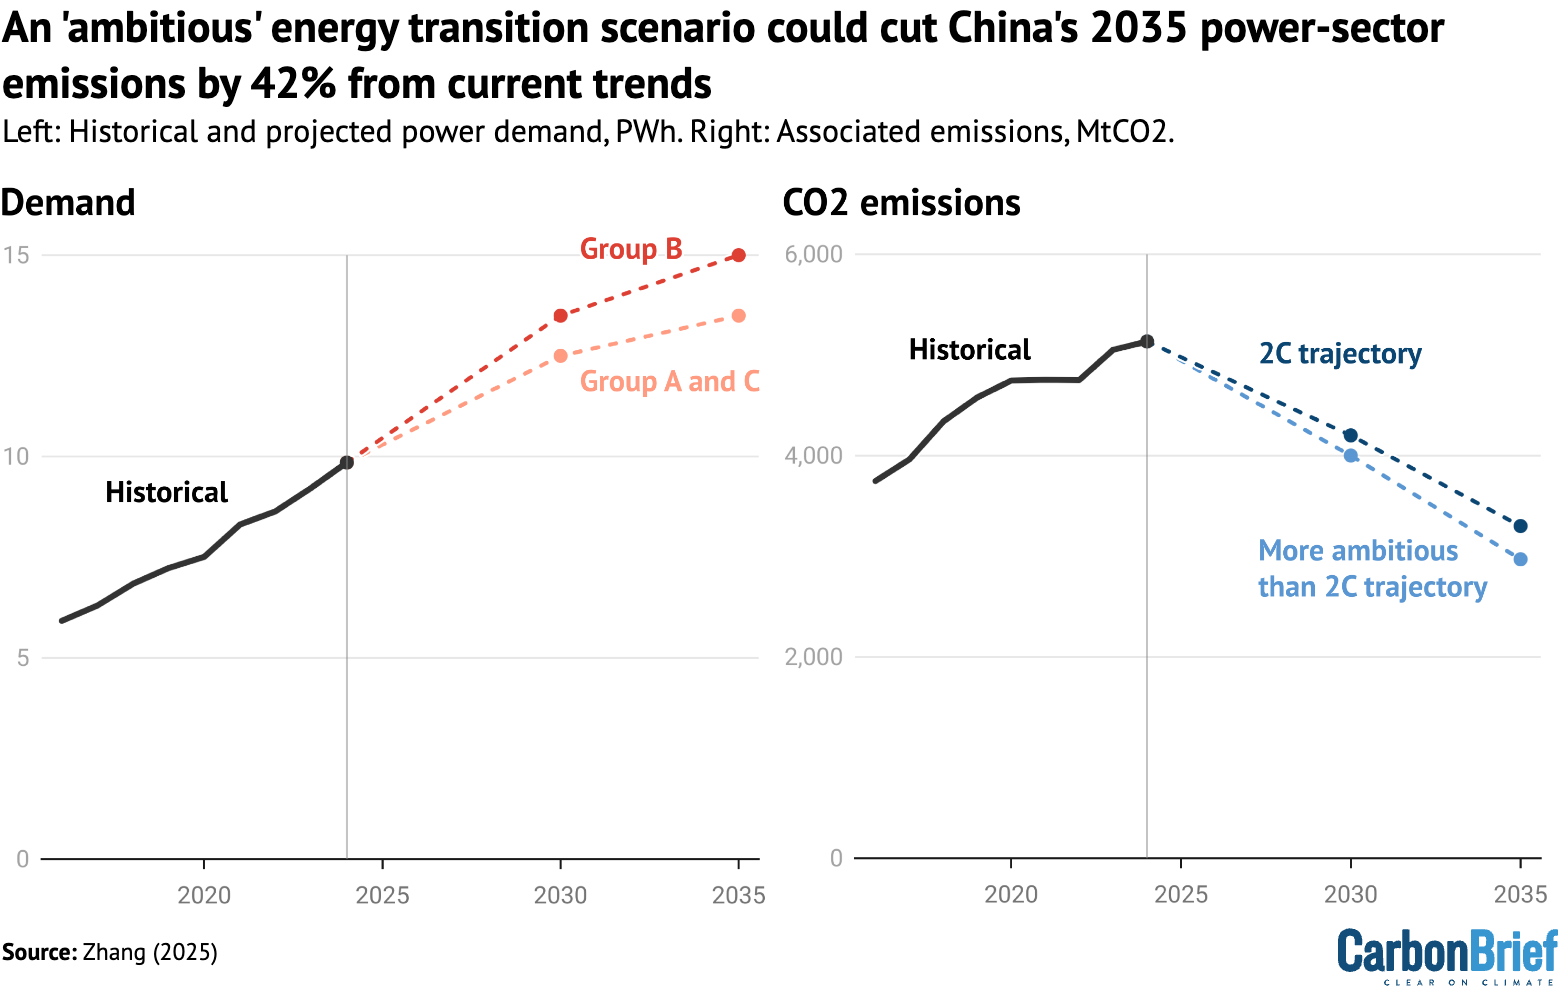
The basic 2C trajectory would see China’s power-sector emissions fall to 36% below 2024 levels by 2035, whereas the more ambitious 2C trajectory has a 42% decline.
The chart below shows recent electricity demand (left) and the carbon dioxide (CO2) emissions of China’s power sector (right), as well as how these might evolve under the different scenarios modelled for the paper.
The modelling accounts for recent trends suggesting that China’s electricity demand could reach 13.5PWh by 2035 (groups A and C). However, accommodating faster demand growth under a rapid electrification scenario (group B) would require China to deploy low-carbon energy even more rapidly, if it is to maintain pace with climate targets.
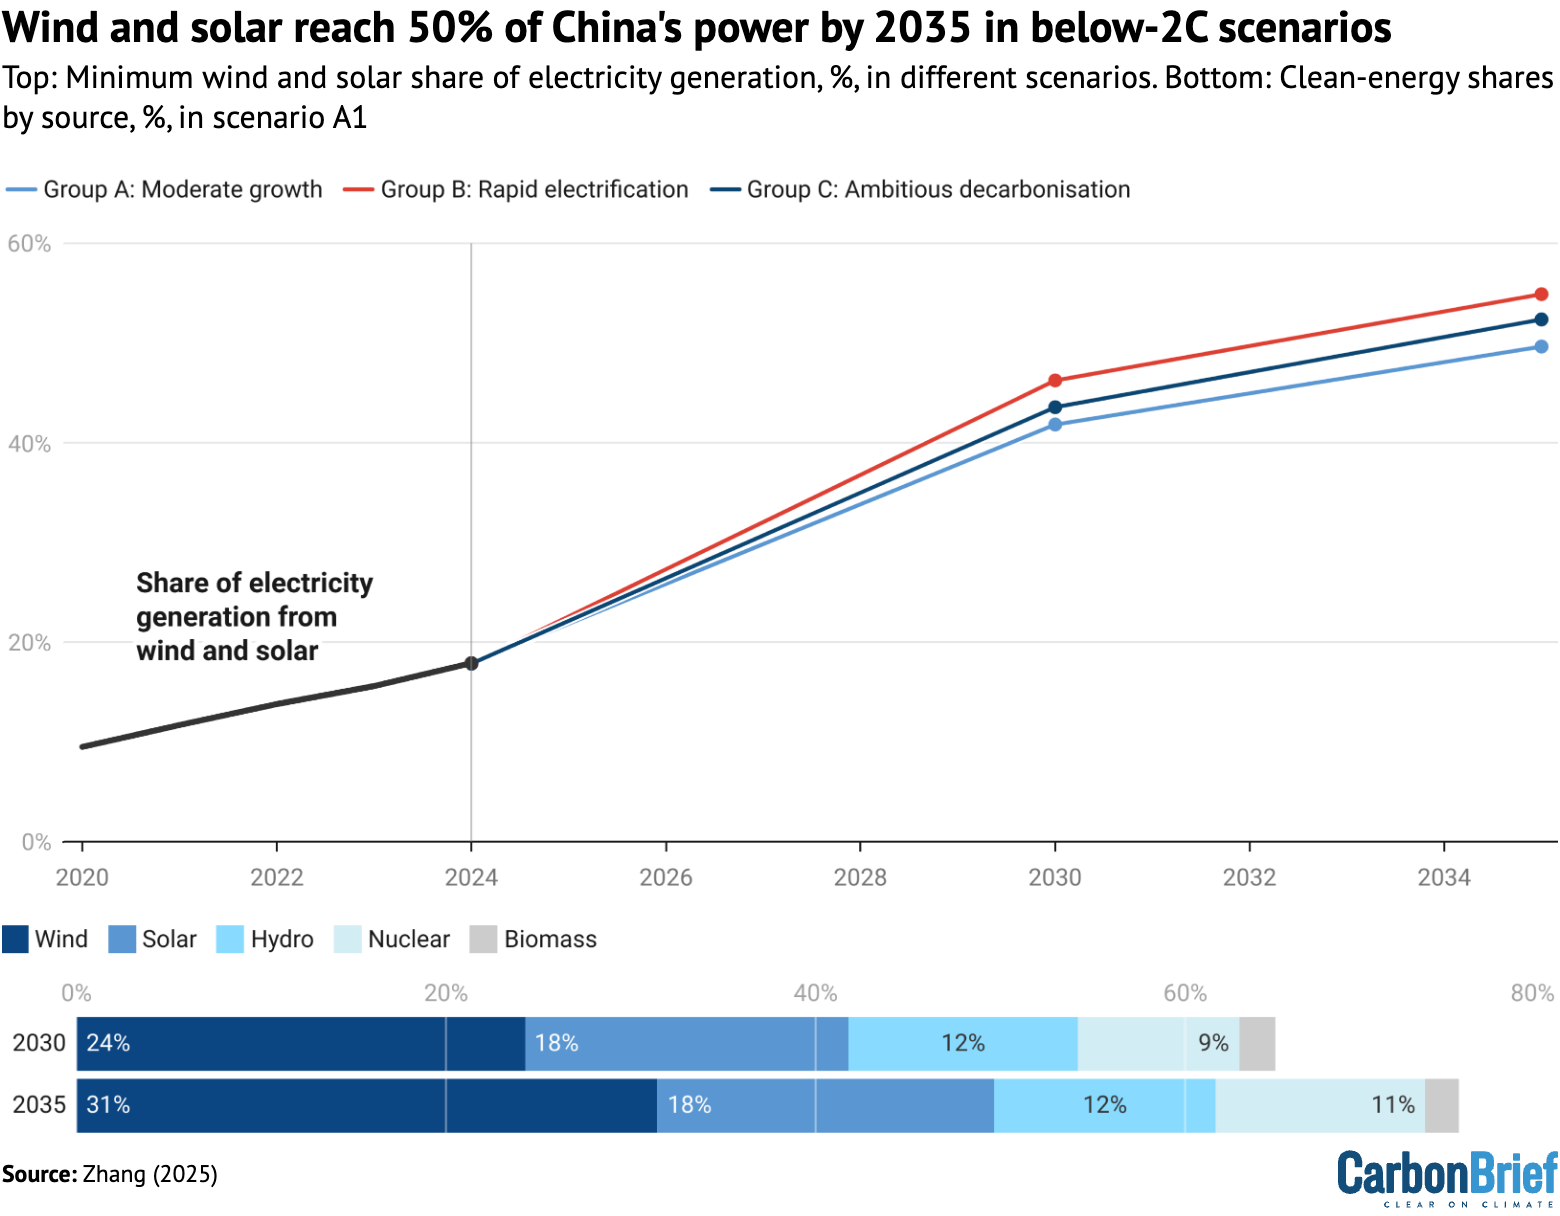
The modelling shows that wind and solar energy would need to supply around 40% of China’s electricity by 2030, if the country aims to remain on track for 2C of global warming. Solar and wind power generation would need to then rise to 50% by 2035 – up from 17.9% in 2024.
This growth would substantially reduce the system’s reliance on coal and other fossil fuels, which would decrease to 35% of generation in 2030 and 25% in 2035.
The more ambitious scenario, which targets limiting global warming since the pre-industrial period to between 1.5C and 2C, would lead to even higher wind and solar generation shares of 44% by 2030 and 54% by 2035.
Under the different scenarios, China’s wind and solar capacity would rise from around 1,700GW today to 2,350-2,780GW by 2030 and 2,910-3,800GW by 2035. Meeting this level of renewable deployment would require annual additions of 120-220GW.
Recent wind and solar additions have already exceeded this pace, but challenges with grid integration and supporting infrastructure could, nevertheless, slow future large-scale buildouts.
According to industry reports, 6.8% of wind and 6.1% of solar power generation were “curtailed” in the first four months of 2025, meaning the output could not be accommodated by the electricity grid and was wasted.
At the provincial level, wind and solar curtailment rates exceeded 10% in renewable-rich regions, such as Xinjiang, Gansu and Qinghai. To achieve the cost-efficient pathways modeled here, curtailment rates fall to 3-6%.
To achieve this level of integration, energy storage and transmission infrastructure will be necessary to shift renewable generation towards when and where it is needed.
Battery and grid capacity would need to rise by 6% and 5% per year from current levels out to 2035, respectively, in order to better integrate renewables into the grid.
Boosting wind and solar generation share
In order to explore the implications of uncertainty on China’s power system in 2030, the modelling includes three core scenarios (groups A-C).
Within these core groups, the modelling looks at the impact of further uncertainties on system outcomes by 2035, labelled A1, A2 and so on. This results in a “decision-tree” structure that outlines a range of possible futures.
The lines on the chart below show the share of China’s electricity that would be generated by wind and solar by 2030 and 2035, under each of these different futures. The coloured columns show the share of electricity generated by wind (red), solar (yellow), hydro (blue), nuclear (pink) and biomass (grey) in one specific scenario, namely, the “reference” case for renewable costs with moderate demand growth (A1).
The bands in the right-hand margin indicate the ranges of the 2035 results under all of the future scenarios, depending on variables such as the cost of renewables or batteries (cases two to four) and a larger rise in demand (case five).
At a minimum, for each of the 2C-compatible scenarios, wind and solar would take up around 50% of total generation by 2035.
Another consistent result across all scenarios is the need for more transmission capacity to shift generation from renewable-rich regions to those with high demand for power. By 2030, at least 225GW of new inter-provincial transmission capacity would be required, further enhancing electricity trading and grid reliability.
China is already expanding its “ultra-high-voltage” (UHV) transmission network at breakneck speed. As of the end of 2024, there were 42 UHV projects in operation, with a combined capacity exceeding 300GW.
Another assumption in the modelling is that electricity can flow freely and efficiently across regions, up to the transmission capacity limits. But, in reality, institutional and regulatory barriers complicate regional electricity trading.
China plans to establish a national unified power market by 2029. As such, deregulating the power sector is seen as an essential measure to enhance the power system’s operational efficiency and facilitate renewable energy integration.
Looking ahead to the NDC and beyond
Many experts have weighed in on China’s NDC target-setting, largely focusing on economy-wide emissions targets and non-CO2 greenhouse gases.
While these are indeed important elements of China’s next international climate pledge, our study seeks to identify robust power-sector targets that could support the country’s overall ambition and provide credible signals to energy planners.
Due to the rapidly evolving economic and geopolitical situation, there are good reasons to expect that China’s topline emissions number may be underwhelming.
On the other hand, there is an opportunity to emphasise and expand ambition within the power sector through additional sectoral targets. This would put a focus on quantifiable metrics that can guide investments and planning by state-owned enterprises and local governments.
While China has previously set a target for the absolute capacity of wind and solar, a goal for the share of electricity generation from these technologies, or for clean energy more broadly, would set a narrower range for future emissions from the power sector.
Given current uncertainties around the pace of power demand growth, for example, a target for clean energy share might provide greater confidence to policymakers than a capacity target alone.
Regardless of what targets are set, achieving the growth of clean energy modelled in our study would support China’s long-term climate commitments and demonstrate the nation’s intent to be a clean-energy powerhouse.

The post Guest post: What an ‘ambitious’ 2035 electricity target looks like for China appeared first on Carbon Brief.
Guest post: What an ‘ambitious’ 2035 electricity target looks like for China

Saturday, 17 October 2026
7.18 AM AWST
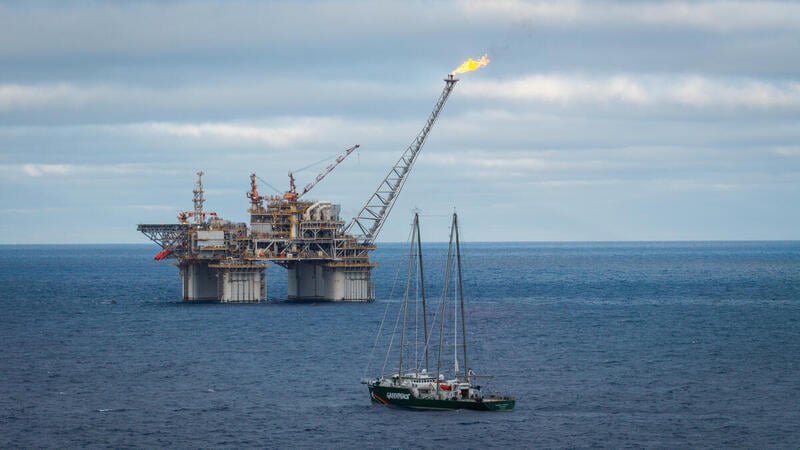
Hi folks! We’re joining you live from the Rainbow Warrior where we will be providing you with updates as our four activists continue scaling and occupying Woodside’s gas platform. The activists are peacefully protesting against Woodside’s latest gas expansion plans, the Browse project, which would see up to 57 toxic wells drilled at Scott Reef.
“Right now our activists are scaling Woodside’s massive Floating Production Unit. They are scaling the South-East pillar and the underside of the Helideck. They’ll be setting up camp soon and have plenty of provisions with them – so stick around!”
5:45 AM AWST
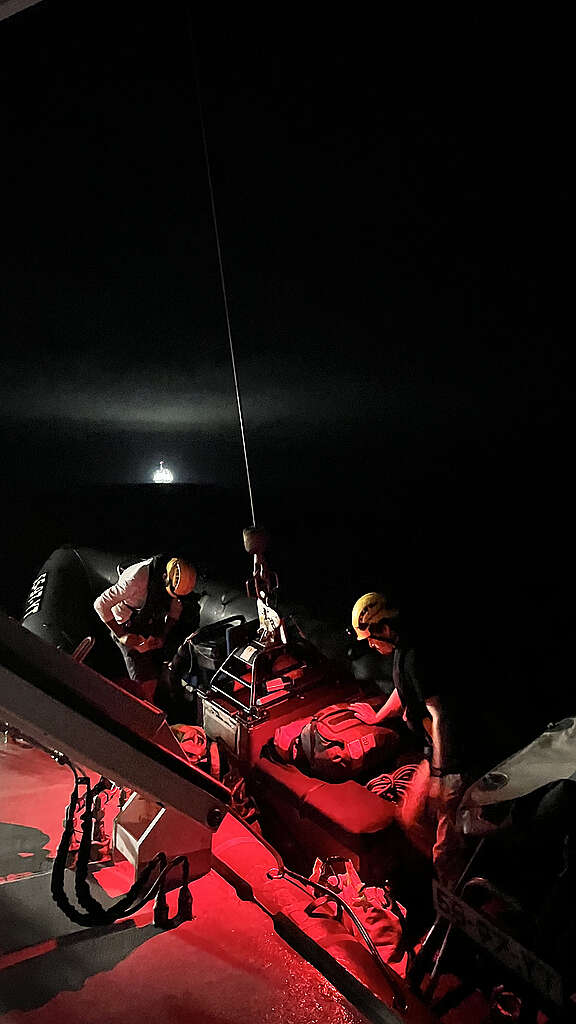
Our RHIBS are in the water! We’ve deployed our four activists and our ship crew on our small fast boats, headed to the gas platform. We’re carrying crew and equipment, plenty of food, all of our safety climbing gear, some big banners, cameras and a whole lot of heart… someone even has something to read after they get settled in.
5:26 AM AWST
Before sunrise activists prepared to launch RHIBS from the Rainbow Warrior.
Looking for a front seat view?
You can follow along with the Live Rainbow Warrior bow cam here!
Looking for more?
Follow us on Instagram for a peek behind the scenes and hear from our Rainbow Warrior crew.
Live blog: Greenpeace activists occupy Woodside gas project to save Scott Reef
Climate Change
Greenpeace activists climb and occupy Woodside’s Scarborough gas project calling on the Australian government to “Stop Woodside’s Dirty Gas” and “Save Scott Reef”
PERTH, Saturday 17 October 2026 — Four Greenpeace Australia Pacific activists are scaling and occupying a Floating Production Unit at Woodside’s Scarborough gas project off the coast of Western Australia, displaying banners reading: “Stop Woodside’s Dirty Gas. Save Scott Reef.”
- Photos and video available here and here. More will be uploaded throughout the day.
- Content and live updates will be uploaded to a live blog and to Instagram
Early this morning at 05:45 AWST, Greenpeace Australia Pacific activists launched from the Rainbow Warrior, Greenpeace’s flagship vessel, scaling and attaching themselves to a Floating Production Unit (FPU), a key piece of gas processing infrastructure at the Scarborough gas field over 200km off the coast of Exmouth.
Woodside has since confirmed it has initiated a temporary shut down of the FPU.
Greenpeace Australia Pacific is occupying the gas platform in peaceful protest of Woodside’s plans to drill for oil and gas at Scott Reef as part of its Browse proposal.
David Ritter, CEO at Greenpeace Australia Pacific, said: “Greenpeace Australia Pacific is taking action today to expose the unacceptable risk to Scott Reef posed by Woodside’s plans.
“Australians love our oceans. Woodside’s reckless Browse gas proposal would turn the magnificent Scott Reef into an industrial gas zone. Woodside wants to drill up to 57 toxic wells around Scott Reef, Australia’s largest oceanic reef, home to nesting green sea turtles, and endangered species like pygmy blue whales and the dusky sea snake; it is a place like nowhere else on Earth.
“Woodside has an alarming track record of oil spills, incidents and environmental neglect, and can’t be trusted with our oceans. From whaling in Albany in the seventies, to Woodside’s threat to Scott Reef today, there’s more than fifty years of history, of Greenpeace taking action off WA’s coasts to protect our oceans.
“There’s no future in new gas projects. Our future is in secure homegrown renewable energy, green industry and exports, where communities and places like Scott Reef are protected — there’s no future in dirty gas shipped offshore.
“The prospect of drilling for oil or gas on the Great Barrier Reef would be considered absolute madness today, but that is exactly the decision before the government: save Scott Reef or risk its destruction at the hands of a gas corporation.”
From aboard the Floating Production Unit, Dr Chris Holden, Greenpeace Australia Pacific activist said: “As a doctor, when I see new fossil fuel projects like Woodside’s Browse project being put forward, I can’t help but think about the impact this is going to have on the health of our communities and planet, and feel a sense of duty to act.
“Not only will this project do irrevocable harm to nature at Scott Reef, it will have a terrible impact on our climate, putting all of our lives at risk.
“On the Rainbow Warrior I’m carrying a copy of the 2025 Lancet countdown report, which warns that health impacts of climate change are worsening, with millions dying needlessly each year due to fossil fuel dependence, growing emissions, and failure to adequately adapt.
“With warnings like this from the leading global health professionals, our government simply can’t allow fossil fuel projects like Woodside’s Browse project to go ahead. It is their duty to do what is in the best interest of our communities.”
Almost half a million people have signed a petition calling on the government to Save Scott Reef and Woodside’s Browse gas project.
-ENDS-
Notes:
- Dial-in, SimSat and Zoom interviews with Geoff Bice, WA Campaign Lead at Greenpeace Australia Pacific, currently aboard the Rainbow Warrior, can be organised separately
Media contact:
Greenpeace Australia Pacific media team on +61 406 231 892 or +61 407 581 404
The board of the Fund for Responding to Loss and Damage (FRLD) will decide on Thursday on whether to “provisionally set aside” $20 million for Nepal to deal with some of the effects of the climate-driven flood it suffered in August.
The motion, seen by Climate Home News, has been drafted by a group of board members from both developed and developing countries and so is likely to pass easily at the fund’s first-ever extraordinary board meeting on October 22.
It invites the government of Nepal to submit a proposal for how to use the money, with the board then deciding at one of its regular board meetings whether to approve the proposal or not.
While Nepali officials have described $20 million as merely “symbolic” in the face of the $4.8 billion estimated costs of recovery and reconstruction, it would be the first time the new FRLD – agreed in 2022 months after devastating floods in Pakistan – has set aside money for a specific disaster.
Until now the fund has only taken requests through a single call for proposals, launched at COP30 in Belém last November, that gave countries six months to submit requests.
Most of the 180 projects the FRLD is currently considering are designed to help countries avoid damage from future climate disasters, for example by strengthening responses to floods in Bangladesh and Lagos.
The draft decision says Nepal’s proposal will serve as a pilot for how funding requests can be submitted outside of the fund’s current timetable. That could let governments seek funds quickly after a climate disaster strikes, rather than waiting for the next call.
This arrangement would set the fund apart from other United Nations funds designed for climate adaptation or cutting emissions like the Green Climate Fund.
Climate campaigners from Fill the Fund said the draft decision is “a real step forward” as it is “the first time this Fund has moved to respond to a specific disaster”.
Too little, too late
The FRLD was agreed by governments at COP27, set up and operationalised at COP28 in 2023 but has yet to award any money. The 180 funding requests it is currently considering would cost around $2.8 billion, but it only has $350 million to allocate.
The United Nations Secretary-General António Guterres has described the amount of money available in the fund as “ridiculously small” and Fill the Fund said $20 million “is a meaningful signal but it is a drop against an ocean of need”.
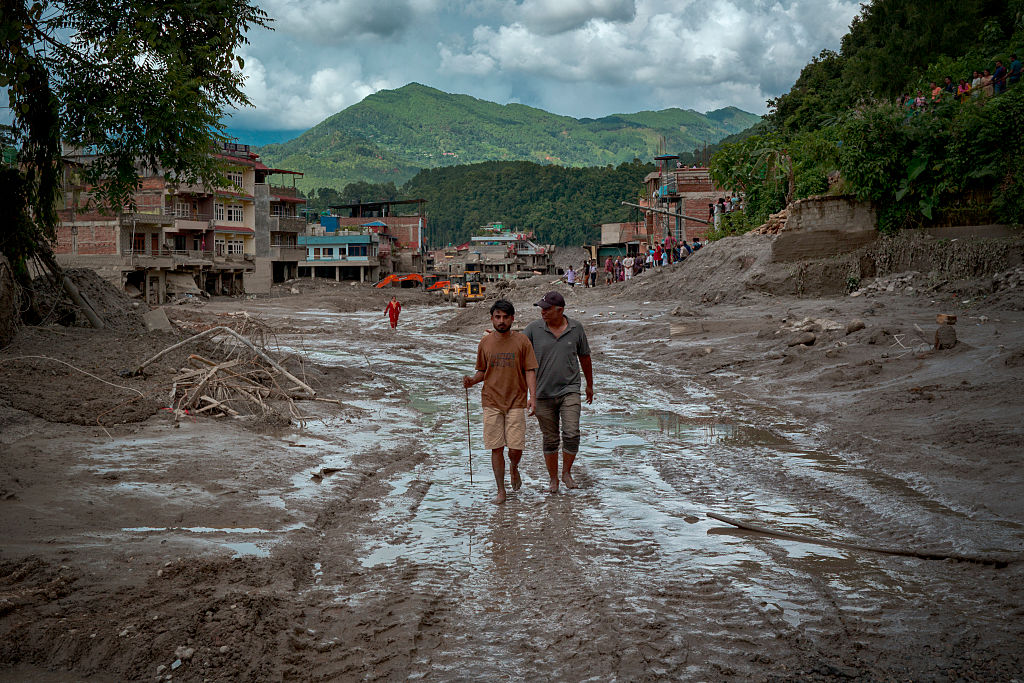
A glacial rock and ice collapse sent a torrent of water and debris through Nepal and the Chinese-administered region of Tibet on August 26. It killed more than 1,400 people, left thousands more missing and destroyed homes, bridges, roads and hydropower plants. Nepal’s finance and environment ministers quickly appealed to the FRLD board for funds, saying that “time is of the essence”.
Their call was followed swiftly by a letter from developing country FRLD board members urging the board’s co-chairs to organise an extraordinary meeting to allocate funds to Nepal.
But developed countries initially called for an informal consultation rather than a full board meeting. It took a further 45 days for the board’s co-chairs to organise an extraordinary board meeting for October 22 and to draft a motion for adoption.
Fill the Fund called for a permanent way of the fund rapid responding to disasters as “Nepal should not have required historic letters, an informal drafting group and the Fund’s first-ever extraordinary meeting simply to unlock an emergency response. The next country cannot wait two months and a bureaucratic marathon. Speed must be built in, not improvised.”
The post UN’s loss and damage fund set to give Nepal $20m for flood recovery appeared first on Climate Home News.
UN’s loss and damage fund set to give Nepal $20m for flood recovery

