

From DAAD Summer School to Doctorate: Reflections at ICON 9
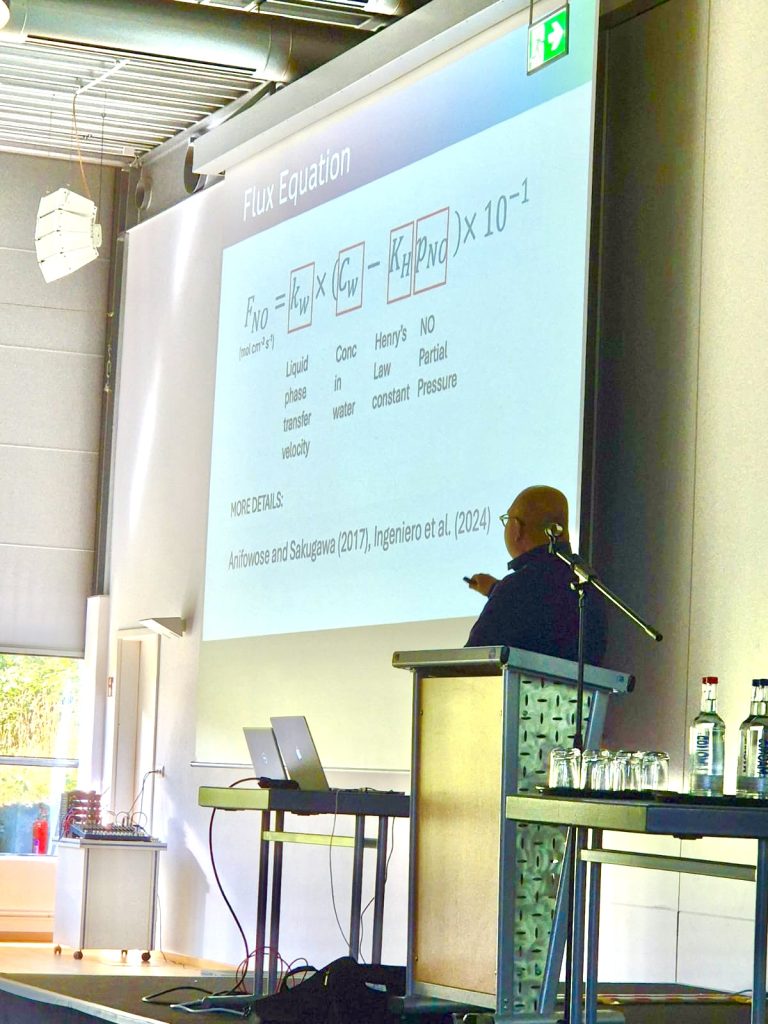
Hi! I am Riel Carlo O. Ingeniero from the Chemical Oceanography Department at GEOMAR. I recently had the opportunity to attend ICON 9 (International Conference on Nitrification and Related Processes) last July 2025, one of the leading conferences focused on advances in the nitrogen cycle. It was an honour to be selected to present my research twice – first during the Early Career Workshop on the opening day, and then through a poster presentation on the second day of the main conference.
ICON 9 brought together many of the most prominent names in marine nitrogen cycle research. I was fortunate to meet and engage with inspiring scientists, including Dr. Boran Kartal, Dr. Hanna Marchant from the Max Planck Institute in Bremen, Dr. Claudia Frey from the University of Vienna, Dr. Scott Wankel from Woods Hole Oceanographic Institution, Dr. Bo Thamdrup from the University of Southern Denmark, and Dr. Qixing Ji from HKUST. I also had the chance to see Dr. Bess Ward in person, someone whose work I’ve long admired.

The conference was hosted by the Max Planck Institute for Marine Microbiology in Bremen, a place that holds deep personal significance. I first visited it 13 years ago during a DAAD International Summer School Biodiversity: Diversity of Ecosystems, Genes, and Species at the University of Osnabrück. That visit, including a tour of the Max Planck Institute and MARUM led by Prof. Dr. Rudolf Amann, played a pivotal role in my decision to pursue a career in marine science.
I recently completed my doctorate at Kiel University in June this year, and I am incredibly grateful for the excellent education and world-class research environment that Germany offers. Under the supervision of Prof. Dr. Hermann W. Bange and funded by the DAAD Research Grants – Doctoral Programmes in Germany and the SO305-BIOCAT-IIOE2 project, I have had the opportunity to work on cutting-edge research in marine biogeochemistry, with a particular focus on nitric oxide (NO) dynamics in the ocean.
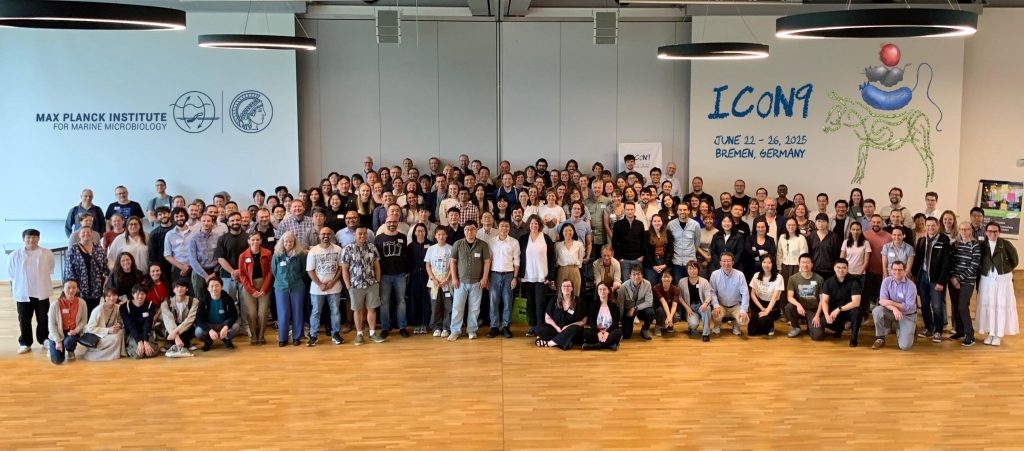
Presenting in front of over 100 participants during the ICON 9 was not only a rewarding experience but also excellent preparation just days before my doctoral defense and oral examination. Overall, ICON 9 was a meaningful and inspiring milestone, a full-circle moment in my scientific career.
Special thanks to FYORD and Kiel Marine Science for supporting my growth as an early-career marine scientist.
Riel Carlo
15th International Conference on Palaeoceanography, India
When my Uber wound through the chaotic traffic of Bengaluru at 2 am, I knew this conference would be different from the ones I was used to in Germany. I had just arrived in India for the 15th International Conference on Palaeoceanography (ICP15), supported by the FYORD Travel Grant, and was about to spend a week combining science with new cultural impressions.
ICP is a conference with a unique size and structure. It takes place only every three years, and everyone in the field is looking forward to the meeting – indeed, it rather feels more like a “big get-together” than a conference. The program is linear, with one topic per day and no parallel sessions. This allows for focus and provides more room for discussions. I also had the feeling that this format is more comfortable for Early Career Scientists. You don´t have to plan a lot in advance, and you never feel like you´re missing out on anything. But perhaps the best way to capture the spirit of ICP is to take you on a walk through a typical day:
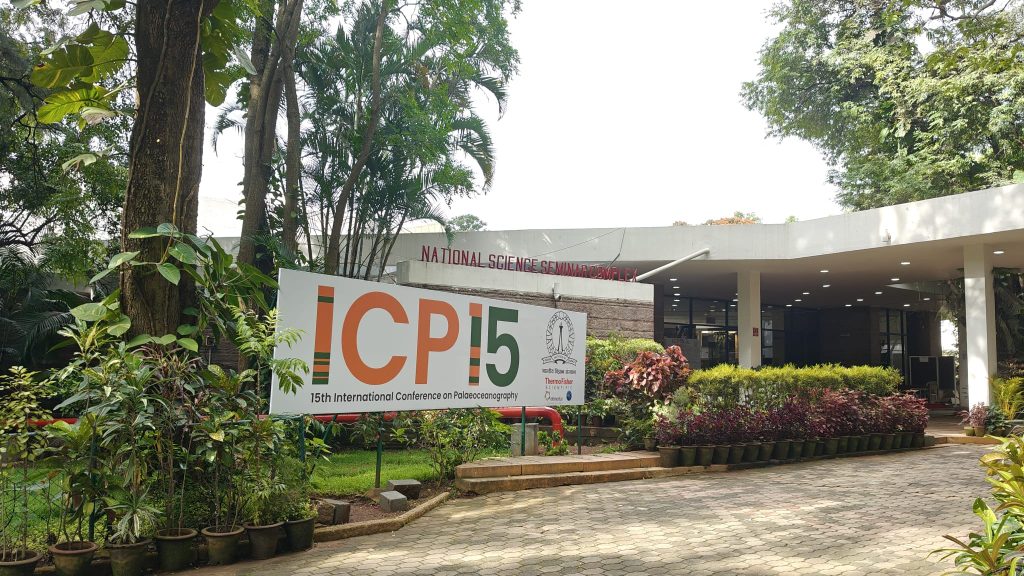
The days started with a short ride in one of the green-yellow tuk-tuks to the conference venue, which was located in one of the few green spots of the city on the campus of the Indian Institute of Science. The mornings were covered by talks by invited speakers. Actually all talks at ICP are only given by invited speakers, and you can only be selected for a talk once in a lifetime! Accordingly, we were able to enjoy some excellent presentations. Before lunch, there was a long plenum discussion with the five speakers from the morning. It was not only a great opportunity to hear different opinions on specific sub-topics, but also to show the connections between different talks, highlighting the most urgent research topics and gaps different groups are currently working on.
During lunch break, we could choose between a variety of typical Indian foods. Even though the chefs took care that the food was not too spicy for the foreign wimps, you never knew if you would sweat after the next bite. The highlight was definitely the daily Dosa, a South Indian speciality: It´s a thin, savory and crispy fried pancake made from fermented dough served with chutneys and sambars.
Long poster-sessions took place in the afternoons. All posters were put up during the whole week, which is also a big difference from huge conferences, where you usually just have a slot of one day or a few hours. It was enough time to look at the other posters, get inspired and exchange ideas. I also presented a poster with the results of the first two years of my PhD, in which I investigate climatically controlled changes in sedimentation at a site in the Southern Ocean close to Antarctica. We were able to link these changes on glacial-interglacial time scales with the ocean circulation and gain insights into the evolution of deep-water formation during times of rapid warming. Onall days, I had fruitful discussions about my work with experts in the field.


Each day was concluded with a perspective lecture by leading scientists fromthe different fields. These lectures were inspiring and an amazing summary, as they provided a broader context and deep insights into challenges and directions of palaeoceanographic research.
With the end of the scientific program, networking was not over yet, but had just started. The evenings offered a great opportunity to approach people and get into contact in a casual atmosphere. Whether at the icebreaker, conference banquet or at the Palaeomusicology Concert – another ICP tradition, which goes back to Nicholas Shackleton, paleoceanographer and skilled clarinet player. It´s an evening where the musical ones among the scientists show their skills. Singing, bagpipes, and even a small spontaneously formed band made the evening unforgettable!
Looking back, I am grateful for the opportunity to attend ICP15 with the support of the FYORD Travel Grant. It was both a scientific and cultural experience, and a great chance to meet old and new friends and colleagues. I can highly recommend ICP to other early career researchers in the field due to its unique format and special atmosphere!
Moritz
Gordon Research Conference in Animal-Microbe Interactions
My name is Igor Duarte, and I am a third-year PhD student at the Marine Symbiosis Lab, where we explore the origins and molecular novelties of close associations between bacteria and marine animals. The partnership I am mostly focused on in my PhD is between a free-living, mouthless flatworm from the genus Paracatenula, and the chemosynthetic bacteria from the genus Candidatus Riegeria that live inside its cells. In this system where no mouth is present to let nutrients in, the bacteria and are chemosynthetic, which means. After hundreds of millions of years of coevolution, this highly specialised symbiosis is now the only way by which each of these organisms can survive, and a topic of high interest to understand the evolution of such longstanding partnerships.
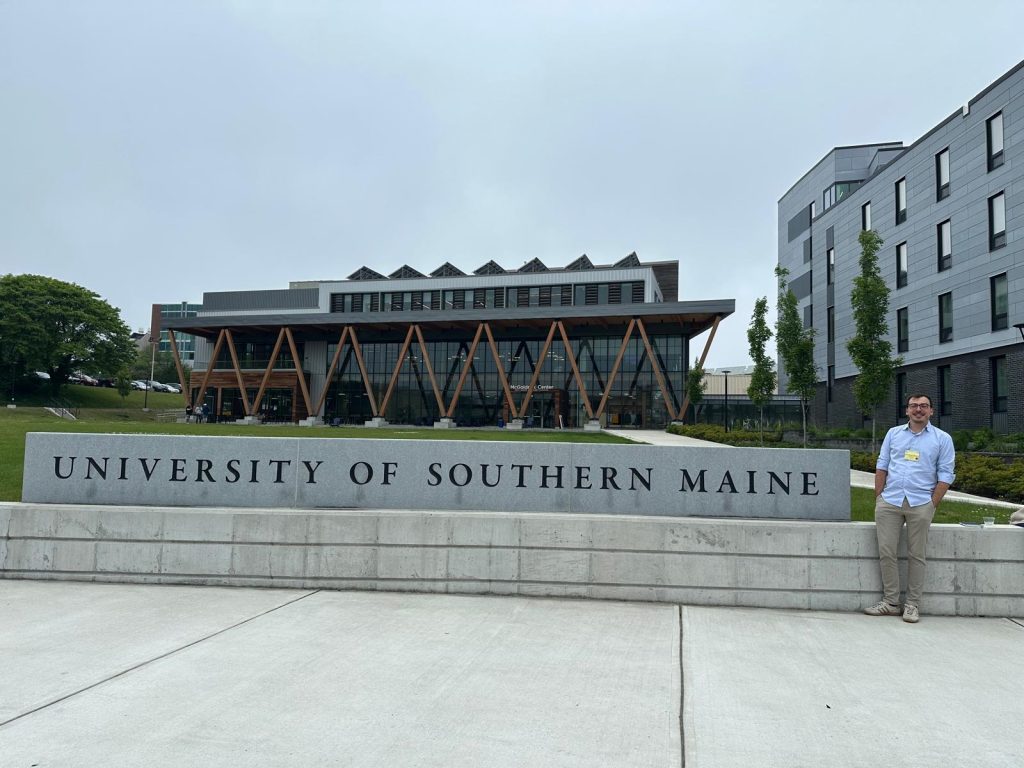
The FYORD Travel Grant programme supported my participation in the Gordon Research Conference (GRC) in Animal-Microbe Interactions, which this year took place in Portland, Maine, USA. Throughout the five days of the Conference, about 180 attendees from all over the world shared their main findings from the field of symbiosis, including the topics microbiome, intracellular microorganisms, parasitism, and evolution and molecular novelties of symbiotic associations. Additionally, the event was combined with a Gordon Research Seminar, which allowed early-career researchers to network more freely and exchange experiences from each one’s PhD and postdoctoral trajectories. I had the opportunity to present a poster entitled “Clade-specific genome evolution of Ca. Riegeria, the obligatory endosymbiont of a mouthless flatworm”, where I summarised the latest results from my PhD project.
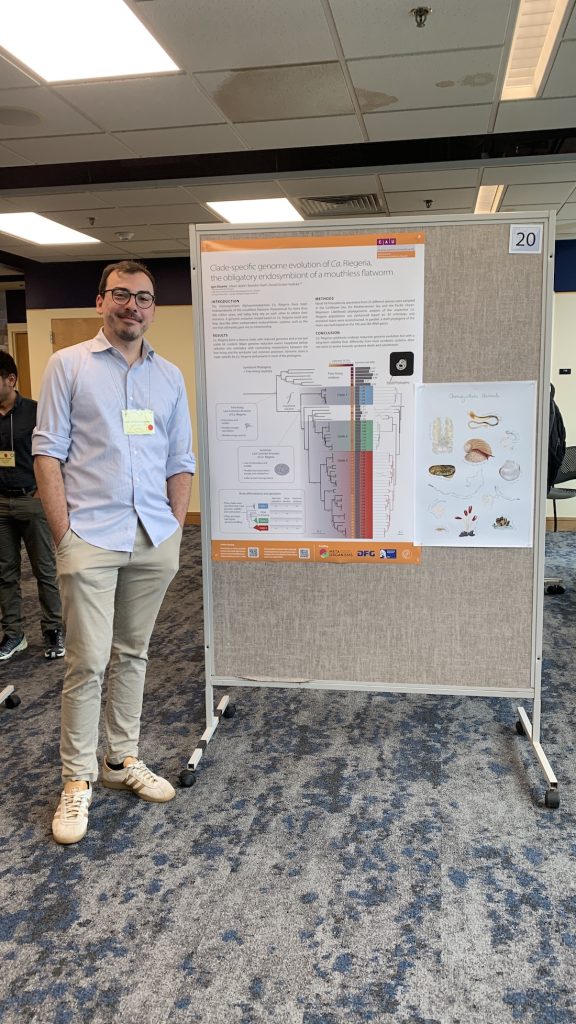
What I liked most about participating in this conference was how nicely it was conceptualised, with the goal of creating a relaxed environment to foster relevant connections between new and veteran attendees. In such a set-up, not only was I introduced to cutting-edge methods which are being used to answer relevant questions from the field, but I also had the opportunity to discuss them directly with the authors. Another positive aspect was that the speakers were encouraged to share problems that they faced during their experiments to show what real science looks like and to showcase how such issues can be overcome. Overall, I believe the conference was a game-changer for my PhD as I could get to know the main researchers in the field, whom I had so far only read about, and build the feeling of being part of a diverse community of symbiosis-enthusiasts.
Igor

Ocean Acidification
Dr Heidarzadeh’s TV interview with SkyNews on the massive M7.7 Panama earthquake on 9 October 2026
Dr Heidarzadeh’s TV interview with SkyNews on the massive M7.7 Panama earthquake on 9 October 2026. Click here for the full story.
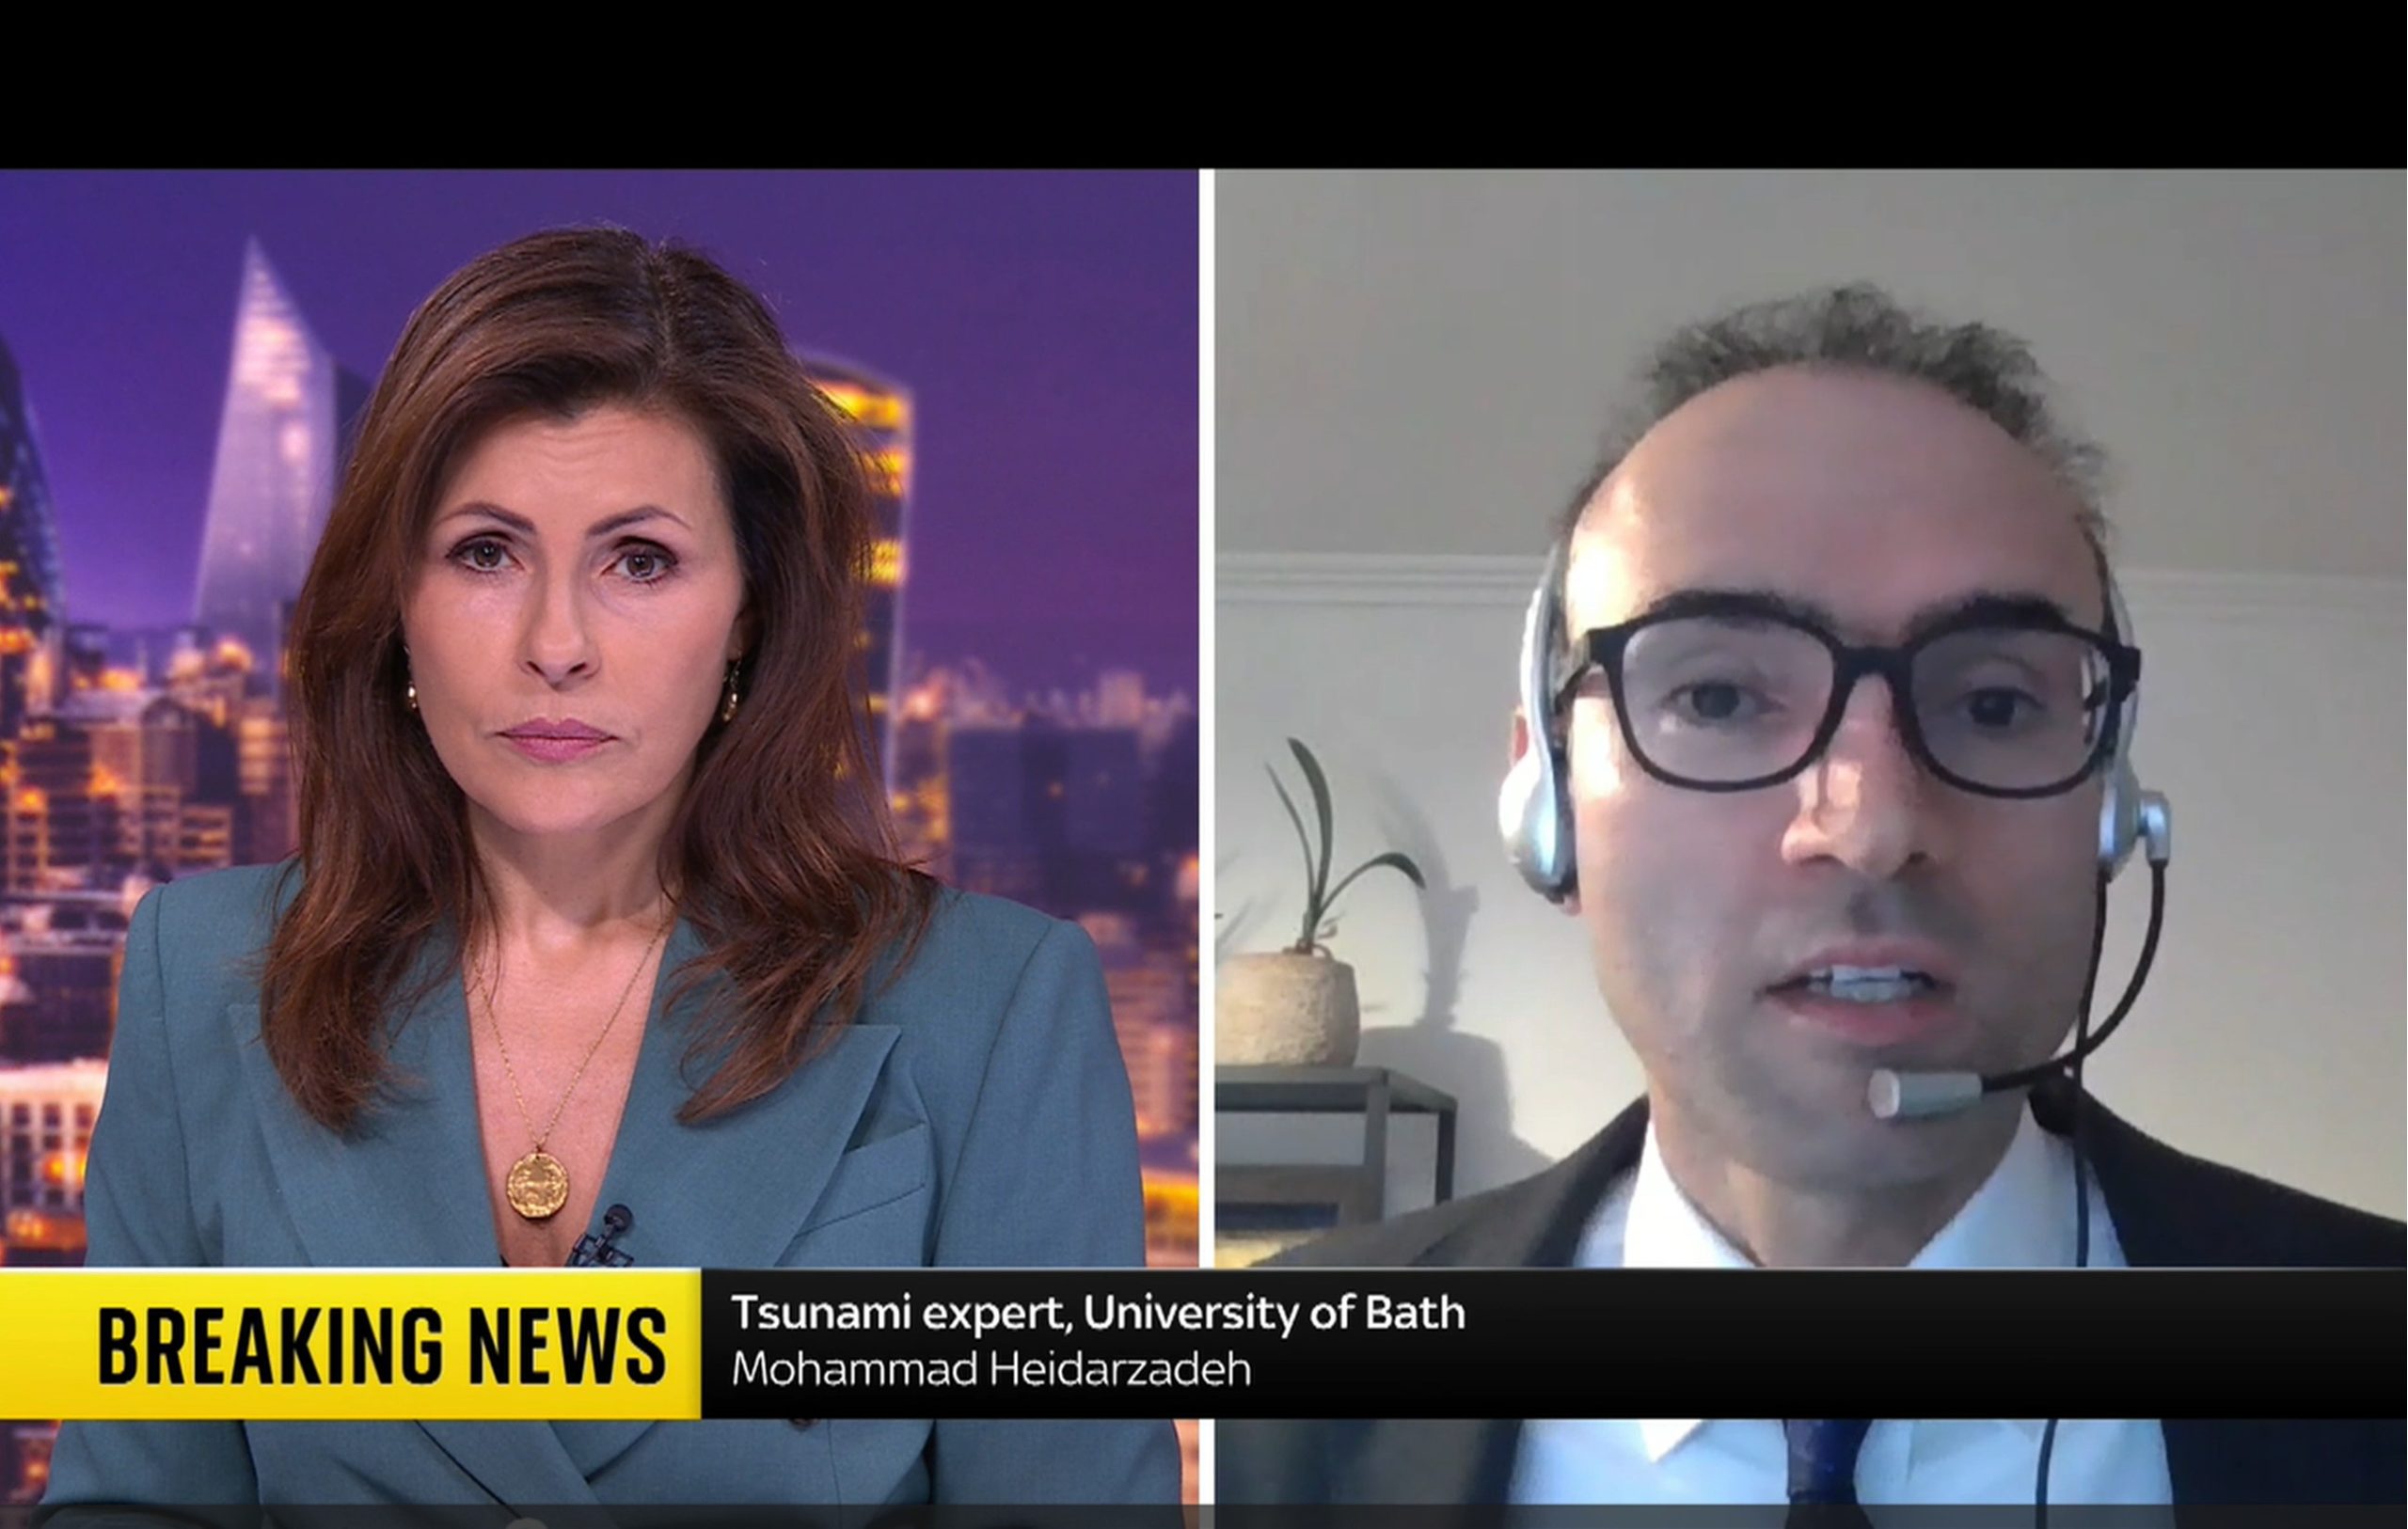
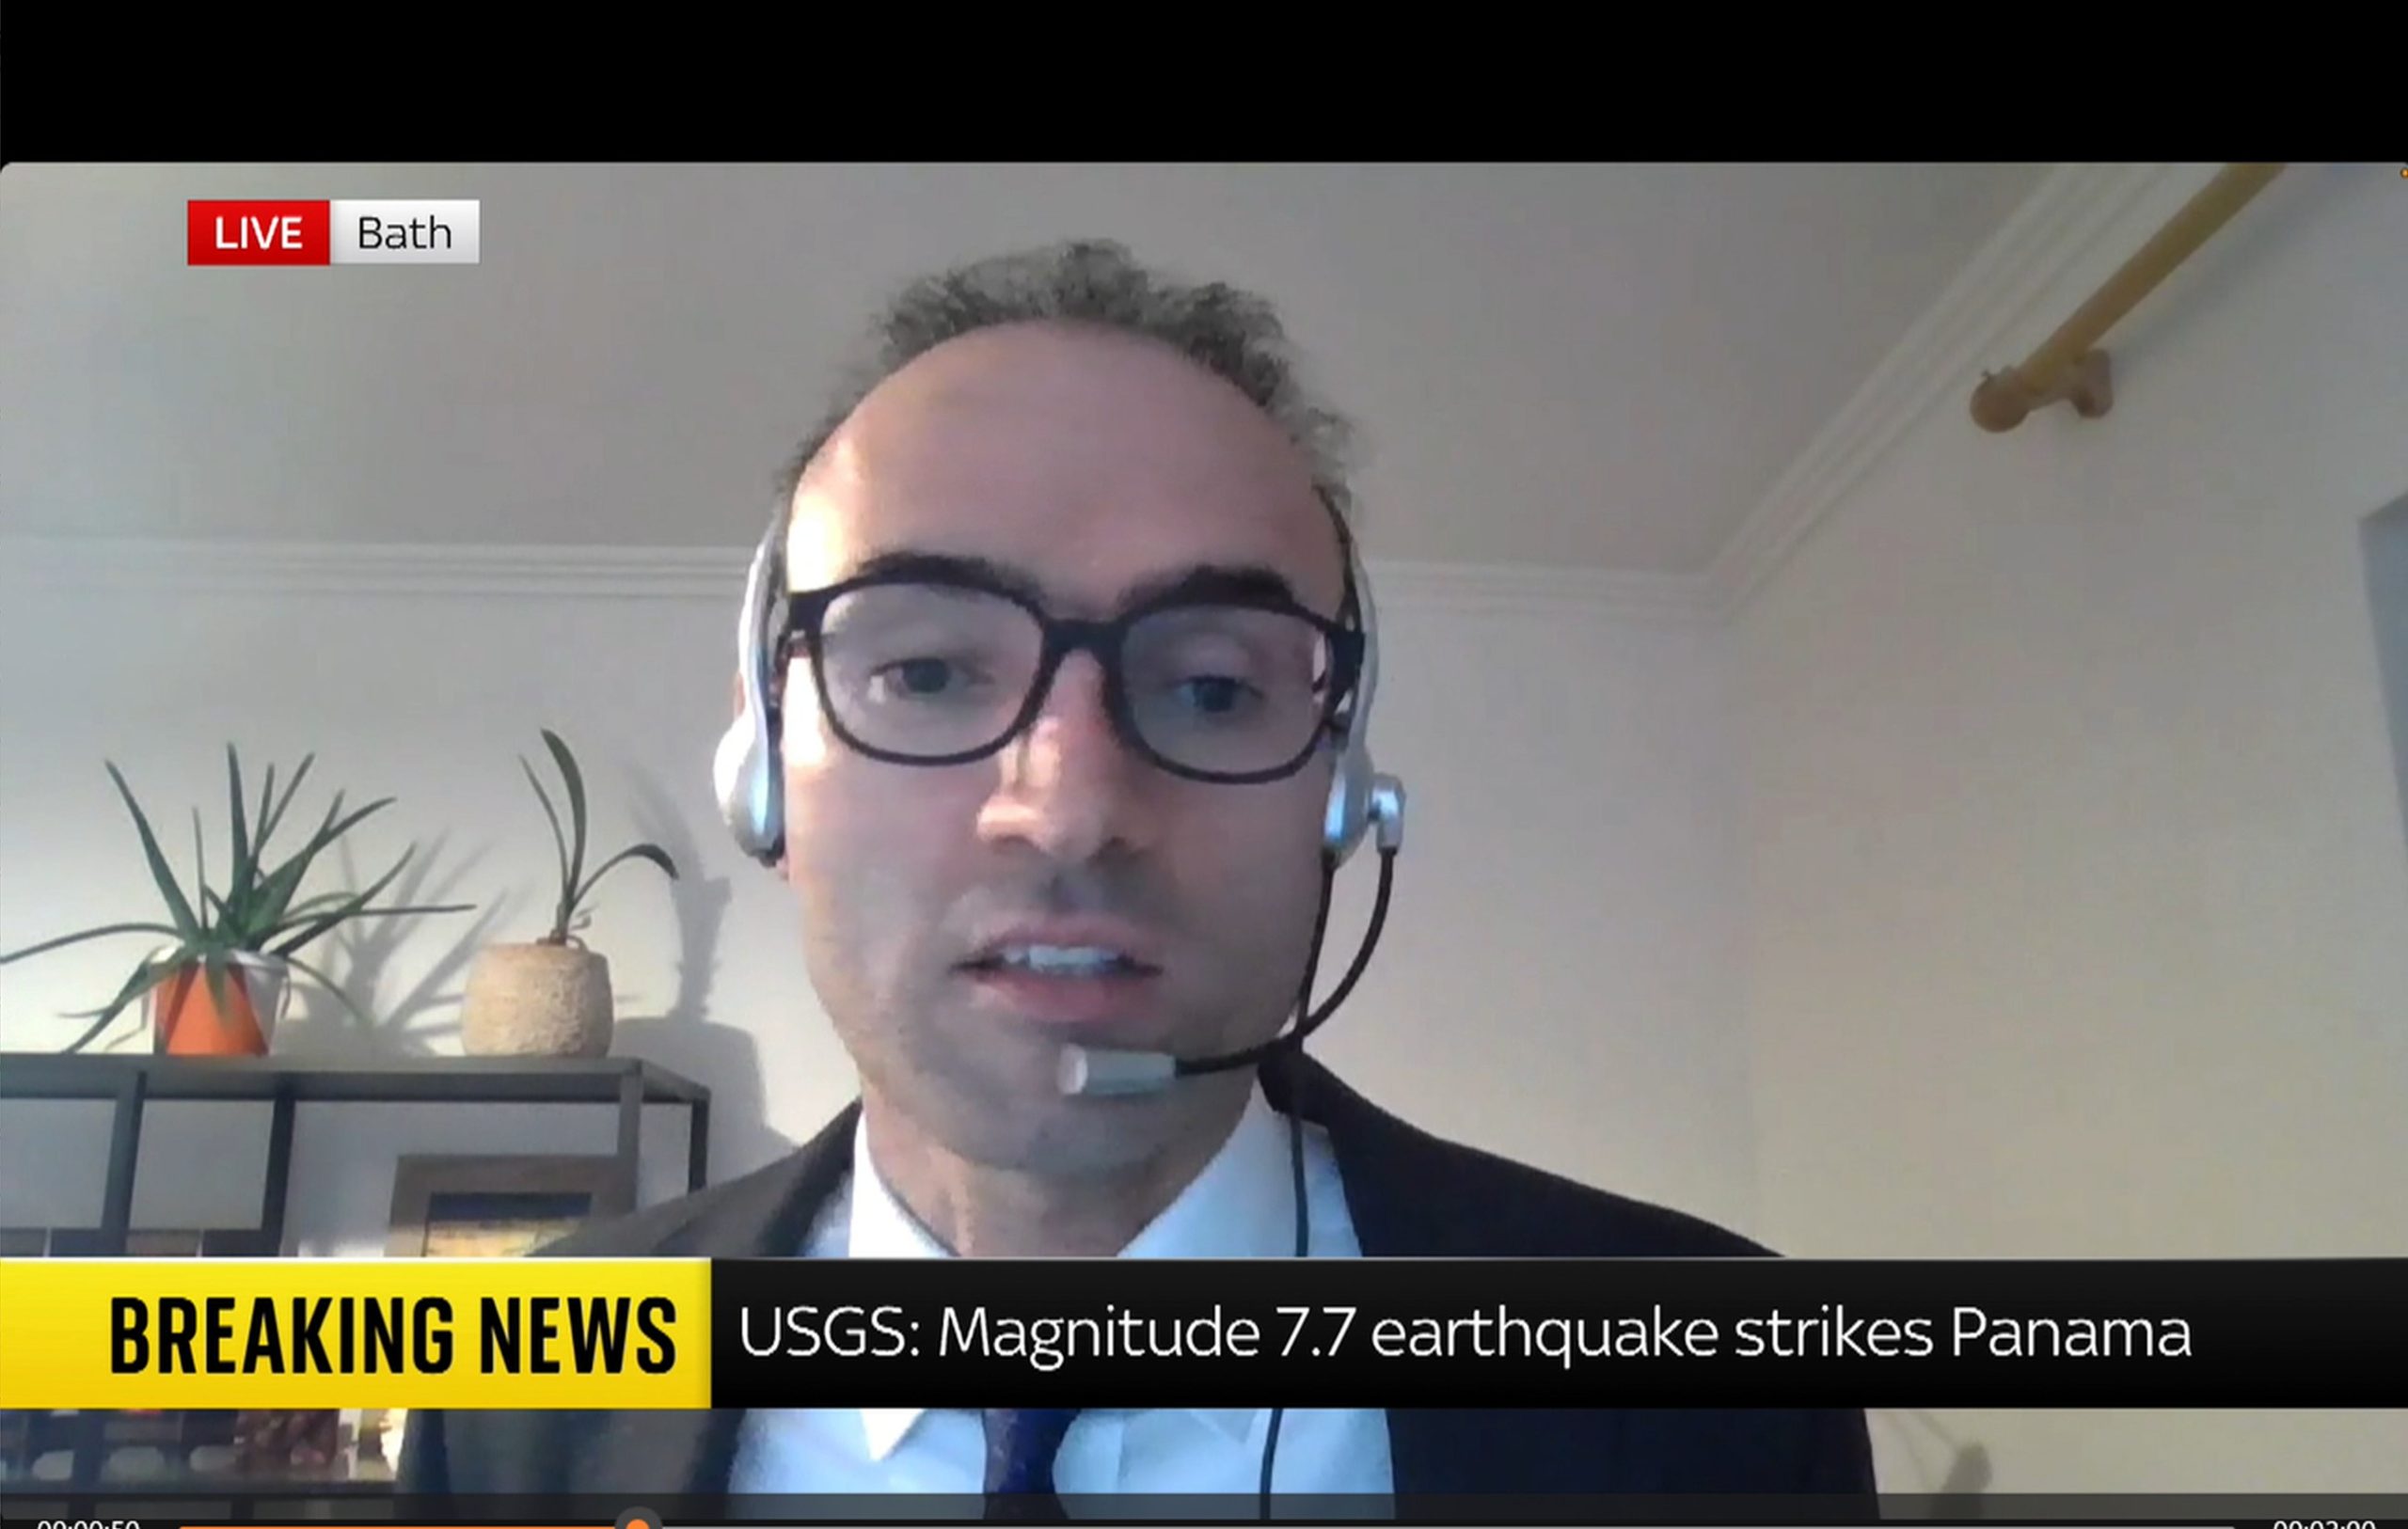
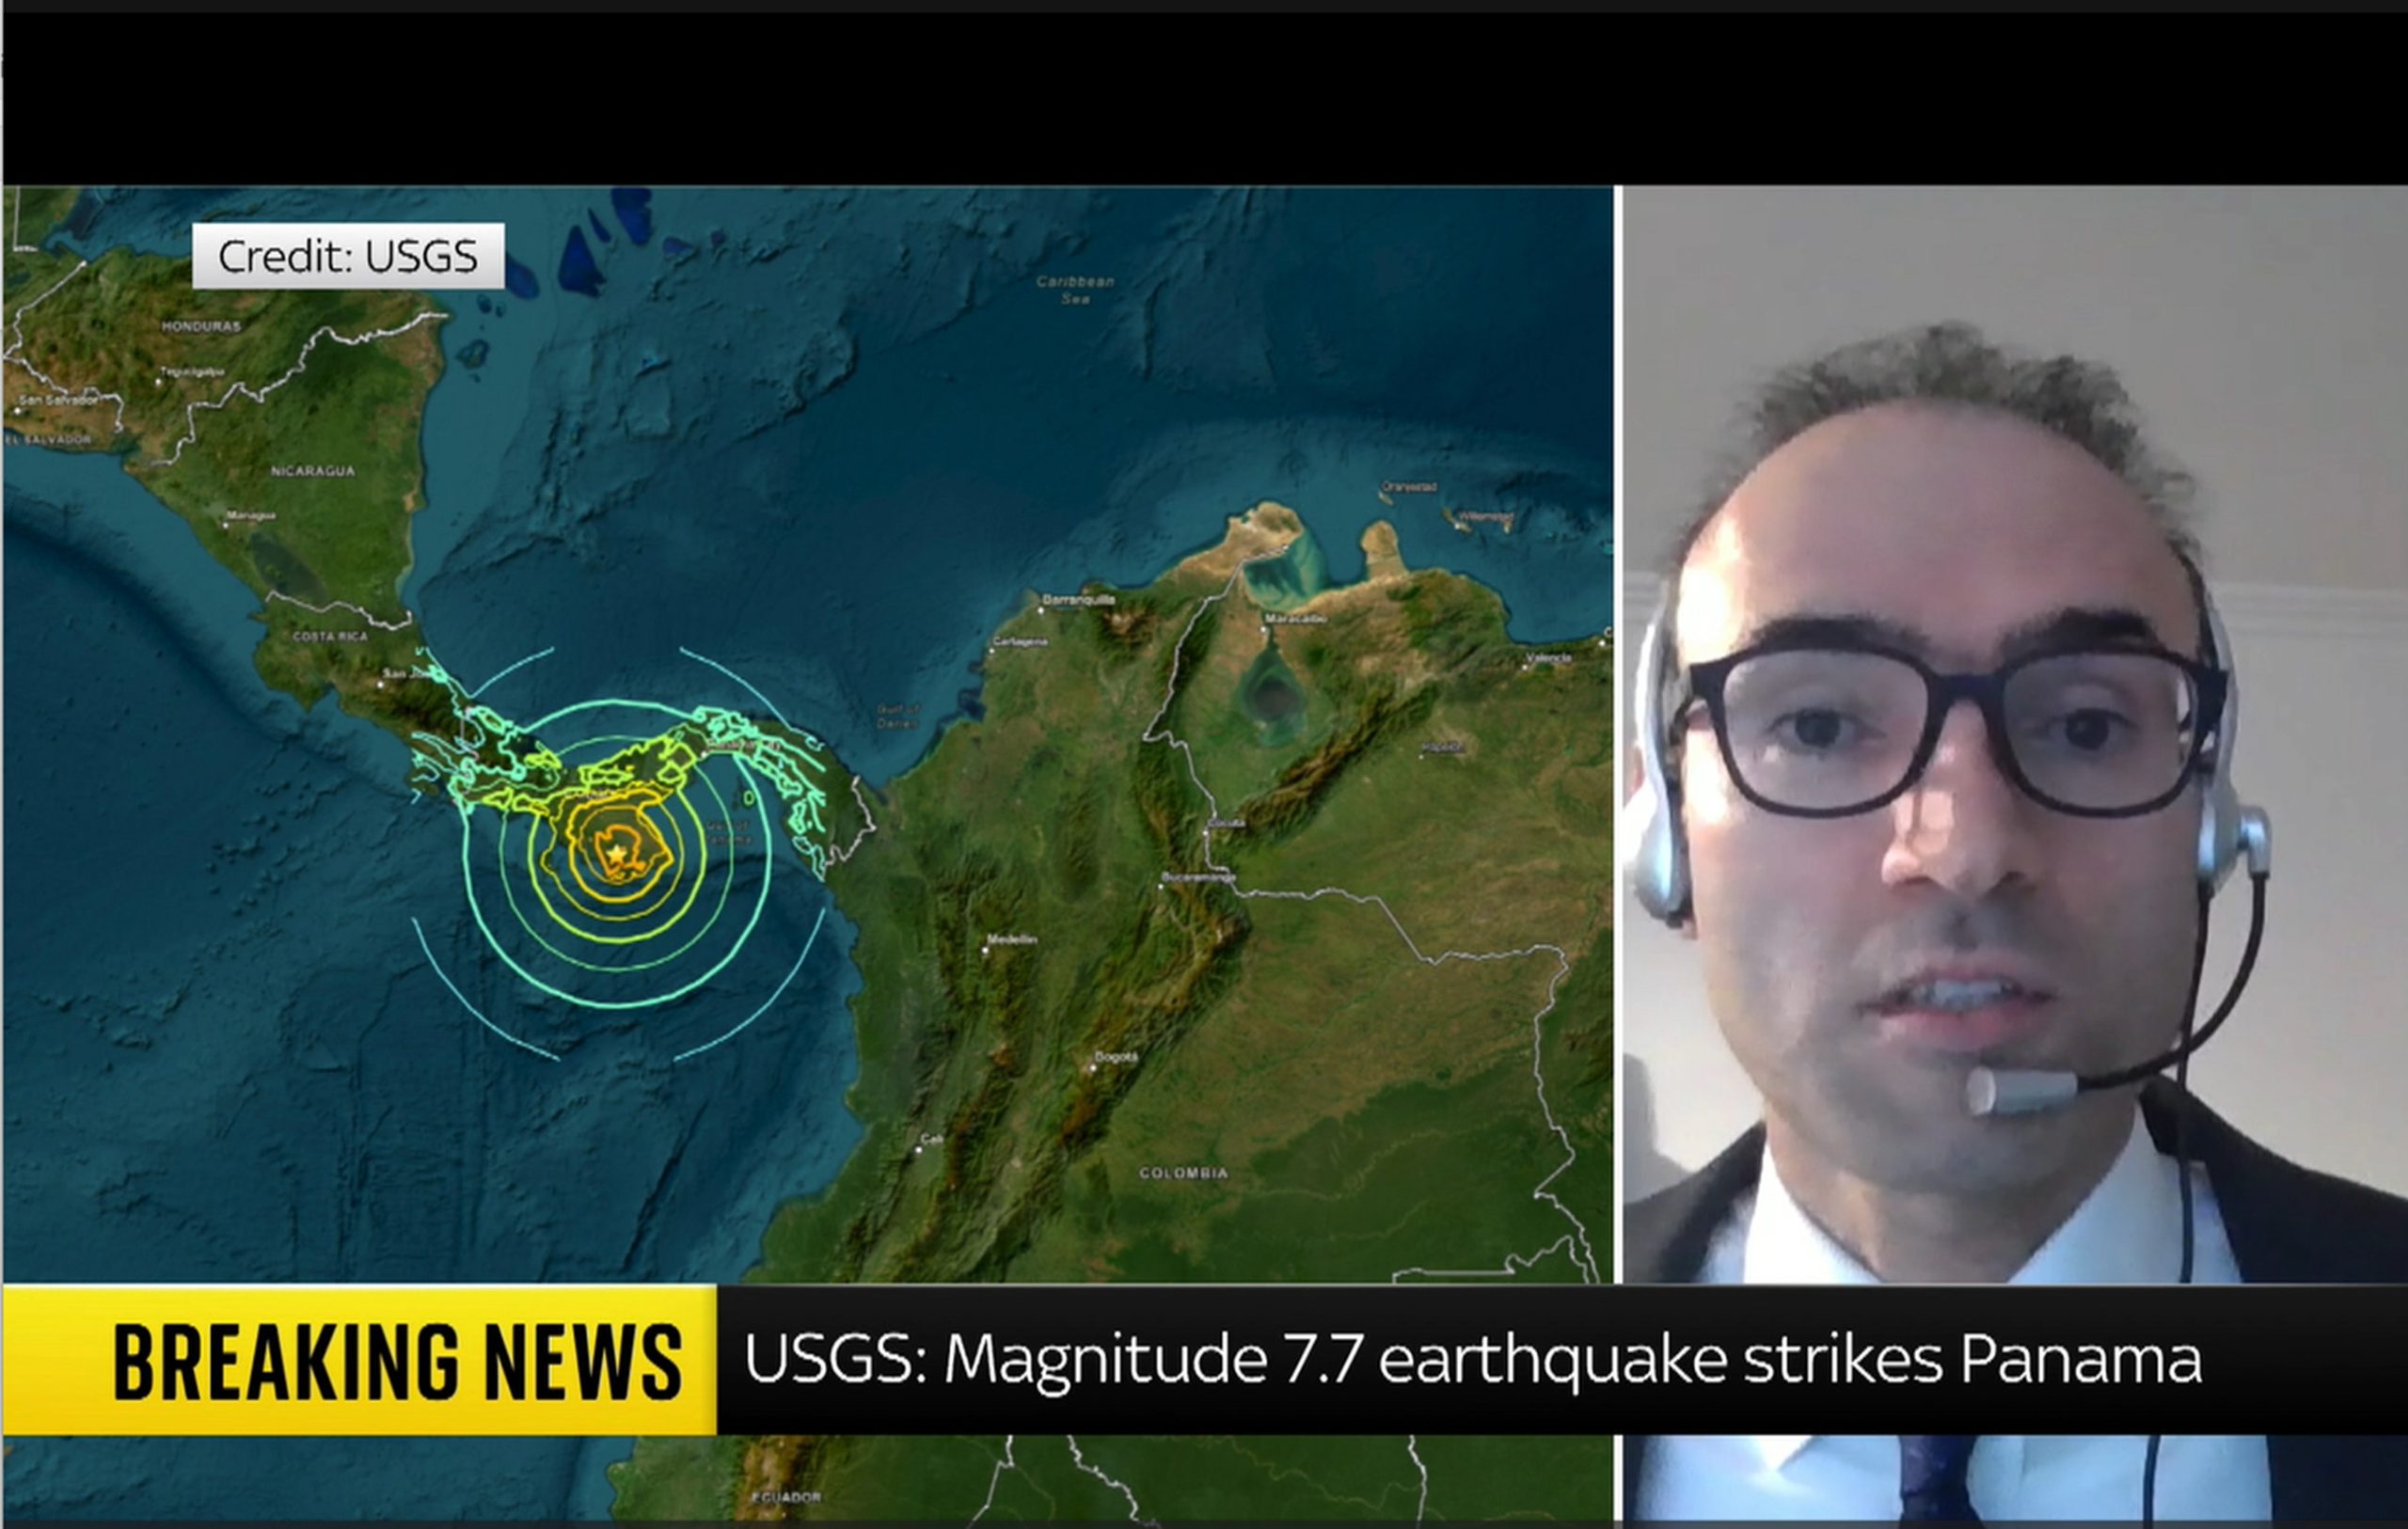
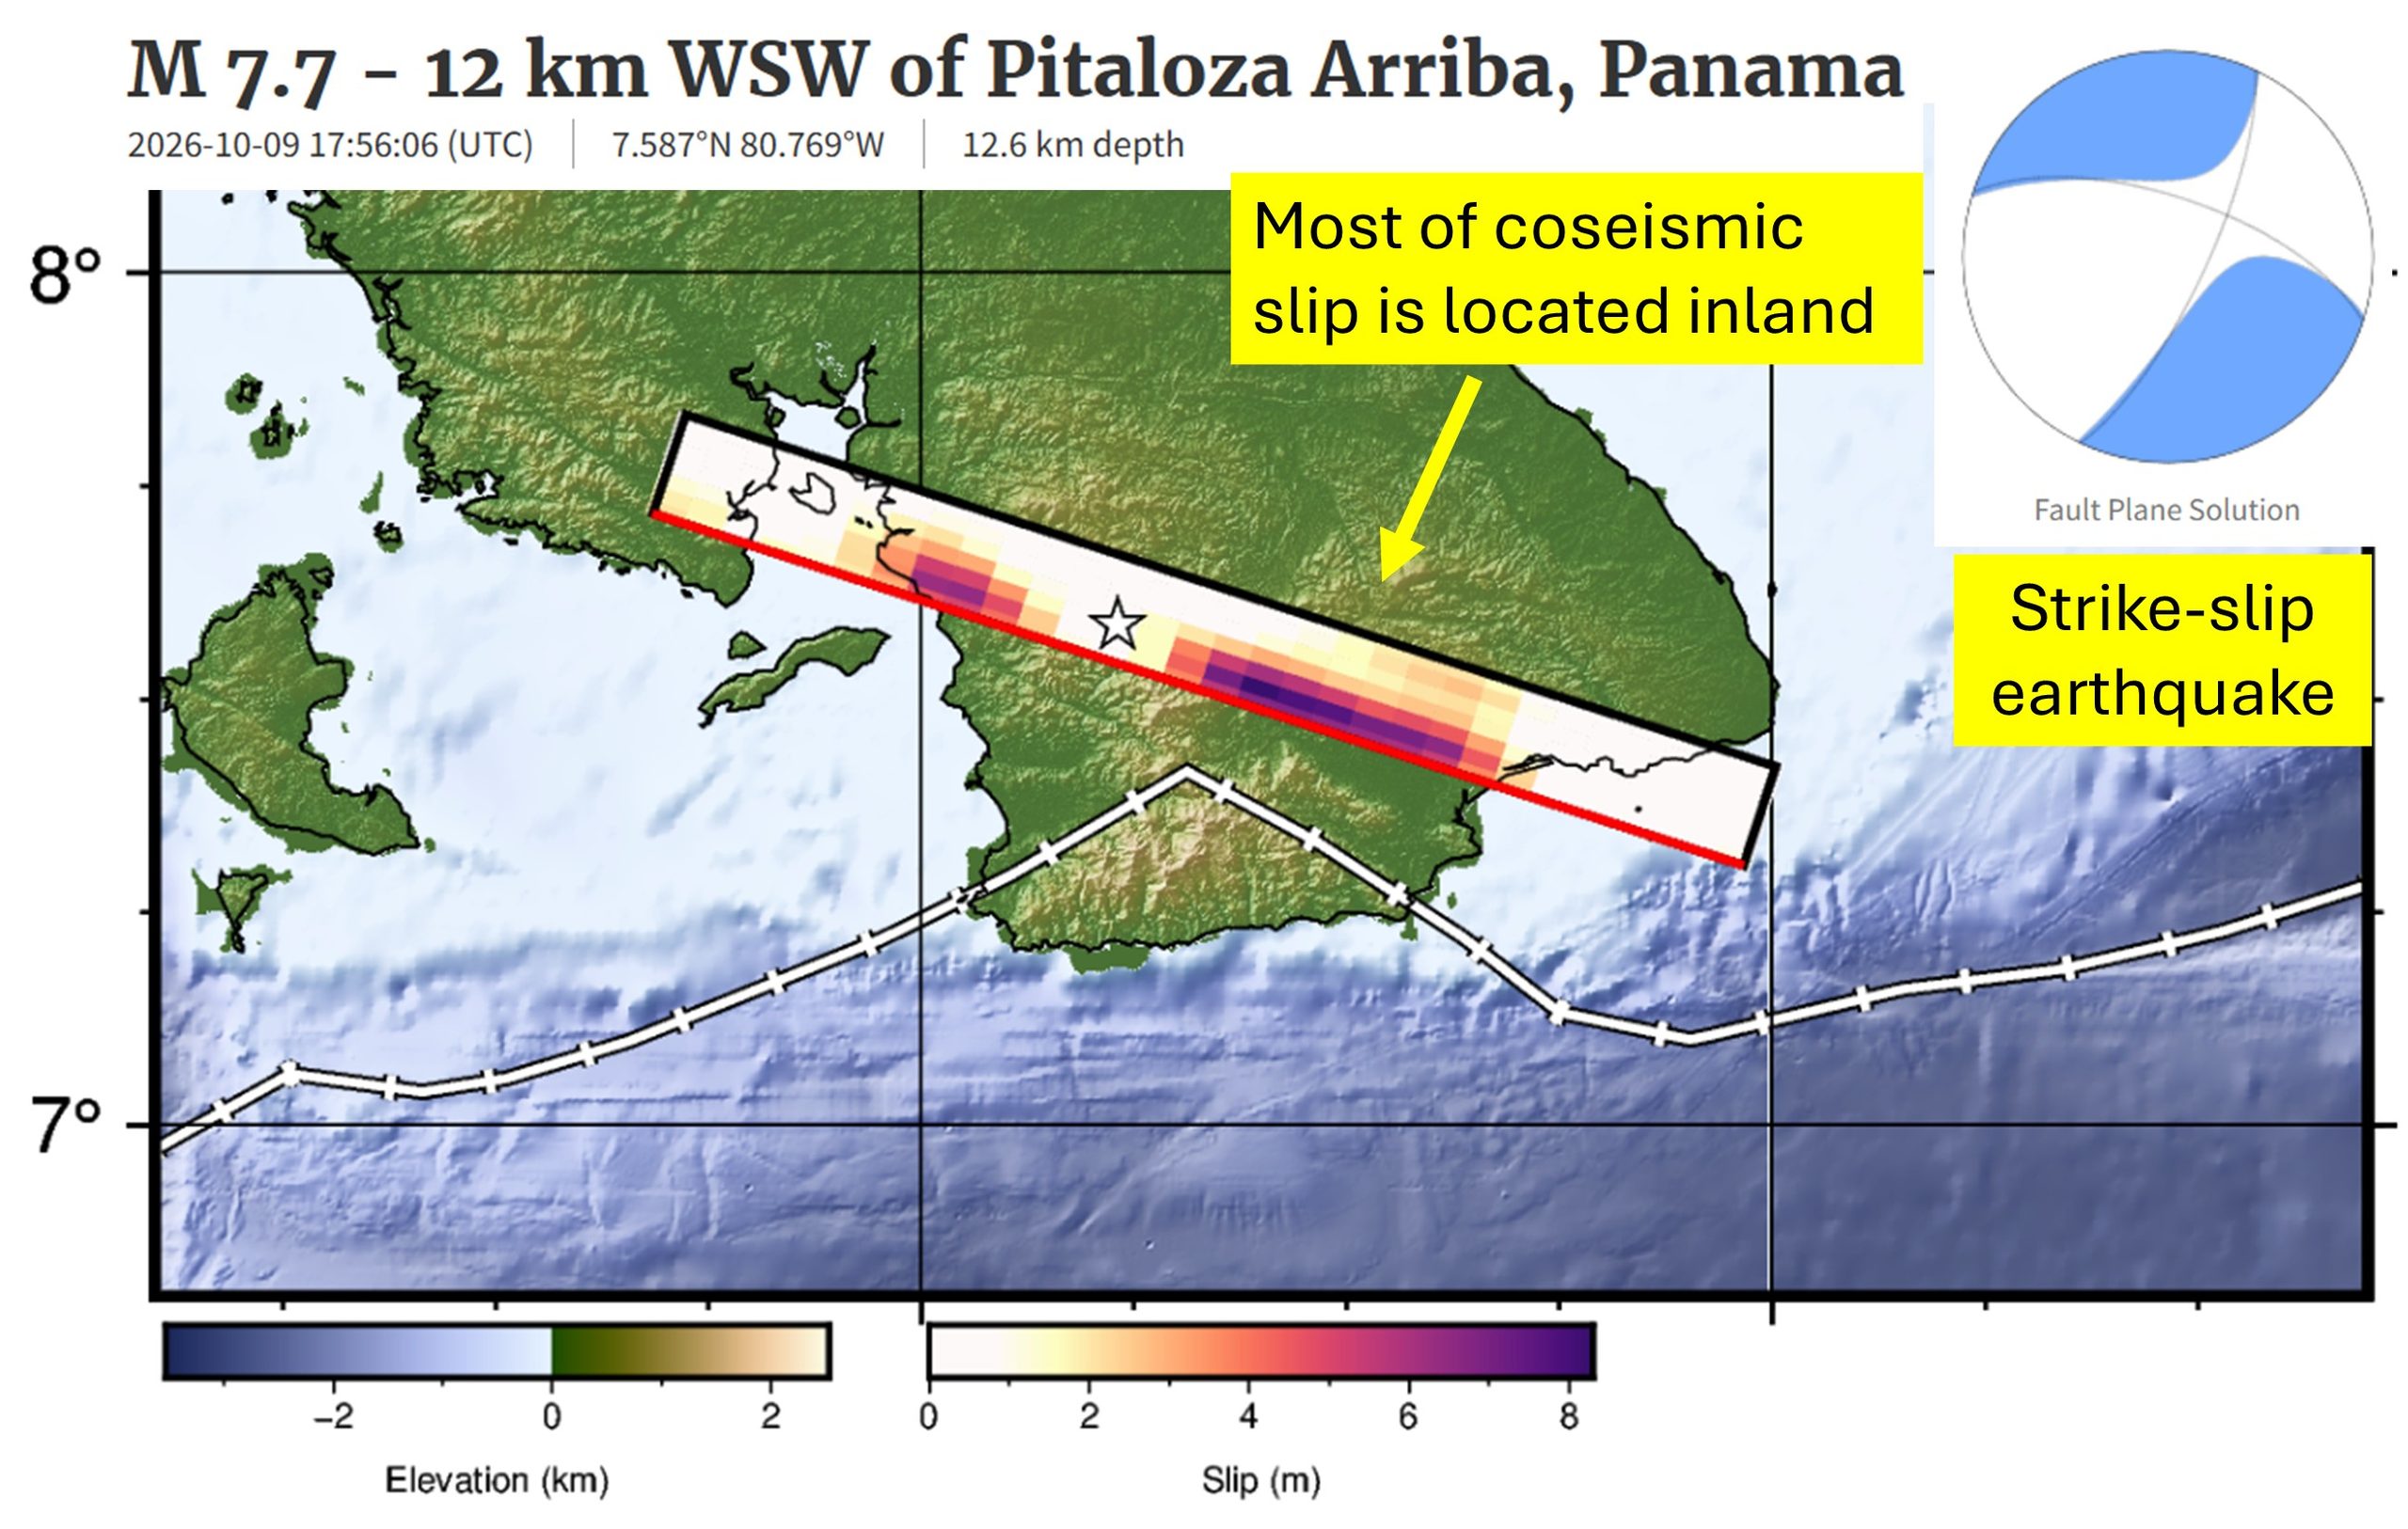
Dr Heidarzadeh’s TV interview with SkyNews on the massive M7.7 Panama earthquake on 9 October 2026
Our ocean is an incredibly vast and mysterious place. And there is no place where that is more evident than the deepest ocean area in the world: the legendary Mariana Trench. Located east of the Philippines, the Mariana Trench lies in the Mariana Archipelago in the western portion of the North Pacific. The greater area of the Mariana Trench Marine National Monument is made up of more than 95,000 square miles of ocean. Beneath these waters lie incredibly complex aggregations of submerged islands and volcanoes … and of course, an astoundingly massive trench.
Dive in with us to have your biggest questions answered about the famed Mariana Trench.
How deep is the Mariana Trench?
The deepest part of the Mariana Trench, known as Challenger Deep, is almost 36,000 feet below the ocean’s surface. For context, Mount Everest is about 29,000 feet above sea level, so the Mariana Trench is about 7,000 feet deeper than Mount Everest is tall. For one more comparison, the RMS Titanic lies at a depth of about 12,500 feet below sea level. The Challenger Deep is in waters nearly three times deeper than this ship’s final resting place.
Due to its enormous size, the Mariana Trench has at times been affectionately nicknamed the Grand Canyon of the ocean. This is certainly a picturesque image, but don’t let the mammoth size of this U.S. national terrestrial park fool you into thinking the Mariana Trench matches its size. The trench’s footprint is estimated to be 120 times larger than the Grand Canyon’s, and to reach the bottom of Challenger Deep, you’d need to descend through almost six Grand Canyons stacked on top of each other before you’d reach the seafloor.
Oh … and did we mention it’s five times wider than it is deep? It’s about 43 miles wide!
What is Challenger Deep, and how long would it take to reach it?
Challenger Deep is the deepest point of the Mariana Trench. Fewer than 30 people have ever journeyed to this area. The trek below the surface is long, dark and time-consuming, and it’s not an expedition considered lightly by scientists and explorers.
The first people to descend into the depths of this area in 1960 were oceanographers Jacques Piccard and Don Walsh, and it took them close to five hours to reach Challenger Deep. Since then, more advanced submersibles have been created, but it still takes two to four hours for modern vessels to reach such depths. For example, explorer and filmmaker James Cameron reached the seafloor in a little more than 2.5 hours in the first documented solo submarine dive to the area, and it took oceanographer Dr. Dawn Wright about four hours in 2022. It is crucial that these submersibles descend slowly and steadily beneath the surface, as the immense water pressure compounds with every mile a submersible descends. Speaking of pressure …
Get Ocean Updates in Your Inbox
Sign up with your email and never miss an update.
What is the water pressure at the bottom of the Mariana Trench?
If you thought the depth of the Mariana Trench was its only jaw-dropping feature, think again. Water pressure is one of the most important factors affecting deep-sea life. In the ocean, pressure increases by one atmosphere for every 33 feet (10 meters) of depth. One atmosphere (a unit of measurement for pressure equivalent to average air pressure at sea level) is equal to about 14.7 pounds per square inch (PSI), which is the approximate standard atmospheric pressure at sea level. If you were to convert atmospheric pressure into weight, one atmosphere is about the weight of a bowling ball. Stay with me, friends.
If a vessel were to dive 2,000 feet below the surface, the pressure would equal that of 60 bowling balls stacked atop every square inch of that submersible. But 60 bowling balls is simply nothing compared to the pressure in the Mariana Trench. The atmospheric pressure at the depths of Challenger Deep is equal to about 16,000 PSI. That pressure is about the same as the weight of an entire full-grown elephant on every square inch of a submersible!
Need a more extreme comparison? If a human were to be placed at the bottom of the Mariana Trench, the pressure would be equal to that of 50 jumbo jets piled on top of a person!
Do any animals live in the Mariana Trench?
The depths of the Mariana Trench come with immense pressure and extreme darkness, but somehow, life finds a way to survive. Organisms that live at an extreme depth, like that of Challenger Deep, have to be highly adapted to low temperatures (typically just above freezing), high pressure and virtually no light at all.
Species found in the depths of the Mariana Trench might look vastly different from animals from other ocean depths because their anatomy has been refined to thrive in harsh conditions. At such great depths, these animals typically depend on chemosynthesis (using nutrient-rich waters being pumped out of hydrothermal vents) or descending detritus (dead matter that has fallen from higher parts of the ocean) for food, such as whale falls. Just a handful of these animals include species of octopuses and squids, sea cucumbers, amphipods, sea jellies, shrimp, sea worms and some wild-looking fish!
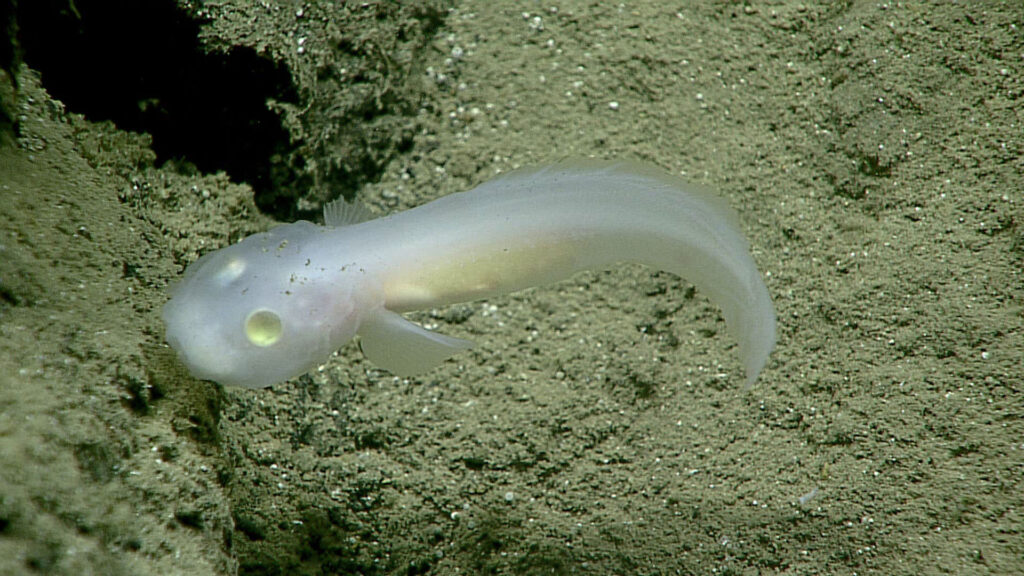
In 2025, more than 7,000 new species were discovered in the Mariana Trench, including the hadal snailfish (Pseudoliparis swirei). This is the deepest-dwelling fish currently known to science. Now, the fish has been dubbed “the Mariana snailfish.”
How was the Mariana Trench formed?
The process by which the Mariana Trench was created is a geologically fascinating one known as subduction. On the Earth’s surface, there are thin plates that cover the planet’s mantle, which is made of molten rock. If two of these plates collide, one pushes down into the Earth’s mantle while the other is pushed over the bottom plate. When this happens, a trench is formed from the drag of the bottom plate. This process can sometimes create incredibly strong earthquakes. The plates that forged the Mariana Trench’s creation are estimated to be up to approximately 180 million years old.
This trench was unknown to scientists until 1875. It was then that a team of explorers on the HMS Challenger measured the depth of the sea by simply lowering a weighted rope into the water. They were baffled when they measured that first portion of the seafloor to be five miles below the surface. And so was born the origin of some of the most daring deep-sea explorations known to mankind to date.
Is the Mariana Trench protected?
The Mariana Trench is in waters off Guam and the Mariana Islands. The region is protected from some human activities under its status as a marine monument. The creation of the Mariana Trench Marine National Monument signified that international, national and local leaders all recognize the importance of protecting this area.
However, just because the region is protected does not mean it’s not vulnerable to modern threats to ocean health. Plastic bags have been spotted in the Mariana Trench during several expeditions, highlighting the far-reaching impact of the marine debris problem. No corner of our ocean is safe from the ever-present threat of plastic pollution. The reality of a changing climate makes the future well-being of wondrous places like the Mariana Trench uncertain. What’s more: More than 70% of the global ocean has yet to be mapped. And what we don’t yet know about, we cannot wisely work to protect.
It’s up to us to work together to defend our ocean, from the sandy shores of our favorite beaches to the deepest, darkest parts of the sea. Together, we can work to protect our ocean as a whole, which ultimately helps protect treasured places like Challenger Deep.
Find out how you can join Ocean Conservancy’s wave of momentum to secure a healthy ocean and a thriving planet, forever and for everyone!
The post The Mysteries of the Mariana Trench appeared first on