

As FIFA prepares for its upcoming World Cup tournaments from June 11 to July 19, 2026, its climate strategy is facing closer attention, too. The organization has set a goal to reach net zero emissions by 2040. It also aims to cut emissions by 50% by 2030.
These targets are part of FIFA’s long-term sustainability plan, which aligns with the UN Sports for Climate Action Framework and the Paris Agreement. FIFA first announced its climate strategy in 2021 and has since applied it across major tournaments.
However, the challenge is not setting targets. The real challenge is reducing emissions in a global event that depends on international travel. The World Cup is one of the most complex events to decarbonize because most emissions come from sources outside direct control.
FIFA’s Climate Commitments and Official Emissions Targets
FIFA’s climate strategy follows a structured pathway based on global climate standards. It includes measuring emissions, reducing them where possible, and offsetting what remains.
The organization has committed to three main actions:
- Reduce greenhouse gas emissions by 50% by 2030.
- Achieve net zero emissions by 2040.
- Align operations with international climate frameworks.
FIFA reports emissions using standard greenhouse gas accounting. This includes tracking emissions across tournaments, host cities, and operational activities.
In past tournaments, FIFA has introduced sustainability measures such as energy-efficient stadiums, waste reduction programs, and public transport planning. For example, several recent World Cup venues have used renewable electricity and modern cooling systems to reduce energy demand.
FIFA also works with host countries to improve infrastructure planning. This includes encouraging the use of existing stadiums and limiting new construction where possible. These steps aim to reduce emissions linked to building materials and long-term infrastructure.
Still, these efforts mainly affect operational emissions. The larger challenge lies beyond stadiums and facilities.
How Emissions Are Measured in the World Cup
FIFA measures emissions using the widely accepted Scope 1, Scope 2, and Scope 3 framework.
Scope 1 emissions come from direct sources such as fuel use in vehicles and on-site operations. Scope 2 emissions come from purchased electricity used in stadiums and facilities. These emissions can be reduced through renewable energy and efficiency improvements.
Scope 3 emissions include all indirect emissions linked to the event. These are the most complex and the largest category.
In the World Cup, Scope 3 emissions come from these sources:
- International and domestic travel by fans,
- Team and staff transportation,
- Accommodation and hospitality services,
- Supply chains and merchandise production, and
- Broadcasting and logistics operations.
In large global events, Scope 3 emissions often account for more than half of total emissions. The share is even higher due to the scale of international travel in football tournaments.
This structure shows that most emissions do not come from FIFA’s direct operations. They come from the wider system that supports the event.
By the Numbers: Inside the 3.7M Ton Carbon Footprint of 2026 World Cup
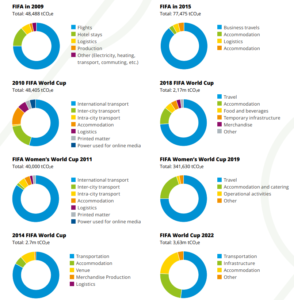
The FIFA World Cup is one of the largest global sporting events. The 2022 tournament in Qatar drew over 3.4 million spectators, according to FIFA, and reached billions of viewers worldwide. This level of participation creates a large environmental footprint.
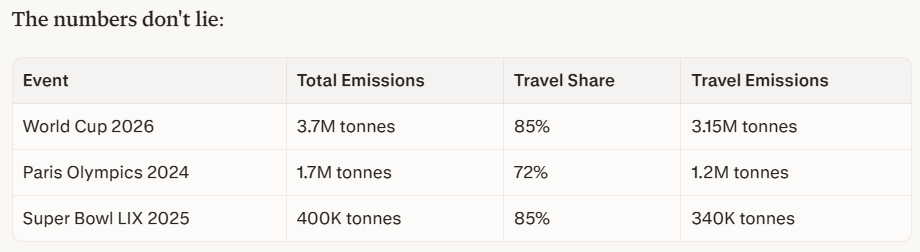
For the 2026 FIFA World Cup, hosted by the United States, Canada, and Mexico, total emissions are projected at around 3.7 million tonnes of CO₂ equivalent (CO₂e). This estimate comes from the United 2026 bid’s environmental impact assessment. It reflects the full lifecycle footprint of the event, including travel, operations, and infrastructure.
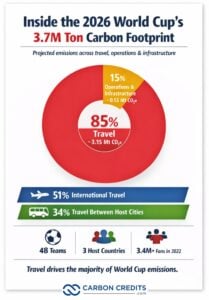
Transportation is the main driver of these emissions. About 85% of total emissions are linked to travel, especially air travel. This includes both international flights and travel between host cities.
The scale of the 2026 tournament adds to this challenge. It will feature 48 teams, up from 32 in previous editions, and will span multiple countries and cities. This increases travel demand, distances between matches, and overall logistics complexity.
The structure of emissions can be summarized as follows:
- ~85% from travel-related activities (~3.15 million tonnes CO₂e)
- ~15% from operations, energy use, and infrastructure (~0.55 million tonnes CO₂e)
Travel emissions alone include:
- 51% from international journeys
- 34% from travel between host cities
Compared with more compact tournaments, this format leads to higher emissions due to increased reliance on long-distance flights.
Scope 3 Emissions: The Core Climate Challenge
The emissions profile of the World Cup highlights a clear imbalance. Most emissions fall under Scope 3, which includes indirect sources such as travel, logistics, and supply chains.
Scope 1 and Scope 2 emissions, which cover direct operations and energy use, represent only a small share of the total footprint. These can be reduced through renewable energy and efficient design.
Scope 3 emissions are different. They come from activities outside FIFA’s direct control. These include fan travel, team transport, global logistics, and services linked to the event. This creates a structural challenge. Even if FIFA reduces emissions from stadiums and operations, total emissions can remain high due to travel demand.

- In simple terms, the World Cup’s carbon footprint is driven more by movement than by infrastructure.
Scope 3 is also the hardest category to reduce. It depends on global travel patterns, geography, and individual choices. FIFA cannot fully control how fans travel or how often they move between cities.
This is why Scope 3 emissions are central to the climate challenge. They account for the largest share of emissions and the biggest barrier to reducing the World Cup’s overall footprint.
Cuts vs. Credits: The Ongoing Offset Debate
To meet its climate targets, FIFA uses both emissions reduction and carbon offsetting. Reduction focuses on lowering emissions at source. This includes improving energy efficiency, using renewable electricity, and optimizing event operations.
Offsetting is used to balance emissions that cannot be eliminated. This involves investing in projects that reduce or remove carbon emissions elsewhere.
FIFA’s approach includes:
- Reducing energy use in stadiums and facilities,
- Increasing the use of renewable electricity, and
- Supporting carbon offset projects for remaining emissions.
Carbon offsets can include projects such as reforestation, renewable energy development, and carbon capture. However, their effectiveness depends on project quality, verification, and long-term impact.
This has led to debate in climate policy. Some experts argue that offsets should not replace real emissions reduction. Others point out that offsets can support the transition when used carefully.
The key issue is transparency. Clear reporting and verified data are needed to ensure that net-zero claims reflect real outcomes.
Why Net Zero Is Difficult for Mega Sports Events
Mega sporting events like the World Cup have unique challenges. They are temporary, global, and highly mobile. Their emissions come from:
- International travel,
- Temporary infrastructure,
- Large-scale logistics, and
- Global audience participation.
Even with strong sustainability measures, these factors create a high baseline of emissions.
Take for example, the Paris 2024 Olympics. The event’s total footprint hit 1.7 million tonnes CO₂e. Travel caused 72%, that’s 1.2 million tonnes, from 720,000+ international visitors. Stadiums run on 100% renewables, but aviation emissions? Untouched.
Super Bowl LIX in 2025 told the same story. The event generated 400,000 tonnes CO₂e, with 85% coming from 150,000+ out-of-state fans flying to New Orleans. The NFL bought 400,000 offsets for carbon-neutral claims. Still, travel cuts? Zero.
This pattern is industry-wide. Organizers control stadium power. Fans control flights. These mega-events lean on offsets, not aviation reductions. FIFA faces the same problem that other organizers couldn’t easily resolve.
Thus, decarbonization becomes more complex. It also means progress may be slower compared to sectors with more direct control over emissions.
What a Credible Net Zero World Cup Requires
For FIFA’s net-zero goals to be credible, several conditions need to be met.
- Emissions must be clearly measured and reported across all scopes. This includes full disclosure of total emissions before offsets are applied. Transparency is essential for trust.
- There must also be a stronger focus on reducing emissions at source. While offsets can play a role, long-term progress depends on real reductions.
- Independent verification of emissions data can improve credibility. Better coordination of travel and logistics can also help reduce unnecessary emissions.
- In the long term, advances in low-carbon transport, including sustainable aviation fuels, may help reduce travel-related emissions.
Final Whistle: Can FIFA Turn Climate Targets Into Reality?
FIFA has set clear climate targets, including net zero emissions by 2040. These targets reflect growing pressure on global organizations to reduce their environmental impact.
However, the data shows a clear challenge. Most emissions from the World Cup come from indirect sources, especially global travel. Scope 3 emissions dominate the total footprint and remain difficult to control. This makes them the key factor in any net-zero strategy.
As the World Cup continues to grow in scale, emissions challenges will also increase. Operational improvements can reduce part of the impact, but they cannot fully address the larger system.
The future of football’s climate strategy will depend on how this gap is managed. The goal is not only to set targets, but also to achieve measurable and transparent progress in a global, complex system.
In this field, will FIFA lead or lag? We will watch this space closely.
The post FIFA World Cup and the 3.7 Million-Tonne Problem: Can Football’s Biggest Event Reduce Its Climate Impact? appeared first on Carbon Credits.
The World’s Biggest Game Is Coming
Every four years, the world stops to watch football. Billions of fans tune in, millions travel, and for a few glorious weeks the sport unites people across language, culture, and geography in ways almost nothing else can.
The 2026 FIFA World Cup is set to be the most ambitious tournament in the history of the sport. For the first time ever, 48 national teams will compete across 16 host cities in three countries: the United States, Canada, and Mexico. From Atlanta to Toronto, from Guadalajara to New York, the tournament will span an entire continent and draw an estimated five to six million visitors.
That scale is extraordinary. It is also an invitation.
When an event this large takes shape, its environmental footprint grows alongside it. More teams mean more matches. More host cities mean more travel. More fans mean more flights, more hotel stays, more food, and more waste. But scale also means influence, and that is exactly where the opportunity lies.
The 2026 World Cup arrives at a moment when awareness of climate responsibility is higher than it has ever been. Fans, sponsors, cities, and governing bodies are increasingly asking: how do we celebrate something we love while taking better care of the planet we share? The good news is that the answer is not about sacrifice. It is about small, intentional choices made by millions of people acting together.
This article breaks down the environmental footprint of the tournament, explains what FIFA and host cities are doing to reduce it, and offers practical ways for every fan to participate in something bigger than the beautiful game itself.
What Is the Environmental Impact of the 2026 FIFA World Cup?
Quick Answer: The 2026 FIFA World Cup will generate greenhouse gas emissions through international and domestic air travel, ground transportation, hotel stays, stadium operations, food and beverage consumption, and event logistics. Fan travel, especially long-haul flights, typically represents the largest share of a major sporting event’s total carbon footprint.
A tournament the size of the World Cup generates emissions across nearly every category of human activity. Understanding where those emissions come from is the first step toward reducing them.
The primary sources of World Cup emissions include:
- International flights: Fans traveling from Europe, Asia, South America, Africa, and beyond generate significant aviation emissions. Long-haul flights are among the most carbon-intensive activities an individual can undertake.
- Domestic flights: With 16 host cities spread across three countries, fans attending multiple matches will likely fly between venues within North America.
- Ground transportation: Rental cars, taxis, rideshares, and buses connecting airports to stadiums and hotels all add to the overall footprint.
- Hotel stays: Millions of nights of lodging consume electricity, water, and heating and cooling energy at scale.
- Stadium operations: Lighting, cooling, sound systems, and food service at each venue require significant energy.
- Food and beverage: Catering at scale, with meat-heavy menus and single-use packaging, contributes both direct emissions and substantial waste.
- Event logistics: Equipment transport, broadcasting infrastructure, and official travel all factor in.
No single estimate exists yet for the 2026 tournament’s total footprint, but context from past events is instructive. FIFA’s own sustainability reports acknowledge that major tournaments generate hundreds of thousands to millions of metric tons of CO2-equivalent emissions when fan travel is included. The 2022 FIFA World Cup in Qatar drew considerable scrutiny for its construction-related emissions and for the long-haul flights required to reach a single Middle Eastern host nation.
The 2026 tournament’s multi-country, multi-city format presents different challenges and, importantly, different opportunities.
Why Sports Matter in the Fight Against Climate Change
Quick Answer: Global sporting events like the World Cup reach billions of people and have a unique power to inspire behavior change at scale. That makes them one of the most important platforms for communicating and normalizing climate-conscious choices.
Sport occupies a rare space in public life. It commands attention from people who may not read policy papers, follow environmental news, or consider themselves particularly engaged with climate issues. A single World Cup final draws a television audience measured in the hundreds of millions. That kind of reach is genuinely extraordinary.
The United Nations Sports for Climate Action Framework, launched in 2018, recognizes this explicitly. The framework calls on sports organizations to use their platforms to raise awareness, reduce their own emissions, and inspire broader action among fans and communities. As of 2024, more than 300 sports organizations have signed on, including national football associations and major leagues across multiple disciplines.
When sports organizations commit to climate action, they do not just reduce their own footprint. They send a signal to fans, sponsors, broadcasters, and host cities that sustainability is a shared priority. When a stadium installs solar panels, it normalizes renewable energy. When a league actively promotes public transit, it makes that choice feel obvious rather than inconvenient. When a tournament takes accountability for its unavoidable emissions, it shows that responsibility is possible even at enormous scale.
The 2026 World Cup has the potential to reach more people with that message than almost any other platform on earth.

Why Transportation Is the Largest Source of Emissions
Quick Answer: Transportation, especially aviation, typically accounts for the majority of a major sporting event’s total carbon footprint. It involves millions of individuals making high-emission journeys that are genuinely difficult to avoid or replace with lower-carbon alternatives today.
When sustainability researchers analyze the footprint of a mega sporting event, one category consistently dominates: how people get there.
Aviation is among the most carbon-intensive modes of travel per mile. A single round-trip transatlantic flight, say from London to New York, generates roughly 1 to 1.5 metric tons of CO2-equivalent per passenger depending on the aircraft, seat class, and routing. For a fan flying from Buenos Aires or Tokyo, that figure climbs considerably higher.
The 2026 World Cup will draw fans from every continent. Many will travel internationally. Some will attend matches in multiple cities and need additional domestic flights between venues. Ground transportation adds further emissions once fans arrive at each destination.
Hotels come in as the second major source. With millions of visitors needing accommodation across dozens of cities over several weeks, the aggregate energy consumption of lodging is substantial.
This concentration of travel-related emissions is why transportation is the category most often targeted by sustainability strategies at major events. It is also the area where individual fan choices can have the most meaningful real-world impact.
Existing Stadiums Help Reduce Environmental Impact
Quick Answer: Most 2026 World Cup venues are existing stadiums, which significantly reduces the construction-related emissions that have contributed to the environmental footprint of past tournaments.
One of the most meaningful and often underappreciated sustainability advantages of the 2026 World Cup is the decision to use venues that are largely already built.
Stadium construction is enormously carbon-intensive. Concrete, steel, and the energy required to assemble them at scale contribute millions of metric tons of emissions before a single match is played. Using existing infrastructure eliminates that category of impact from the outset.
Many 2026 host venues, including AT&T Stadium in Arlington, MetLife Stadium in New Jersey, Levi’s Stadium in Santa Clara, and SoFi Stadium in Los Angeles, are large, established facilities with existing transportation connections, utilities, and operational infrastructure. Similar existing stadiums anchor the schedule in Canada and Mexico.
Host cities are also using the tournament as an opportunity to invest in improvements that will benefit communities long after the final whistle:
- Public transit expansions: Several host cities are upgrading rail and bus infrastructure to handle increased tournament traffic. Those improvements will remain useful to residents for decades.
- Renewable energy integration: Some venues are increasing their use of solar, wind, and other clean energy sources in preparation for the event.
- Waste diversion programs: Enhanced composting, recycling, and single-use plastic reduction efforts are being built into venue operations.
- Water conservation: Stadiums in drier climates are adopting more efficient irrigation and water management systems.
None of this erases the footprint of the event entirely. But it does mean the 2026 World Cup is starting from a more sustainable foundation than tournaments that required massive new construction.

FIFA’s Sustainability Strategy
Quick Answer: FIFA has developed a Sustainability and Human Rights Strategy that includes environmental commitments around emissions reduction, responsible sourcing, and legacy planning for host communities. Independent oversight and third-party verification remain important to ensuring those commitments translate into real outcomes.
FIFA’s approach to sustainability has evolved meaningfully over the past decade. The organization’s current Sustainability and Human Rights Strategy covers several interconnected areas.
On the environmental side, FIFA has committed to reducing greenhouse gas emissions across its operations, promoting sustainable venue management, and encouraging host nations to integrate sustainability into their planning. The strategy also addresses responsible procurement, supply chain transparency, and waste reduction.
Legacy planning sits at the center of the framework. FIFA works with host cities and nations to ensure that infrastructure investments, community programs, and environmental improvements outlast the tournament itself. The goal is that hosting the World Cup leaves communities measurably better off, with improved transit, upgraded facilities, and stronger environmental standards.
It is worth noting that large international sports organizations operate under significant public scrutiny, and sustainability commitments are most meaningful when supported by independent verification and transparent reporting. Fans and stakeholders are right to ask for accountability alongside ambition.
For the full details of FIFA’s approach, readers can consult the official FIFA Sustainability and Human Rights Strategy and the associated FIFA World Cup 26 sustainability documentation.
How Fans Can Reduce Their Carbon Footprint
Quick Answer: Fans attending or following the 2026 World Cup can reduce their environmental impact by choosing lower-carbon transportation, staying in sustainable accommodations, reducing waste at venues, and offsetting unavoidable emissions through verified carbon offset programs.
The most powerful lever in World Cup sustainability is not a stadium design or a transit system. It is the combined weight of millions of individual choices made by fans who care.
Here is a practical guide to making yours count:
Getting There
- Choose direct flights when possible. Takeoffs and landings are the most fuel-intensive parts of any flight, so fewer of them means less fuel burned.
- Consider train travel for shorter distances between host cities, particularly in the U.S. Northeast corridor or within Mexico.
- Use public transit from the airport to your hotel and to the stadium. Most host cities have rail and bus connections to venues, and several are expanding those networks specifically for the tournament.
- If you need to rent a car, opt for an electric or hybrid vehicle.
- Share rides with other fans when driving is unavoidable.
At the Hotel
- Book accommodations that have earned recognized green certifications. Look for LEED, Green Key, or similar credentials as a starting point.
- Reuse towels and linens, take shorter showers, and turn off lights and air conditioning when you leave the room.
- Choose hotels within walking or transit distance of the stadium rather than driving in from farther away.
At the Match
- Bring a reusable water bottle. Many venues will have refill stations available.
- Choose plant-based food options when they are available. Food production is a meaningful contributor to greenhouse gas emissions, and the menu choices of millions of fans add up.
- Use the designated recycling and composting bins at the venue.
- Skip single-use plastics wherever an alternative is offered.
Supporting Local Communities
- Eat at locally owned restaurants rather than large international chains. This keeps economic benefits inside the host community and typically means shorter, less emissions-heavy food supply chains.
- Buy souvenirs from local artisans and makers.
- Be a thoughtful guest in every host city you visit.
Offsetting What You Cannot Eliminate
- Calculate your travel emissions using the Terrapass Carbon Footprint Calculator and balance the portion of your footprint you could not reduce by purchasing carbon credits that support verified climate projects.
What Are Carbon Credits?
Quick Answer: Climate projects are basically carbon reduction factories. They generate one carbon credit every time they reduce or remove one metric ton of CO2-equivalent (CO2e) greenhouse gas emissions from the atmosphere. Individuals and organizations can compensate for their own emissions by purchasing an equivalent amount of carbon credits that fund projects for reducing CO2e.
Carbon offsetting works by balancing the emissions generated in one place with emissions reduced by climate projects somewhere else. When you purchase a carbon credit, you are funding projects that restore and protect nature, accelerate decarbonization, and remove carbon from the atmosphere.
Common types of carbon projects include:
- Forestry and land conservation: Protecting and restoring forests that would otherwise be logged prevents the release of the carbon stored in trees and soil.
- Renewable energy: Projects that build wind, solar, or small hydro capacity in regions that would otherwise rely on coal or other fossil fuels.
- Methane capture: Methane is known as a climate super-pollutant. Capturing methane from landfills, orphaned oil wells, or agricultural operations prevents a particularly potent greenhouse gas from reaching the atmosphere.
- Regenerative agriculture: Farming practices that sequester carbon in soil while improving overall ecosystem health.
Not all carbon credits are created equal, and that distinction matters. High-integrity carbon credits are generated by projects that operate on carbon credit registries like the American Carbon Registry, Climate Action Reserve, Verra, and the Gold Standard which have been approved by the Integrity Council for Voluntary Carbon Markets (ICVCM) for rigorous governance, tracking, transparency, and no double-counting. All carbon credits from these projects go through independent third-party verification to ensure that the emissions reductions claimed by a project are real, measurable, additional (meaning they would not have happened without the carbon credit funding), and permanent.
Carbon offsetting works best as a complement to emission reductions, not a substitute for them. The goal is always to reduce first, then offset what cannot be avoided. You can learn more in the Terrapass Guide to Carbon Credits.
Why Carbon Offsetting Make Sense for World Cup Travel
Quick Answer: Many of the emissions generated by World Cup travel, particularly long-haul international flights, cannot currently be eliminated with available technology. Carbon offsetting give fans a practical way to take responsibility for those unavoidable emissions while supporting verified climate projects around the world.
Aviation remains one of the most difficult sectors to decarbonize. Sustainable aviation fuel exists and is growing, but it currently accounts for a small fraction of global fuel supply and comes at a significant price premium. Electric long-haul aircraft are still years away from commercial viability. For most fans, flying to the World Cup means generating emissions that cannot yet be avoided through any other realistic means.
This is precisely the situation carbon offsetting is designed to address.
By calculating the emissions from your flights, hotel stays, and ground transportation, you can take meaningful financial responsibility for that footprint today, while the world works toward the technologies and systems that will eventually make low-carbon travel universally accessible.
Terrapass makes this process straightforward. The company has been helping individuals and businesses calculate and offset their carbon footprints for more than 20 years, funding verified projects in forestry, renewable energy, methane capture, and other categories. For fans planning to attend the 2026 World Cup, the Terrapass Flight Carbon Calculator provides a clear estimate of travel emissions and purchasing personal carbon offsets takes only a few minutes.
This is not about guilt or restriction. It is about celebrating the sport you love while acknowledging that our choices have consequences, and then actually doing something about it.

The Lasting Legacy of Sustainable Sporting Events
Quick Answer: When sporting events invest in sustainability, the benefits extend well beyond the tournament itself. Infrastructure improvements, cleaner energy systems, stronger transit networks, and community investments all create lasting value for host cities and the people who live in them.
The 2026 World Cup will end. The infrastructure, habits, and standards it helps establish will not.
Host cities that expand their public transit systems for the tournament will keep those systems running after the last match. Stadiums that invest in renewable energy and efficient operations will benefit from lower costs and reduced emissions for years. Communities that build composting and waste diversion programs during the event have the framework to sustain them long afterward.
This is what legacy planning means in practical sustainability terms. The most successful sporting events do not just minimize harm. They leave behind something genuinely valuable.
The tournament also has the potential to accelerate the normalization of sustainable behavior among millions of fans. When people experience public transit that actually works, venues that make recycling easy, and hotels that back up their environmental commitments with real action, those experiences reshape expectations. Fans carry those expectations home with them and apply them to their daily lives.
Climate action at scale is not driven only by policy. It is driven by cultural change, by enough people deciding that this is simply how things are done now. A World Cup can contribute to that shift in ways that are hard to quantify but easy to recognize when you see them.
Sustainable Travel Checklist
Use this as your personal guide for the 2026 World Cup:
Before You Go
- Calculate your travel emissions using the Terrapass Carbon Footprint Calculator
- Purchase verified carbon offsets for your flights and other travel
- Book accommodations with recognized green certifications
- Research public transit options at each host city you plan to visit
- Pack a reusable water bottle, travel mug, and shopping bag
Getting There
- Choose direct flights to reduce fuel burn from multiple takeoffs and landings
- Consider train travel for shorter routes between host cities
- Use public transit from the airport rather than renting a car
- If renting, select an electric or hybrid vehicle
During the Tournament
- Use public transit or walk to the stadium
- Fill your reusable bottle at stadium refill stations
- Sort waste into the correct recycling and composting bins
- Explore plant-based food options at the venue
- Eat at locally owned restaurants
- Buy local souvenirs to support host community economies
- Respect local environmental regulations and natural spaces
When You Get Home
- Share your experience and the sustainable choices you made with friends and family
- Keep the habits you built during the tournament going
- Consider a home energy audit or a renewable energy subscription
Did You Know? Sustainability Facts Worth Sharing
Fact 1: The United Nations Sports for Climate Action Framework has more than 300 signatories from the global sports community, including leagues, clubs, national associations, and event organizers all committed to reducing sports-related emissions.
Fact 2: Reusing existing stadiums avoids the construction-related carbon emissions that have been one of the most criticized aspects of past World Cups and Olympic Games. Building a new stadium can generate hundreds of thousands of metric tons of CO2-equivalent before a single match is played.
Fact 3: A single round-trip transatlantic flight can generate roughly as much CO2-equivalent per passenger as several months of average home energy use, which is why aviation is such an important focus for anyone thinking seriously about their personal carbon footprint.
Fact 4: Verified carbon projects often generate benefits beyond emissions reductions, including biodiversity protection, community employment, cleaner water, and improved public health in project communities.
Fact 5: The 2026 FIFA World Cup will be the first ever to feature 48 teams, meaning the number of matches and participating nations will be larger than at any previous tournament in the sport’s history.
Fact 6: Plant-based food options generate significantly lower greenhouse gas emissions per serving than beef or lamb on average, making menu choices at stadiums a surprisingly meaningful sustainability decision when multiplied across millions of meals.
Fact 7: Renewable Energy Certificates (RECs) allow individuals and businesses to match their electricity consumption with verified renewable energy generation, making it possible to support clean energy even when your local grid still relies on fossil fuels.

Every Goal Counts On and Off the Field
The 2026 FIFA World Cup is going to be extraordinary. Forty-eight teams. Sixteen cities. Three countries. The greatest players in the world are competing for the most coveted prize in sport. Billions of people watching.
It is also a moment.
Moments like this are rare. Occasions when the whole world is paying attention at the same time, when shared experience opens the door to shared action. The players on the pitch will give everything for 90 minutes. Fans in the stands and at home can give something too.
Not perfection. Not sacrifice. Just intention.
Choosing a direct flight. Riding the subway to the stadium. Filling a reusable bottle. Eating a plant-based meal. Staying somewhere that has earned its green credentials. Offsetting the emissions from your journey before you even board the plane.
None of these things are dramatic on its own. Together, across millions of fans in 2026, they add up to something significant.
Terrapass has spent more than 20 years making it easy for people to take genuine responsibility for their carbon footprint. Whether you are attending matches in person, hosting viewing parties, or following the tournament from afar, there are meaningful ways to reduce your impact and offset what you cannot yet eliminate.
Calculate your World Cup travel footprint and offset your emissions at Terrapass.com.
The world is watching. Let’s make this one count.
Frequently Asked Questions
What is the environmental impact of the FIFA World Cup?
The FIFA World Cup generates greenhouse gas emissions across several categories: international and domestic air travel, ground transportation, hotel stays, stadium operations, food service, and event logistics. Fan travel, particularly long-haul flights, typically represents the largest share of total emissions for a sporting event at this scale. The 2026 tournament spans three countries and 16 host cities, making transportation planning especially important for fans who want to minimize their footprint. While exact projections for 2026 are not yet finalized, past tournaments have generated hundreds of thousands of metric tons of CO2-equivalent.
Why does air travel create so many emissions?
Aircraft burn large quantities of jet fuel during flights, releasing CO2 and other climate-warming compounds. Unlike ground vehicles, which can be electrified relatively quickly, long-haul aircraft have very few low-carbon alternatives available on a commercial scale today. Sustainable aviation fuel exists but currently makes up a small fraction of global supply. A single round-trip transatlantic flight can generate roughly 1 to 1.5 metric tons of CO2-equivalent per passenger, comparable to several months of home energy use. Flying in a higher class or on older, less fuel-efficient aircraft increases emissions further.
Are existing stadiums better for the environment?
Generally speaking, yes. Constructing a new stadium requires enormous quantities of concrete, steel, and other materials, all of which carry substantial embedded carbon emissions. Using existing venues avoids those construction-related emissions entirely. The 2026 World Cup benefits significantly from this approach, as most venues, including major NFL and MLS stadiums across the U.S., are already built and operational. This does not eliminate the event’s footprint, but it removes one of the most carbon-intensive categories that has drawn criticism at past tournaments and Olympic Games.
How can I travel more sustainably to the World Cup?
Sustainable travel starts before you leave home. Choose direct flights when possible, since takeoffs and landings are the most fuel-intensive phases of any flight. Use public transit from airports to hotels and stadiums rather than renting a car. If a car is necessary, choose an electric or hybrid option. Book accommodations with recognized environmental certifications. Pack reusable bags, bottles, and utensils. And calculate your unavoidable travel emissions with the Terrapass Flight Carbon Calculator so you can offset them through a verified program before you depart.
What are carbon credits?
Carbon credits are verified units representing the reduction or removal of one metric ton of CO2-equivalent greenhouse gas emissions. When you purchase carbon credits, you fund projects that prevent greenhouse gases from entering the atmosphere, such as protecting forests, building renewable energy capacity, or capturing methane from landfills. High-integrity carbon credits are independently verified under recognized standards organizations, ensuring the emissions reductions claimed are real, measurable, additional, and permanent. Carbon credits work best when used to compensate for emissions that cannot currently be eliminated, not as a substitute for actually reducing your footprint.
Should I offset my flight?
If you are flying to attend the 2026 World Cup, offsetting your flight emissions is one of the most practical and immediate steps available to you. Aviation is among the most carbon-intensive activities most individuals engage in, and the technology to eliminate those emissions on a commercial scale does not yet exist. By calculating your flight’s emissions and purchasing verified carbon credits, you take direct financial responsibility for that footprint and fund climate projects that make a measurable difference. It is not a perfect solution, but meaningful steps taken by millions of people are how real progress gets made. Use the Terrapass Flight Carbon Calculator to get started.
How can fans reduce their carbon footprint at the World Cup?
Fans can reduce their carbon footprint through choices made at every stage of the trip: flying direct, using public transit, staying in sustainable hotels, bringing reusable water bottles, choosing plant-based food options at the venue, sorting waste properly, supporting local businesses, and offsetting unavoidable travel emissions before departure. No single action eliminates a fan’s footprint entirely, but the combined effect of millions of fans making better choices produces a meaningful reduction across the tournament as a whole. The single most impactful individual action is almost always reducing transportation emissions, particularly from flying. Explore personal carbon offset options at Terrapass to cover what you cannot eliminate.
What is sustainable tourism?
Sustainable tourism means travel that minimizes negative environmental and social impacts while contributing positively to host communities. In practice, it means choosing lower-carbon transportation, supporting locally owned businesses, respecting natural environments and local cultures, reducing waste, conserving water and energy, and taking responsibility for unavoidable emissions through verified offset programs. For World Cup fans, it means being a thoughtful guest in each host city, recognizing that the places and communities welcoming the tournament deserve real respect, and that travel itself can be conducted in ways that leave a lighter footprint.
What is FIFA doing to reduce environmental impacts at the 2026 World Cup?
FIFA’s Sustainability and Human Rights Strategy includes environmental commitments around emissions reduction, responsible procurement, sustainable venue management, waste diversion, and legacy planning. For the 2026 tournament, FIFA is working with host associations in the U.S., Canada, and Mexico to incorporate sustainability requirements into venue operations, transportation planning, and community investment. The decision to use largely existing stadiums is itself a significant sustainability choice. Independent stakeholders and advocacy organizations continue to monitor FIFA’s progress against its stated commitments, and transparent reporting will be essential to evaluating the actual outcomes. More details are available at FIFA’s official sustainability pages.
Can sporting events be sustainable?
Mega sporting events cannot be carbon neutral in any simple sense. They involve too much travel, too much energy, and too much logistical complexity. But they can be substantially more sustainable than a business-as-usual approach, and they can generate lasting positive legacies in host communities. The goal is not perfection but meaningful reduction, honest accounting, and genuine investment in the infrastructure and behaviors that make lower-carbon futures possible. The 2026 World Cup has real opportunities in all three categories. Whether those opportunities are fully realized depends on the choices made by FIFA, host cities, sponsors, and the fans themselves.
How can businesses support climate action around the World Cup?
Businesses can use the 2026 World Cup as an occasion to assess and reduce their own operational carbon footprints, offset emissions from employee travel and corporate hospitality, engage customers and partners in sustainability initiatives, and support climate projects through verified carbon programs. Sponsoring or hosting sustainable events, choosing suppliers with credible environmental commitments, and publishing transparent emissions data are all meaningful steps. For companies with significant travel or event-related footprints, working with an established carbon management partner to measure, reduce, and offset those emissions is a practical place to start. Terrapass offers business carbon offset programs and Renewable Energy Certificates to help organizations take concrete action.
Links Reference
Terrapass Internal Links (live throughout article)
- Carbon Footprint Calculator
- Flight Carbon Calculator
- Personal Carbon Offsets
- Business Carbon Offsets
- Renewable Energy Certificates
- Carbon Credit Guide
External Sources
- FIFA World Cup 26 Sustainability Documentation
- FIFA Sustainability
- UN Sports for Climate Action Framework
- United Nations Environment Programme
- IPCC
- American Carbon Registry
- Climate Action Reserve
- Verra / Verified Carbon Standard
- Gold Standard
The post 2026 FIFA World Cup Carbon Footprint: A Sustainability Guide appeared first on Terrapass.
A few months ago I went to a climate change forum at the Center for Brooklyn History. The panel I attended, “Confronting Climate Change: Understanding Deniers,” featured the prominent climate activist, Bill McKibben.

Bill McKibben. Courtesy https://billmckibben.com/.
I was curious to hear McKibben’s take on climate change deniers. I don’t regard the true deniers as a big problem – they’re only 11-15% of our country, according to most polls. Rather, I wondered if McKibben would label as “climate deniers” people who agree that climate change is a significant problem but disagree with his framing and his proposed solutions. I have worked for decades on energy and climate matters as an energy lawyer. Now, more than ever, I believe that to address climate change we need to build a big tent.
In the Q&A I tested where McKibben is on this by asking if he would label as a climate denier someone who subscribes to the main tenets of climate change science yet holds that natural gas has a role to play as a bridge fuel. (Our exchange starts at 1:12:45 of the video.)
This could have been a chance for McKibben to make clear that such a view isn’t climate denialism, even if he feels it’s misguided. But he punted, saying “I don’t care whether they’re deniers or not.” For good measure, he threw in his long-standing refrain that swapping coal for natural gas makes climate change worse, despite coal’s far higher carbon content per unit of energy.

674-MW methane-powered generating station, Salem, MA.
As you can hear in the recording, McKibben’s claim that gas is worse than coal draws on the work of Cornell scientist Robert Howarth. Yet McKibben didn’t mention that Howarth’s work is controversial and disputed by many scientists. The crux of the dispute is whether methane’s impact on warming should be measured with a 20-year or 100-year time frame.
Methane is a relatively short-lived greenhouse gas, with a lifetime of around 10 years, versus the 100-year life applicable to carbon dioxide. But each ton of methane is far more potent while in the atmosphere, trapping roughly 100 times as much heat as a ton of CO2. These cross-cutting facts about atmospheric methane — shorter life but greater potency than CO2 — have resulted in two opposing camps: one insisting on a 20-year timeframe for greenhouse gas accounting, the other adhering to the established 100-year frame. This matters because with a 20-year timeframe, generating electricity with natural gas (which, chemically speaking, is essentially all methane) is more damaging to climate than coal-fired electricity.
McKibben blew past this dispute. To hear him at the Center for Brooklyn History, one would have no inkling that there’s an active disagreement over which timeframe to use, that there are staunch climate activists who favor the 100-year time frame, and that the Intergovernmental Panel on Climate Change (IPCC) generally uses the 100-year timeframe.

McKibben’s latest (2025) book. Published by W.W. Norton & Company.
McKibben also insisted that a discussion about natural gas’s potential role in mitigating climate change as a replacement for coal is irrelevant because solar “is now our cheapest resource.” McKibben’s claim, of course, suffuses “Here Comes the Sun,” his 2025 book that extols solar power as the cheapest solution for all of our energy needs. But this too is questionable, because it’s based on cost comparisons between solar farms and natural gas power plants (or nuclear power plants) that fail to consider that electricity supply and delivery is a complex system of wires and plants rather than individual power plants. Based on his remarks, McKibben is choosing to ignore studies such as the comprehensive 2025 report from the Clean Air Task Force that concluded that plant-level cost comparison “is a good metric to track historical technology cost evolution [but] is not an appropriate tool to use in the context of long-term planning and policymaking for deep decarbonization.” And the task force is not alone in finding that when electricity is treated as a system, solar loses its place as the cheapest low-carbon resource.
The dogmatism McKibben displayed at the Brooklyn meeting was unfortunate. We’re in a time when efforts to combat climate change are in retreat. A unified front is required to turn the tide. Instead of doubling down on absolutist positions, activists like McKibben who seem convinced that the solution to climate change is all-renewables, end of discussion, should be seeking common ground with others who want climate action but believe that nuclear power and natural gas must also play a role.

NYC Climate March, Sept 17, 2023. Photo: C. Komanoff.
Climate change activists need to build a bigger tent, rather than call anyone who disagrees with their positions a climate change denier. It is striking that McKibben stuck to his guns after saying in the same talk that the most important goal for everyone right now is to help climate change realists win more House and Senate seats in this year’s midterms. As some have noted, an absolutist position on natural gas appears less likely to achieve that win and politicians are following that advice.
Will McKibben evolve? He has demonstrated that he knows how to build a national climate movement centered around issues like divestment. Given the current political situation, he should focus on building an even bigger tent by welcoming all of the 85% who believe that we need to address climate change but do not agree with his ideological positions.
Rich Miller is an energy lawyer who has worked for a variety of stakeholders and now gives walking tours in lower Manhattan on the history of electricity.

Image generated with Claude. Why have we juxtaposed a bicycle with balcony solar? Read on.
First it was Plug-In Solar. Then it was Balcony Solar. Now it’s Guerrilla Solar, at least according to Inside Climate News, which yesterday proclaimed that The ‘Guerrilla Solar’ Era Has Arrived.
“It,” of course, is Modular solar panels. They’re the hot new photovoltaic solution: cheap enough to buy at Home Depot, easy to hang or prop to catch maximum rays, and small enough to fit on a balcony (if you’ve got one) and plug into your “home grid.” But, alas, too meager a generator of electricity to be more than a bit player in decarbonizing most U.S. homes.
How do I know? I’ve done the math.
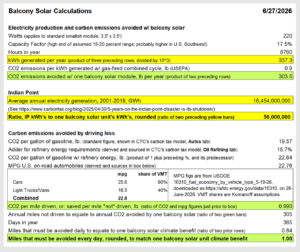
A standard, lower-end 220-watt balcony solar array will produce 337 kilowatt-hours a year, or 28 kWh a month averaged over the course of a year. That’s for a 220W unit measuring 3.5 feet by 3.5 feet. (220W x 1/1000 x 17.5% x 8760 hours per year = 337 kWh. Calculation assumes a 17.5% full-year capacity factor, which is arguably generous for New York, where I live. )

Our balcony solar mashup. Top: an install in Germany. Bottom: Home Depot advert.
A typical U.S. home consumes 10,500 kWh a year, or 28 to 29 kWh per day, says Solartech, drawing on U.S. Energy Information Administration data. That puts a home’s daily power needs on par with a balcony solar unit’s monthly output. In effect, once each month the balcony array gifts a homeowner or renter a bit more than day’s full complement of electricity. And earth’s atmosphere gets the same respite: a 3 percent reduction in carbon emissions caused by the home’s electricity usage.
(The 3 percent figure could also be calculated directly by dividing 337 kWh per year of solar production by 10,500 kWh per year to run the home. For bigger or smaller arrays, just prorate your assumed wattage by my 220W; for 440W, say, double my figures.)
Balcony Solar metrics
Why write about balcony solar if it’s so inconsequential? CTC’s mission includes puncturing would-be climate balloons before they ascend too far. In the same vein, we practice quantification to make clear what does and doesn’t move the climate needle. (More on that further below.)
The best way to depict balcony solar’s climate value is to express it in terms of tangible metrics. We’ve selected two. Both assume the basic, lower-end PV array I assumed at the top: a 3.5 foot-square array whose peak output is 220 watts.
1. It would take 50 million 220W balcony solar units (bsu’s) to restore the climate benefit we destroyed in 2020-2021 when we shut the high-performing Indian Point nuclear power plant 32 miles from Midtown Manhattan.
2. A single person cutting back their driving by a mile a day would provide the same climate benefit over the course of a year as a single 220W bsu.
(Calculations in sidebar. Now you know why we led with images of an urban dweller as cyclist and balcony solar user.)
Yes, it’s dense — as befits a sidebar. The numbers tell a story. Follow the color co-ordination.
Ponder that: It would take fifty million smallish bsu’s to level up to the fossil fuel carbon emissions that Indian Point was keeping at bay by supplying the New York City area year in and year out with abundant carbon-free power. Deploying that many balcony solar units would entail 10 bsu’s for each of the 5 million households in the MTA’s service territory. (The Metropolitan Transportation Authority provides subway, bus and commuter rail transit in the five boroughs and seven suburban counties.) Or, if those same households upgraded to 1100-watt bsu’s, collectively they would still make up only half of the lost Indian Point power.
The second comparison, involving driving, is perhaps trickier to grasp but more interesting, since it relates to people’s behavior. Living differently isn’t part of public discourse, at least not in the USA, and especially when what’s being served up is using less. But “reducing,” as we might call it (remember “Reduce, Reuse, Recycle”? or, “Insulate, then Insolate”?) is just as potent for cutting emissions as switching to renewables — even more so when the reducing means driving less, considering the multitude of benefits that accrue from diminishing cars’ imprints on our communities. Still, staying on topic: driving just one fewer mile per day brings about the same shrinkage in carbon emissions as deploying one 220W solar array.
What Balcony Solar boosters are really saying
To be fair, our friends at Inside Climate News and, yes, The New York Times appear to be trying to modulate their balcony solar enthusiasm.
ICN‘s Dan Gearino, whom we cited up front, said he looked to Germany, the birthplace of balcony solar, to see if the units made sense for U.S. households. His takeaway: “It may make more sense financially to spend the cost of plug-in solar on insulation, air sealing or other basic measures to reduce energy use.” Hooray: insulate before you insolate.
Gearino helpfully interviewed renewables guru (and U.S. emigré) Craig Morris, who currently heads Germany’s plug-in solar trade association, Bundesverband Steckersolar. To Morris, balcony solar’s main advantages are that it provides power without taking up land, and that it affords people a way to “become participants in the transition to clean energy.” Behold, guerrilla solar. That, in turn, bolsters “the political consensus that supports the transition.” But Morris also made clear that widespread adoption of plug-in solar would only meet “about 2 percent of Germany’s electricity demand.”
Morris’s “about 2 percent” feels right for Germany. But not for the U.S., where widespread adoption of virtually any individual carbon alternative seems forever out of reach, and where the energy pie is so much larger — think giant fridges, freezers for beer, steroidal homes bursting with piles of powered toys, not to mention industrial and institutional electricity use that Morris correctly excluded from his figure.

Don’t forget to micro-dose. NYT headline + image for David Wallace-Wells’ guest essay (see text). Image by Rui Pu.
Both Gearino and Morris seem more measured than climate journalist Robinson Meyer, founding editor of Heatmap and frequent contributor to The Times, where he wrote about balcony solar in mid-June.
“New zero-carbon power kits will allow Americans to make their own energy choices,” declares the callout to the print version of Meyer’s NYT guest essay, The Tiny Solar Panel That Could Change America. (The even more expansive print headline invites us to “Forget Roofs. Backyard Solar Is the Next Frontier.”)
Wallace-Wells is of two minds. He calls balcony solar “a small way that apartment- and condo-dwelling Americans can take ownership of their energy choices and cut down their pollution on the margins.” No quarrel there, thanks to his qualifiers “small” and “on the margins.” Earlier, though, he opines that balcony solar units “have the potential to change how Americans understand and consume energy,” But read further and you’ll again see Wallace-Wells cautioning that “Balcony solar will play one small role in [the] drama” of transiting to the new world of clean, abundant energy.
Any such caveats are welcome these days, amid widespread solar hoopla. Still, it doesn’t seem to be in Wallace-Wells’ toolkit — or that of Inside Climate News and other mainstream climate journalists — to tutor their audiences as to the true limits of balcony solar and other panaceas. Just like it wasn’t in their field of vision a decade ago to lay out the true stakes of shutting Indian Point as Riverkeeper was singing its siren song.
What’s Next for NY Balcony Solar
Meantime, as Canary Media reported recently (and helpfully), New Yorkers concerned with climate and affordability are waiting for NY Gov. Kathy Hochul to sign the recently passed SUNNY (Solar Up Now New York) Act legalizing balcony and other plug-in solar. It would be head-spinning (and politically suicidal) if she didn’t, given near-universal support ranging from Con Edison to DSA Assembly Member Emily Gallagher, who told Canary Media, “This is the most popular bill I’ve [ever] worked on.”
My guess is that Hochul is waiting for the right moment, and perhaps the right “package,” that can advance and not undercut her push to launch five large new nuclear power plants around the state — one to be built by the public New York Power Authority, the others to be constructed and operated privately. A little bit of math, a la what we offered here a la Indian Point, might help her out.
The governor also must manage the veritable hot potato of her deferred implementation of the landmark 2019 Community Leadership and Climate Protection Act. She might do well to consider jettisoning the act’s unwieldy cap-and-invest centerpiece in favor of a straight-up carbon tax (with the revenues distributed pro rata to the state’s households) in its place. That, far more than balcony (or guerrilla) solar, could blow open the door to the “innovations and technologies we cannot yet imagine” that Wallace-Wells fantasized about in his Times essay.


-
Greenhouse Gases11 months ago
Guest post: Why China is still building new coal – and when it might stop
-
Climate Change11 months ago
Guest post: Why China is still building new coal – and when it might stop
-

 Greenhouse Gases2 years ago
嘉宾来稿:满足中国增长的用电需求 光伏加储能“比新建煤电更实惠”
-

 Climate Change2 years ago
嘉宾来稿:满足中国增长的用电需求 光伏加储能“比新建煤电更实惠”
-
Climate Change2 years ago
Bill Discounting Climate Change in Florida’s Energy Policy Awaits DeSantis’ Approval
-

 Renewable Energy9 months ago
Sending Progressive Philanthropist George Soros to Prison?
-

 Carbon Footprint2 years ago
US SEC’s Climate Disclosure Rules Spur Renewed Interest in Carbon Credits
-
Greenhouse Gases1 year ago
嘉宾来稿:探究火山喷发如何影响气候预测