

Nissan has struck a new emissions-pooling deal with BYD, a Chinese electric vehicle maker. This partnership aims to help meet the European Union’s tough carbon dioxide limits for carmakers set for 2025. Nissan’s partnership with BYD lets it combine its European fleet emissions with BYD’s low-emission record. This helps Nissan avoid penalties while it shifts to electric mobility.
The move shows how traditional automakers are adapting to quick climate rules. They are forming strategic partnerships to stay compliant and grow their electric lineups.
Understanding EU Emission Rules
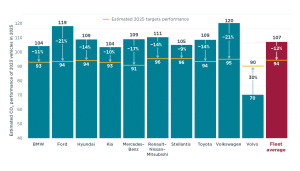
The European Union enforces some of the toughest vehicle emission standards in the world. Starting in 2025, carmakers must limit their average emissions to about 93.6 grams of CO₂ per kilometer. This is measured using the Worldwide Harmonised Light Vehicle Test Procedure (WLTP). The rule applies to every automaker based on the average emissions of the new cars they sell in the EU each year.
If a company’s average exceeds its target, it faces a fine of €95 for each gram per kilometer above the limit multiplied by the number of cars sold. For large manufacturers, this can easily translate to hundreds of millions, or even billions, of euros in penalties.

Analysts say the combined risk for the industry could reach over €10 billion if several automakers fail to meet the new limits.
The EU wants to speed up the shift to electric vehicles (EVs) and plug-in hybrids. They aim to stop selling new petrol and diesel cars by 2035. While many automakers have increased EV output, the pace of change remains uneven across brands and regions.
Pooling 101: How Automakers Share Emissions to Survive
To give companies flexibility, EU rules allow them to form “emissions pools.” This system lets manufacturers combine their vehicle fleets and calculate an average CO₂ figure together.
If one company has a cleaner fleet—such as an EV producer—it can offset the higher emissions of another. The combined average determines whether the group meets the EU target.
Pooling has become a common compliance tool in Europe. Tesla made hundreds of millions of euros by teaming up with legacy automakers like Fiat Chrysler and Honda. They used Tesla’s zero-emission cars to meet their emissions goals. Nissan’s new agreement with BYD follows the same principle.
By linking with BYD, Nissan can count a share of BYD’s low-carbon vehicle sales toward its own compliance calculation. This partnership will lower Nissan’s average emissions in Europe by 2025. This move helps the company steer clear of hefty fines.
Why Nissan Turned to BYD
Nissan had previously joined an emissions pool with Renault as part of their long-time alliance. Nissan has decided to partner with BYD, one of the largest EV makers. This choice comes as the Renault–Nissan partnership operates more independently and EU rules get stricter.
BYD’s growing success in Europe made it an attractive partner. The company has quickly grown its market share. This is thanks to all-electric and plug-in models that create almost no tailpipe emissions.
Nissan’s strong performance helps offset the higher emissions from its petrol and hybrid models. These models still account for a large part of its sales in Europe.
Industry analysts say this decision reflects both opportunity and necessity. It gives Nissan breathing room as it works to increase its electric lineup in Europe. The company plans to sell only fully electric cars in Europe by 2030. For now, pooling provides a temporary solution to stay compliant as EV production increases.
The Debate: Compliance Shortcut or Climate Setback?
The deal benefits both companies in different ways. For Nissan, the partnership avoids immediate financial penalties and protects its market position during a challenging transition.
For BYD, it could provide a new revenue stream, as the company may receive payment or carbon credits for its contribution to the pooled fleet. It also strengthens BYD’s presence in Europe, where competition in the EV market is intensifying.
However, not everyone sees pooling as a long-term solution. Environmental groups and some policymakers say these deals can slow real emission cuts. High-emission automakers rely on cleaner partners rather than fully changing their production lines. These strategies might meet legal rules, but they do little to speed up the actual drop in transport emissions.
Still, the system remains a legal and effective compliance method under EU law. Most experts agree that pooling will last until electric vehicle production and sales are strong. This strength will make partnerships between automakers unnecessary.
A Growing Trend in the Auto Industry
Nissan and BYD’s collaboration is part of a wider trend among carmakers facing tighter environmental rules. Over the past few years, multiple manufacturers have entered pooling agreements with EV specialists to avoid penalties.
According to industry data, nearly a dozen major automakers are now part of emissions pools across Europe. These arrangements are likely to increase in the short term.
- RELEVANT: EU’s 2025 Emission Rules Led Tesla and Mercedes to Pool Carbon Credits to Avoid $15.6 Billion Fine
EV sales are rising fast, but challenges remain. Traditional carmakers struggle to switch to electric models due to:
- Infrastructure gaps
- High battery costs
- Supply-chain issues
Pooling provides short-term relief. It helps the industry sell vehicles in Europe and stay within emissions limits.
From Pooling to Full Electrification
For Nissan, this agreement marks another step in its broader electrification plan. The company will launch more all-electric and hybrid vehicles. This plan is backed by new EV production hubs in the UK and Spain. By 2028, Nissan plans to launch several next-gen models. These will help reduce average emissions without depending much on pooling, which is important in its net-zero goal.
Nissan’s Roadmap to Net Zero
Nissan has set a long-term goal to achieve carbon neutrality across its entire business by 2050. This includes not only vehicle emissions but also their manufacturing, supply chain, and end-of-life processes. The company’s climate strategy focuses on electrifying its lineup, cutting factory emissions, and using more recycled and low-carbon materials.
- Long-Term Goal: Carbon Neutral by 2050
Nissan’s 2050 vision aims for zero emissions across the full lifecycle of its vehicles—from production to use and recycling. The company wants every car it sells, and every factory it operates, to be carbon neutral by mid-century. This goal aligns with global climate efforts to limit warming to 1.5°C.
- Mid-Term Targets Under Nissan Green Program 2030
To reach this long-term target, Nissan launched the “Green Program 2030,” a set of mid-term goals that guide its transition over the next decade. The plan includes cutting emissions in both manufacturing and vehicle use.

In Europe, Nissan has set an ambitious goal for all its new cars to be fully electric by 2030. In Asia, the carmaker is also investing in EV supply chains and battery development.
Back in its home, Japan, Nissan has introduced new technologies to reduce factory emissions and is promoting renewable energy use across its facilities. In North America, the company is launching new hybrid and electric models to meet rising consumer demand for cleaner vehicles.

The company plans to reach carbon neutrality through three main strategies:
- Electrification of vehicles
- Cleaner manufacturing
- Circular supply chain
Nissan’s decision to pool emissions with BYD in Europe fits within its broader decarbonization strategy. The deal gives Nissan temporary flexibility as it ramps up production of electric models and upgrades its European operations to lower carbon intensity.
For BYD, the partnership supports its strategy of expanding into European markets. The company continues to grow its sales network across the continent, with production plans in Hungary and potential sites in France. Its role as a compliance partner shows its strength as a global EV leader. It can influence industry trends beyond just its own brand.
Pooling remains a practical tool for now, giving Nissan and others time to adjust. Yet, as regulations tighten and public expectations rise, long-term success will depend on how quickly these companies can shift from depending on emission credits to producing truly zero-emission vehicles of their own.
The post Nissan Partners with BYD to Meet EU 2025 Carbon Rules and Avoid Hefty Fines appeared first on Carbon Credits.
Every business carbon footprint report ends with a number, the amount of carbon emissions produced by the business, less the amount of carbon reduced and offset, given in tonnes of CO₂. Many of the people who sign off on that number, including those who paid for it, cannot picture what it represents on the ground. A tonne is a unit of mass. CO₂ is invisible. The link between the amount offset in the report and a real piece of restored forest somewhere in the world is almost never indicated.
![]()
Americans are paying more for insurance, electricity, taxes, and home repairs every year. What many people may not realize is that climate change is already one of the drivers behind those rising costs.
For many households, climate change is no longer just an environmental issue. It is becoming a cost-of-living issue. While climate impacts like melting glaciers and shrinking polar ice can feel distant from everyday life, the financial effects are already showing up in monthly budgets across the country.
Today, a larger share of household income is consumed by fixed costs such as housing, insurance, utilities, and healthcare. (3) Climate change and climate inaction are adding pressure to many of those expenses through higher disaster recovery costs, rising energy demand, infrastructure repairs, and increased insurance risk.
The goal of this article is to help connect climate change to the everyday financial realities people already experience. Regardless of where someone stands on climate policy, it is important to recognize that climate change is already increasing costs for households, businesses, and taxpayers across the United States.
More conservative estimates indicate that the average household has experienced an increase of about $400 per year from observed climate change, while less conservative estimates suggest an increase of $900.(1) Those in more disaster-prone regions of the country face disproportionate costs, with some households experiencing climate-related costs averaging $1,300 per year.(1) Another study found that climate adaptation costs driven by climate change have already consumed over 3% of personal income in the U.S. since 2015.(9) By the end of the century, housing units could spend an additional $5,600 on adaptation costs.(1)
Whether we realize it or not, Americans are already paying for climate change through higher insurance premiums, energy costs, taxes, and infrastructure repairs. These growing expenses are often referred to as climate adaptation costs.
Without meaningful climate action, these costs are expected to continue rising. Choosing not to invest in climate action is also choosing to spend more on climate adaptation.
Here are a few ways climate change is already increasing the cost of living:
- Higher insurance costs from more frequent and severe storms
- Higher energy use during longer and hotter summers
- Higher electricity rates tied to storm recovery and grid upgrades
- Higher government spending and taxpayer-funded disaster recovery costs
The real debate is not whether climate change costs money. Americans are already paying for it. The question is where we want those costs to go. Should we invest more in climate action to help reduce future climate adaptation costs, or continue paying growing recovery and adaptation expenses in everyday life?
How Climate Change Is Increasing Insurance Costs
There is one industry that closely tracks the financial impact of natural disasters: insurance. Insurance companies are focused on assessing risk, estimating damages, and collecting enough revenue to cover losses and remain financially stable.
Comparing the 20-year periods 1980–1999 and 2000–2019, climate-related disasters increased 83% globally from 3,656 events to 6,681 events. The average time between billion-dollar disasters dropped from 82 days during the 1980s to 16 days during the last 10 years, and in 2025 the average time between disasters fell to just 10 days. (6)
According to the reinsurance firm Munich Re, total economic losses from natural disasters in 2024 exceeded $320 billion globally, nearly 40% higher than the decade-long annual average. Average annual inflation-adjusted costs more than quadrupled from $22.6 billion per year in the 1980s to $102 billion per year in the 2010s. Costs increased further to an average of $153.2 billion annually during 2020–2024, representing another 50% increase over the 2010s. (6)
In the United States, billion-dollar weather and climate disasters have also increased significantly. The average number of billion-dollar disasters per year has grown from roughly three annually during the 1980s to 19 annually over the last decade. In 2023 and 2024, the U.S. recorded 28 and 27 billion-dollar disasters respectively, both setting new records. (6)
The growing impact of climate change is one reason insurance costs continue to rise. “There are two things that drive insurance loss costs, which is the frequency of events and how much they cost,” said Robert Passmore, assistant vice president of personal lines at the Property Casualty Insurers Association of America. “So, as these events become more frequent, that’s definitely going to have an impact.” (8)
After adjusting for inflation, insurance costs have steadily increased over time. From 2000 to 2020, insurance costs consistently grew faster than the Consumer Price Index due to rising rebuilding costs and weather-related losses.(3) Between 2020 and 2023 alone, the average home insurance premium increased from $75 to $360 due to climate change impacts, with disaster-prone regions experiencing especially steep increases.(1) Since 2015, homeowners in some regions affected by more extreme weather have seen home insurance costs increased by nearly 57%.(1) Some insurers have also limited or stopped offering coverage in high-risk areas.(7)
For many families, rising insurance costs are no longer occasional financial burdens. They are becoming recurring monthly expenses tied directly to growing climate risk.
How Rising Temperatures Increase Household Energy Costs

The financial impacts of climate change extend beyond insurance. Rising temperatures are also changing how much energy Americans use and how utilities plan for future electricity demand.
Between 1950 and 2010, per capita electricity use increased 10-fold, though usage has flattened or slightly declined since 2012 due to more efficient appliances and LED lighting. (3) A significant share of increased energy demand comes from cooling needs associated with higher temperatures.
Over the last 20 years, the United States has experienced increasing Cooling Degree Days (CDD) and decreasing Heating Degree Days (HDD). Nearly all counties have become warmer over the past three decades, with some areas experiencing several hundred additional cooling degree days, equivalent to roughly one additional degree of warmth on most days. (1) This trend reflects a warming climate where air conditioning demand is increasing while heating demand generally declines. (4)
As temperatures continue rising, households are expected to spend more on cooling than they save on heating. The U.S. Energy Information Administration (EIA) projects that by 2050, national Heating Degree Days will be 11% lower while Cooling Degree Days will be 28% higher than 2021 levels. Cooling demand is projected to rise 2.5 times faster than heating demand declines. (5)
These projections come from energy and infrastructure experts planning for future electricity demand and grid capacity needs. Utilities and grid operators are already preparing for higher peak summer electricity loads caused by rising temperatures. (5)
Longer and hotter summers also affect how homes and buildings are designed. Buildings constructed for past climate conditions may require upgrades such as larger air conditioning systems, stronger insulation, and improved ventilation to remain comfortable and energy efficient in the future. (10)
For many households, this means higher monthly utility bills and potentially higher long-term home improvement costs as temperatures continue to rise.
How Climate Change Affects Electricity Rates
On an inflation-adjusted basis, average U.S. residential electricity rates are slightly lower today than they were 50 years ago. (2) However, climate-related damage to utility infrastructure is creating new upward pressure on electricity costs.
Electric utilities rely heavily on above-ground poles, wires, transformers, and substations that can be damaged by hurricanes, storms, floods, and wildfires. Repairing and upgrading this infrastructure often requires substantial investment.
As a result, utilities are increasing electricity rates in response to wildfire and hurricane events to fund infrastructure repairs and future mitigation efforts. (1) The average cumulative increase in per-household electricity expenditures due to climate-related price changes is approximately $30. (1)
While this increase may appear modest today, utility costs are expected to rise further as climate-related infrastructure damage becomes more frequent and severe.
How Climate Disasters Increase Government Spending and Taxes
Extreme weather events also damage public infrastructure, including roads, schools, bridges, airports, water systems, and emergency services infrastructure. Recovery and rebuilding costs are often funded through taxpayer dollars at the federal, state, and local levels.
The average annual government cost tied to climate-related disaster recovery is estimated at nearly $142 per household. (1) States that frequently experience hurricanes, wildfires, tornadoes, or flooding can face even higher public recovery costs.
These expenses affect taxpayers whether they personally experience a disaster or not. Climate-related recovery spending can increase pressure on public budgets, emergency management systems, and infrastructure funding nationwide.
Reducing Climate Costs Through Climate Action
While this article focuses on the growing financial costs associated with climate change, the issue is not only about money for many people. It is also about recognizing our environmental impact and taking responsibility for reducing it in order to help preserve a healthy planet for future generations.
While individuals alone cannot solve climate change, collective action can help reduce future climate adaptation costs over time.
For those interested in taking action, there are three important steps:
- Estimate your carbon footprint to better understand the emissions connected to your lifestyle and activities.
- Create a plan to gradually reduce emissions through energy efficiency, cleaner technologies, and more sustainable choices.
- Address remaining emissions by supporting verified carbon reduction projects through carbon credits.
Carbon credits are one of the most cost-effective tools available for climate action because they help fund projects that generate verified emission reductions at scale. Supporting global emission reduction efforts can help reduce the long-term impacts and costs associated with climate change.
Visit Terrapass to learn more about carbon footprints, carbon credits, and climate action solutions.
The post How Climate Change Is Raising the Cost of Living appeared first on Terrapass.


-
Climate Change10 months ago
Guest post: Why China is still building new coal – and when it might stop
-
Greenhouse Gases10 months ago
Guest post: Why China is still building new coal – and when it might stop
-

 Greenhouse Gases2 years ago
嘉宾来稿:满足中国增长的用电需求 光伏加储能“比新建煤电更实惠”
-

 Climate Change2 years ago
嘉宾来稿:满足中国增长的用电需求 光伏加储能“比新建煤电更实惠”
-
Climate Change2 years ago
Bill Discounting Climate Change in Florida’s Energy Policy Awaits DeSantis’ Approval
-

 Renewable Energy7 months ago
Sending Progressive Philanthropist George Soros to Prison?
-

 Carbon Footprint2 years ago
US SEC’s Climate Disclosure Rules Spur Renewed Interest in Carbon Credits
-
Greenhouse Gases11 months ago
嘉宾来稿:探究火山喷发如何影响气候预测