

During the 2024 UK general election campaign, politicians and newspapers have used a series of “scary-sounding numbers” to mislead voters about net-zero.
While some of the numbers are accurate in isolation, they have been used in false or misleading ways, shaved of context and typically designed to exaggerate the cost of cutting emissions.
Current prime minister Rishi Sunak, his energy secretary Claire Coutinho and a string of right-leaning newspapers have all been guilty of this approach.
The most common tactics for misleading voters about net-zero include: focusing on the cost of action without mentioning the cost of business-as-usual; mentioning the costs of cutting emissions but not the benefits; and omitting the costs of failing to tackle dangerous climate change.
Below, Carbon Brief factchecks a series of claims made around the election campaign, each of which involves a big number about “costs”. The article explains who made each claim, where the relevant number came from – and the missing context that makes the claim false or misleading.
stat_minus_1
subdirectory_arrow_left
MISLEADING
Hundreds of billions
“We’ve just found a recording that they have put out there from the deputy chancellor from the Labour Party admitting that their [climate] plans will cost hundreds of billions of pounds.”
– Rishi Sunak during BBC leaders’ debate – 26 June 2024
Where it comes from
In what appears to have been a coordinated move, Sunak attacked Labour’s net-zero plans during the final leaders’ debate hosted by BBC News, by citing an article published online the same evening in the Daily Telegraph. The article, which appeared on the newspaper’s frontpage the following morning, is based on public comments by Labour’s Darren Jones in March 2024 about the cost of reaching net-zero emissions by 2050, which is also government policy. The target was legislated in 2019 under Conservative former prime minister Theresa May.
What it excludes
Sunak misleads voters by omitting the fact that his own government – as well as the Conservative manifesto – also support the net-zero by 2050 target. He also ignores the costs of inaction on climate change and the evidence that accelerated action would yield significant economic benefits.
In 2019, the Climate Change Committee estimated that the net cost to the whole economy of reaching net-zero by 2050 would amount to £1.4tn, offset by savings from lower fossil fuel bills of £1.1tn. As set out by the Office for Budget Responsibility (OBR) in 2021, this amounted to a net cost of £321bn over nearly 30 years – consistent with the “hundreds of billions” cited by Labour’s Darren Jones. Furthermore, the OBR estimated that only a quarter of the costs of reaching net-zero would come from public spending and that delaying action towards the target could double the overall cost to the UK. It added that failing to act on climate change would have far greater impacts on the economy and public finances, concluding: “Unmitigated climate change would ultimately have catastrophic economic and fiscal consequences.”
In a 2023 report, the OBR found that continued reliance on gas could be more than twice as costly for the exchequer as reaching net-zero. Separate analysis for trade group Energy UK concluded: “[A]n accelerated transition [to net-zero] could boost the UK’s economy by £240bn in 2050 more than current trajectories…Under the most ambitious scenario, the GDP of each area of the UK would be 5.4%-7.5% greater in 2050 than under the current trajectory.”
close
FALSE
£116bn
“Labour are still not being honest about the costs of their energy policy. Independent energy experts have warned that Labour’s 2030 target would need an extra £116bn of investment, which means one thing…higher taxes for millions of Brits.”
– Claire Coutinho tweet – 25 June 2024
Where it comes from
The figure is based on analysis by consultancy Aurora, which said a total of £116bn would need to be invested during 2025-2035 to reach Labour’s 2030 clean power target. This works at an average of £10.6bn per year, according to Aurora.
What it excludes
The current secretary of state’s phrasing is false. The same Aurora analysis said a total of £105bn would need to be invested during 2025-2035 to meet the government’s own target of clean power by 2035, averaging £9.5bn per year. As such, the “extra” investment is only £11bn over 11 years, or £1bn a year.
Coutinho’s claim that higher investment would mean higher taxes is also false, as electricity sector investment is predominantly from the private sector and paid for via bills. Moreover, Aurora has said, based on the same analysis, that consumer energy bills would be lower under Labour’s 2030 target than under a 2035 clean power goal – or under the current, less ambitious trajectory. Aurora said: “Either scenario will be highly challenging to implement, stretching the limits of deliverability. However, if delivered, increased investment could lead to lower total system costs once the long-term savings from lower gas consumption are included.”
close
FALSE
£30bn
“Ditching Net Zero could save the public sector over £30bn per year for the next 25 years.”
– Reform manifesto – 17 June 2024
Where it comes from
Reform, a climate-sceptic party led and majority owned by Nigel Farage, offers almost no information on how it arrived at this figure. According to the OBR, public-sector spending on net-zero is estimated at around £8bn per year. The only other number mentioned by Reform is for renewable energy subsidies, which it puts at £10bn per year. These are paid by consumers, not the government, such that scrapping them would not save the public sector any money. Instead, Reform proposes to tax renewables by an equivalent amount, which would likely end investor confidence in the UK across the board.
What it excludes
Reform is claiming, implausibly, that the government could save more than it currently spends. It also focuses on the costs of reaching net-zero while ignoring benefits, as well as the cost of business-as-usual. The CCC has estimated that reaching net-zero will entail net investment costs of £44bn per year out to 2050, offset by operational cost savings of £29bn per year, with the annual cost in total averaging £15bn. This excludes wider GDP impacts: the CCC said that the size of the economy, the number of jobs and real disposable incomes would all grow under a net-zero pathway. The CCC’s monetary estimates also exclude the cost of climate impacts, the sizeable health benefits of improved air quality and other externalities. The IEA recently concluded that accelerating climate action towards net-zero “could lead to major reductions in household energy bills”, again purely looking at economic costs and benefits. According to the OBR, the UK government spent £51bn on energy bill support during 2022-23, after gas prices rocketed.
close
FALSE
£2tn
“The UK cost of net-zero has been estimated by the National Grid and others at some £2tn or more. It is so big that no one really knows.”
– Draft Reform manifesto – 19 March 2024
Where it comes from
In 2020, National Grid Electricity System Operator (ESO) estimated the cost of building and operating a net-zero energy system at a cumulative total of £2.8-3tn by 2050. This is the total cost of building and operating the country’s energy system for 30 years.
What it excludes
The Reform statement is false. The same National Grid ESO report said: “Scenarios where we hit net-zero in 2050…incur broadly the same costs as the scenario where we miss our net-zero target.” As such, based on the National Grid ESO analysis, there would not be any additional cost to hitting net-zero relative to running an energy system that does not meet the target. Moreover, in 2021, the Treasury stated: “The costs of global [climate] inaction significantly outweigh the costs of action.”
close
FALSE
£2.8-3tn
“National Grid ESO, the company which manages our electricity supply, has estimated decarbonising Britain’s entire energy system will cost between £2.8tn and £3tn between now and 2050, working out at between £108bn and £115bn a year.”
– Sun comment by Ross Clark – 23 June 2024
Where it comes from
In 2020, National Grid Electricity System Operator (ESO) estimated the cost of the country’s energy system at a cumulative total of £2.8-3tn by 2050. This is the total cost of building and operating the energy system for 30 years.
What it excludes
The climate-sceptic columnist’s statement is false. The same National Grid report said: “Scenarios where we hit net-zero in 2050…incur broadly the same costs as the scenario where we miss our net-zero target.” As such, based on the National Grid ESO analysis, there would not be any additional cost to hitting net-zero, relative to running an energy system that does not meet the target. Furthermore, the £108-115bn annual cost cited by Clark can be compared with the £265bn spent by UK consumers on energy in 2022 – when fossil fuel costs spiked due to Russia’s invasion of Ukraine – including more than £100bn on imported oil and gas alone. These 2022 figures did not include investment in new infrastructure.
close
FALSE
£1,000
“[R]estoring the 2030 ban on the sale of new petrol and diesel cars will cost an estimated extra £1,000 per household per year from 2022 until 2050.”
– Sunday Telegraph article and editorial – 15 June 2024
Where it comes from
The Sunday Telegraph article and accompanying editorial are based on a dossier compiled by free-market thinktank the Institute of Economic Affairs, which, in turn, cites a 2022 report published by consultancy the Centre for Economic and Business Research (CEBR). The CEBR work was funded by Fair Fuel UK, the motoring lobby group run by climate-sceptic Reform candidate for London mayor Howard Cox. The newspaper omits this detail from its article.
What it excludes
The Sunday Telegraph claim is false, because the underlying report from CEBR makes the “simply perverse” assumption that the relative cost of petrol and electric vehicles (EVs) is unchanged for the next 30 years. The assumption that EVs will continue to face a purchase price premium over petrol cars is directly contradicted by the evidence of falling costs, including recent data showing that EVs are now close to up-front price parity in the UK. The Climate Change Committee (CCC) concluded that an earlier combustion-engine car ban would deliver £6bn in cost savings, because EVs have much lower running costs than petrol cars, again directly contradicting the CEBR and Sunday Telegraph claims. When Sunak delayed the combustion-car ban from 2030 to 2035, the CCC said this was “likely to increase…motoring costs for households”, adding that EVs were “significantly cheaper than petrol or diesel vehicles to own and operate”.
check
TRUE
£265bn
“The UK spent a staggering £265bn on energy in 2022 – the most recent data available – including more than £100bn on imported oil and gas alone”
– Tweet by Carbon Brief’s Simon Evans – 8 February 2024
Where it comes from
This is the cost of energy – the majority of it being fossil fuels – bought in the UK in 2022 at market prices, reflecting the cost to consumers of heat, power and transport fuel. The data was the most recently available at time of publication and covers the first year of Russia’s invasion of Ukraine, when Russia restricted gas supplies to Europe and sent fossil fuel prices rocketing. In the pre-crisis year of 2021, the UK spent £184bn on energy.
What it excludes
These figures do not include investment in energy-related infrastructure, such as power plants, pylons, boilers, cars or heat pumps. Many conversations about the cost of reaching net-zero ignore the substantial costs of the status quo, which is heavily reliant on volatile fossil fuels.


The post Factcheck: How ‘scary-sounding numbers’ are being used to mislead the UK about net-zero appeared first on Carbon Brief.
Factcheck: How ‘scary-sounding numbers’ are being used to mislead the UK about net-zero

Three countries have been named by the Paris Agreement’s compliance committee for failing to submit a nationally determined contribution (NDC) and repeatedly snubbing offers of help with their climate plans.
After months of internal debate over whether to identify serial non-responders, the Paris Agreement’s Implementation and Compliance Committee (PAICC) named the three countries which have failed to engage with it over their NDCs on Friday.
It named Democratic Republic of Congo, Senegal and North Korea in a footnote of its annual report, adding that it decided to name them “with a view to facilitating engagement”, adding that representatives of the three nations had been invited to its meeting in early 2027 “with the purpose of identifying any challenges and constraints”.
“The Committee noted the importance of Parties engaging with the Committee in a timely manner, while noting that some delays may be due to the national capabilities and circumstances of the Parties”, the report said.
-
Under US pressure, World Bank says it will back gas “where appropriate”
The US wants the World Bank to expand its gas support while climate campaigners are pushing for it to end – its head spoke this week of limited backing for the fossil fuel -
IPCC scientists vow to press on with climate reports despite political deadlock
After governments again failed to agree a timeline, nearly 120 IPCC authors pledged to complete their assessment on time and with full scientific rigour -
Paris Agreement committee snubbed over missing NDC climate plans
Many governments have still not submitted a nationally determined contribution to the UN, breaching a key requirement of the Paris Agreement

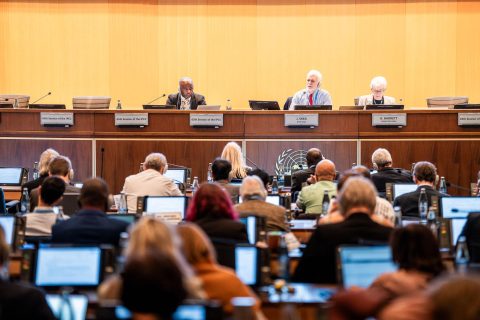

In July, PAICC said 12 countries had ignored its repeated attempts to discuss why they had not published an NDC as required every five years under the 2015 Paris accord.
Members of the committee had been divided over whether to name them, but at a September meeting decided to do so in their annual report to the annual climate COP summit.
By the time the report was published on Friday, only Congo, Senegal and North Korea “had not communicated an NDC or submitted a [Biennial Transparency Report] and had not yet responded to any of the Committee’s notifications, despite several reminders issued by the Committee in this regard”.
Rainforest and renewable energy ambitions
The silence from Congo and Senegal is notable because the former is home to much of the Congo Basin rainforest while the latter has sought billions of dollars in climate finance to support its renewable energy ambitions.
After Brazil, Congo has more rainforest than any country in the world. This forest, and the country’s peatlands, absorb huge amounts of greenhouse gas but are fast being lost to expanding farmland, charcoal production, logging and mining.
Senegal signed a Just Energy Transition Partnership with Canada and wealthy European nations in 2023, to help it meet its renewable energy targets under the-then government of Macky Sall. It was chair of the Least Developed Countries group between January 2022 and December 2023.

Tejas Rao, who is researching the PAICC as part of a doctoral thesis at Cambridge University, said the governments of the three countries should engage with the committee.
“Engagement costs these governments very little and the committee has shown it will listen,” he said.
“Silence leaves the committee with no basis to help, and it leaves the [governments] exposed to the narrative that they are simply disengaged,” he told Climate Home News.
Paris Agreement requirement
The 2015 Paris Agreement requires all parties to publish an NDC every five years outlining their emissions reduction targets, with each plan meant to be more ambitious than the country’s last NDC.
The latest set – the third round of plans, with new targets for 2035 – was due in February 2025. While most countries missed this deadline, all but around 30 – mostly small emitters but including Egypt, Vietnam and Argentina – have now submitted them.
Over the year, the PAICC – which is made up of government climate officials from developed and developing countries – has been communicating with governments that have not submitted NDCs and trying to overcome barriers to them doing so.
Some nations have cited exceptional circumstances as the reason for not submitting an NDC, a process that requires a significant amount of work in tracking emissions and consulting on how to curb them across the economy. For example, a letter from a Sudanese official to the PAICC, seen by Climate Home News, said that the country’s civil war had led to the suspension of its NDC preparation.
-
IPCC scientists vow to press on with climate reports despite political deadlock
After governments again failed to agree a timeline, nearly 120 IPCC authors pledged to complete their assessment on time and with full scientific rigour -
Under US pressure, World Bank says it will back gas “where appropriate”
The US wants the World Bank to expand its gas support while climate campaigners are pushing for it to end – its head spoke this week of limited backing for the fossil fuel