


Carbon capture and storage (CCS) is moving from niche pilot projects to a global climate strategy worth billions. Once seen as a backup plan, it’s now racing to the forefront — from massive U.S. industrial hubs to China’s fast-expanding carbon pipelines. Supporters call it essential for tackling the world’s toughest emissions in steel, cement, and energy. Critics warn it could be a costly detour.
As governments, investors, and big tech pour money into CCS, one question looms: can it deliver the deep carbon cuts needed to hit net zero by 2050?
This guide walks you through everything you need to know: how CCS works, the latest technologies, the biggest projects and market leaders, and where the fastest growth is happening.
We’ll also explore market trends, policy drivers, corporate demand, and the risks investors should watch. Whether you’re new to CCS or tracking it as a climate tech opportunity, this resource covers the science, the strategy, and the business potential shaping the future of carbon removal.
What is Carbon Capture and Storage (CCS)?
Carbon Capture and Storage is a climate technology designed to prevent carbon dioxide (CO₂) from entering the atmosphere. It captures CO₂ emissions from places like power plants, cement factories, and steel mills. This happens before the emissions can add to global warming.
A related term is Carbon Capture, Utilization, and Storage (CCUS). It takes things further by using captured CO₂ in products like synthetic fuels, building materials, or plastics.
The key difference between CCS and CCUS lies in the “U” — utilization. In CCS, the captured CO₂ is permanently stored underground, while in CCUS, part or all of that CO₂ is repurposed for industrial use before storage.
This technology helps fight climate change. It can reduce emissions from hard-to-decarbonize industries. The Intergovernmental Panel on Climate Change (IPCC) and the International Energy Agency (IEA) both recognize CCS as a critical tool for achieving net-zero targets.
Global climate agreements, like those at the annual UN Climate Change Conferences (COP), stress that CCS is key to limiting global temperature rise to below 1.5°C.
How Carbon Capture Works: A Step-by-Step Process
CCS works in three main stages — capture, transport, and storage — with an optional fourth step for utilization. Let’s break down each one of them.
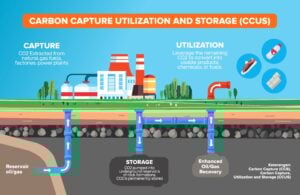
- Capture: The process starts by separating CO₂ from other gases produced during industrial processes or electricity generation. This can be done at power plants, cement kilns, oil refineries, and other facilities. Special chemical solvents, membranes, or advanced filters are used to remove CO₂ from flue gas or fuel before combustion.
- Transport: Once captured, CO₂ must be moved to a storage or utilization site. The most common method is through high-pressure pipelines. In some cases, ships or even trucks carry CO₂ over long distances, especially if storage sites are far from industrial hubs.
- Storage: For permanent storage, CO₂ is injected deep underground into geological formations such as saline aquifers or depleted oil and gas fields. These sites are chosen for their ability to trap CO₂ securely for thousands of years, with monitoring systems in place to detect any leaks.
- Utilization: In CCUS projects, some or all of the captured CO₂ is reused instead of being stored immediately. It can be converted into synthetic fuels, used in making cement and plastics, or even injected into greenhouses to boost plant growth. While utilization does not always result in permanent storage, it can reduce the need for fossil-based raw materials.
Tech Toolbox: The Many Ways of Capturing Carbon
CCS is not a single technology. Different methods are used depending on the type of facility, the fuel being used, and the stage at which CO₂ is removed. The main types are:
Post-combustion capture: This is the most common method today. CO₂ is removed from the exhaust gases after fuel has been burned. Chemical solvents or filters separate the CO₂ from other gases before it is compressed for transport.
Pre-combustion capture: Here, the fuel is treated before it is burned. The process converts the fuel into a mixture of hydrogen and CO₂. The CO₂ is separated and stored, while the hydrogen can be used to produce energy without direct emissions.
Oxy-fuel combustion: In this method, fuel is burned in pure oxygen instead of air. This creates a stream of exhaust that is mostly CO₂ and water vapor, making it easier to capture the CO₂.
Direct Air Capture (DAC): DAC removes CO₂ from the air instead of just one source. It uses big fans and chemical filters to do this. It can be used anywhere but requires more energy because CO₂ in the air is less concentrated.
As of end-2024, around 53 DAC plants were expected to be operational globally, rising to 93 by 2030 with a capacity of 6.4–11.4 MtCO₂/year.
Bioenergy with CCS (BECCS): This approach combines biomass energy production with carbon capture. Plants absorb CO₂ while growing, and when the biomass is burned for energy, the emissions are captured and stored. This can result in “negative emissions,” removing CO₂ from the atmosphere.
Global Race: Which Countries Are Winning CCS Leadership
Carbon capture and storage is now a reality. It’s in operation in many countries, with numerous projects either planned or being built. CCS technology is still new compared to global emissions. But momentum is growing.
Governments, industries, and investors are now committing to large-scale deployment. CCS capacity differs between regions:

United States
The U.S. leads CCS deployment, holding about 40% of global operational capacity. By mid-2024, facilities captured roughly 22–23 Mt CO₂ annually. Growth is driven by the expanded 45Q tax credit under the Inflation Reduction Act, rewarding storage and utilization. Flagship projects include Petra Nova in Texas and Midwest CCS hubs serving ethanol, fertilizer, and industrial sites.
Canada
Canada hosts pioneering projects like Boundary Dam (the world’s first commercial coal CCS) and Quest in Alberta, capturing CO₂ from hydrogen linked to oil sands. National capacity is ~4 Mt per year, supported by a federal CCS investment tax credit targeting heavy industry and clean hydrogen.
Norway
Norway has led offshore CO₂ storage since the Sleipner project began in 1996, injecting ~1 Mt annually into a saline aquifer. The Northern Lights project, part of Longship, will create a shared CO₂ transport and storage network for European industries.
China
China’s CCS capacity grew from ~1 Mt/year in 2022 to over 3.5 Mt in 2024, mainly in coal-to-chemicals, gas processing, and EOR. CCS is now part of national climate strategies, signaling rapid expansion.
United Kingdom
The UK’s cluster model links industries via shared pipelines and offshore storage. The East Coast Cluster and HyNet, due late 2020s, could together capture over 20 Mt CO₂ annually.
Australia
Australia’s ~4 Mt/year capacity includes the massive Gorgon gas-linked CCS facility in Western Australia, despite operational setbacks. With vast geological storage potential, the country aims to be a CO₂ storage hub for Asia’s export industries.
Total Operational Capacity and Growth
As of 2024, global CCS facilities in operation had a combined capture capacity of just over 50 million tonnes of CO₂ per year. This shows steady growth, up from about 40 Mt a few years ago. However, it still accounts for just a small part of the over 40 billion tonnes of CO₂ emitted worldwide each year.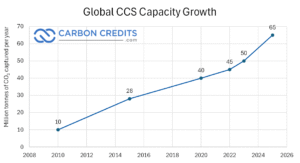
However, the project pipeline is expanding quickly. The facilities being built will double the current capacity. Early development projects might raise global capacity to over 400 million tonnes per year by the early 2030s if they stay on track.
The Rise of CCS Hubs and Clusters
A key trend in the industry is the creation of CCS hubs—shared infrastructure networks where multiple companies use the same transport and storage systems. This model lowers costs and speeds up deployment by avoiding the need for every facility to build its own pipeline or storage site.
The U.S. Midwest ethanol corridor, Norway’s Northern Lights, and the UK’s industrial clusters are among the most advanced examples. These hubs usually form close to industrial areas. Here, emissions are high, and the current infrastructure, like pipelines and ports, can be adjusted for CO₂ transport.
Why CCS Matters in the Climate Fight
Carbon capture and storage is not meant to replace renewable energy or other climate solutions. Instead, it focuses on the toughest parts of the emissions problem—places where cutting CO₂ is especially hard or expensive. Experts call these hard-to-abate sectors.
Hard-to-Abate Sectors
Some industries can’t simply switch to clean electricity. For example, making steel requires very high heat and chemical reactions that release CO₂. Cement production also releases CO₂ as a byproduct of making clinker, the key ingredient in concrete.
Chemical plants and refineries have complex processes that generate large amounts of CO₂. Even aviation faces limits, since planes can’t yet fly long distances on batteries alone. CCS can capture emissions from these sources. This helps reduce climate impact while keeping production running.
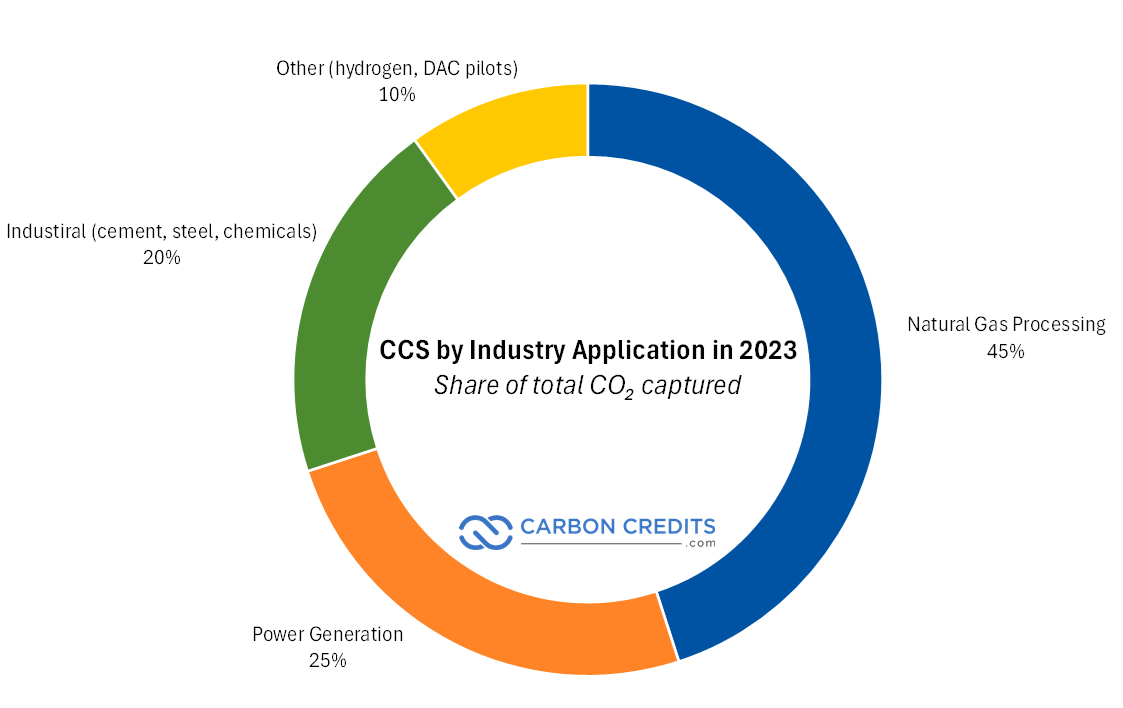
Here is the technology’s application in various industries:
Role in Meeting the 1.5°C Target and Net-Zero by 2050
To avoid the worst effects of climate change, scientists say global warming must be kept to 1.5°C above pre-industrial levels. That means reaching net-zero emissions by around 2050.
The Intergovernmental Panel on Climate Change (IPCC) has run hundreds of models to see how this can be done. In most scenarios, CCS plays a key role. Without it, the cost of meeting climate targets could rise by 70% or more, because other solutions would have to carry the full load.

Synergies with Clean Hydrogen, Carbon Markets, and Industrial Strategy
CCS also works well with other low-carbon solutions. CCS captures CO₂ that would escape when producing clean hydrogen, especially “blue hydrogen” from natural gas. This creates a cleaner fuel for use in transport, heating, and industry.
In carbon markets, CCS can generate credits for each tonne of CO₂ captured and stored. These credits can be sold to companies looking to offset their emissions. Governments are also linking CCS to industrial strategy by building shared hubs and pipelines. These will serve multiple factories, power plants, and fuel producers. This makes CCS cheaper and faster to deploy.
Endorsements from the IEA and UN
The International Energy Agency (IEA) calls CCS “critical” for reaching net zero, especially in heavy industry. It estimates the world will need to store 1.2 billion tonnes of CO₂ each year by 2050.
The United Nations also recognizes CCS in its climate plans. It has been featured in multiple COP agreements as a key technology for both reducing emissions and removing CO₂ from the atmosphere. These endorsements matter because they help drive policy support, funding, and international cooperation.
CCS Investment and Financing: How Much Does It Cost?
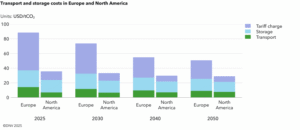
Carbon capture and storage can make a big impact on emissions. But it comes with a high price tag. Most projects cost between $50 and $150 for every tonne of CO₂ (and even over $400 for some technologies) captured and stored.
The lower end usually applies to large industrial sites near storage locations. The higher end often applies to smaller or more complex projects, or those that require long transport pipelines.
Government Support
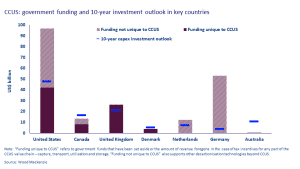
Governments play a key role in making CCS affordable. In the U.S., the 45Q tax credit offers up to $85 per tonne for CO₂ stored underground and $60 per tonne for CO₂ used in other industrial processes.
Canada provides an Investment Tax Credit (ITC) covering up to 50% of eligible CCS costs. In Europe, the Innovation Fund supports early-stage CCS and other low-carbon projects, offering billions in grants.
Blended Finance and Partnerships
Because CCS is expensive, many projects rely on blended finance—a mix of public and private funding. Oil and gas companies invest in cutting carbon emissions. Meanwhile, governments help by offering grants and tax breaks.
Public-private partnerships are common, especially for shared CCS hubs where multiple companies use the same pipelines and storage sites. International lenders, such as the World Bank and the Asian Development Bank, are funding CCS in emerging economies.
Voluntary Carbon Market (VCM)
CCS can also generate carbon removal credits for sale in the voluntary carbon market. These credits are purchased by companies aiming to offset their emissions.
While VCM prices vary, high-quality removal credits often sell for $100 per tonne or more, making them a potential revenue stream for CCS operators. Market demand for CCS-based credits is still growing. It relies on trust in the technology’s monitoring and verification.
Investor Angle: How to Invest in the CCS Industry
Interest in carbon capture and storage is rising among ESG, climate tech, and energy transition investors. The global CCS market was valued at about $4.5 billion in 2023 and could grow to more than $20 billion by 2033, according to industry forecasts. This growth is being driven by stricter climate policies, corporate net-zero pledges, and rising carbon prices.
Public Stocks
Investors can buy shares in companies directly involved in CCS. Examples include Aker Carbon Capture (Norway), Occidental Petroleum (U.S.), Air Liquide (France), and ExxonMobil.
Many oil and gas majors now see CCS as essential to keeping their assets viable in a low-carbon future. These firms are investing billions in CCS hubs and carbon removal partnerships.
Private Startups
Private markets offer exposure to emerging technologies like DAC. Leading firms include Climeworks (Switzerland), CarbonCapture (U.S.), and Heirloom (U.S.).
DAC projects are smaller today but attract premium interest from tech backers and climate-focused venture capital. In 2022 alone, DAC startups raised over $1 billion in funding.
ETFs and Funds
There are also climate-focused ETFs and funds that include carbon removal technologies as part of their portfolios. These funds reduce risk by investing in various companies. They focus on CCS, renewable energy, hydrogen, and other low-carbon solutions.
Carbon Credit Markets
Some investors buy into CCS through the carbon credit market. This can be done by funding CCS or DAC projects that issue carbon removal credits.
Platforms like Puro.earth and CIX (Climate Impact X) connect investors with verified carbon removal projects. Credits from high-quality CCS projects can fetch $100–$200 per tonne depending on location and verification standards.
Due Diligence
Before investing, it is important to check policy risk, technology readiness, cost curves, and scalability. CCS works best in large industrial hubs with access to geological storage. Finally, watch these key sectors because they will likely drive demand and scale for CCS:
- The oil & gas sector uses CCS for enhanced oil recovery and to lower its emissions.
- Cement firms need CCS because their production process emits CO₂ that can’t be avoided easily.
- Hydrogen—especially blue hydrogen—depends on CCS to cut its carbon footprint.
- DAC startups aim to remove CO₂ directly from the air and may sell high-value removal credits.
- And carbon marketplaces and registries will shape how removal credits are priced and trusted.
These areas have the most potential to scale quickly as policies tighten and carbon prices rise.
Risks, Challenges, and Criticism of CCS
While CCS has strong potential as a climate solution, it faces several challenges that investors, policymakers, and project developers must consider.
- High Capital Costs and Slow ROI: Large CCS projects cost hundreds of millions to billions of dollars. At $50–$150 per tonne captured, returns depend on strong policy support, carbon pricing, or premium credits, with payback periods often spanning years.
- Energy Requirements and Lifecycle Emissions: CCS uses significant energy, sometimes from fossil fuels. Without low-carbon power, net emissions savings shrink, making efficiency improvements essential.
- Storage Risks: Leakage, Permanence, and Monitoring: Geological storage is generally safe, but leakage is possible. Continuous monitoring ensures CO₂ remains underground for centuries.
- Debate Over Fossil Fuel Dependency vs. Genuine Decarbonization: Critics say CCS can prolong fossil fuel use. Supporters argue it’s vital for industries like cement and steel.
- Policy Uncertainty and Lack of Global Standards: Policy changes can undermine project economics. The absence of global CO₂ measurement standards adds risk to cross-border investments.
Market Outlook (2024–2030): What’s Next for CCS?
The world is gearing up for a big expansion in carbon capture and storage. But just how fast will CCS grow—and what could power that growth?
Growing CCS Pipeline and Capacity
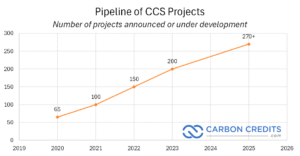
Momentum is clearly building. The Global CCS Institute reports a record 628 projects in the pipeline—an increase of over 200 from the previous year.
The expected annual capture capacity from these projects is 416 million tonnes of CO₂. This amount has been growing at a 32% rate each year since 2017. Once the current construction is completed, operational capacity is set to double to more than 100 Mt per year.
Similarly, the IEA sees global capture capacity rising from roughly 50 Mt/year today to about 430 Mt/year by 2030, with storage capability reaching 670 Mt/year.
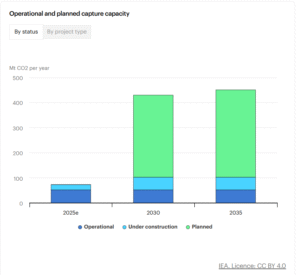
Still, this is only a start. To meet global climate goals, CCS will need to scale much more, lasting into the billions of tonnes annually.
Policies Fueling Momentum
Governments are shoring up policy support to accelerate CCS rollout. Here are the regional trends so far:
- In the U.S., the Inflation Reduction Act (IRA) expanded the 45Q tax credit—making CCS more financially appealing for project developers.
- The EU’s Net-Zero Industry Act and updated Industrial Carbon Management Strategy aim to help the region capture at least 50 Mt by 2030, rising to 280 Mt by 2040.
- Across the Asia-Pacific, countries like Australia are positioning themselves as carbon storage hubs. With strong geology and policy backing, Australia could generate over US$500 billion in regional carbon storage revenue by 2050.
Corporate Buyers Powering Demand
Major companies are not just talking—they’re signing deals:
- Microsoft stands out as a leading buyer of carbon removal credits. It has contracted close to 30 million tonnes. This includes 3.7 million tonnes over 12 years with startup CO280 and 1.1 million tonnes in a 10-year deal with Norway’s Hafslund Celsio project.
- Shopify co-founded Frontier—a $925 million advance market commitment—with other big names like Stripe and Alphabet. It has also purchased over $80 million in carbon removal from startups using DAC, enhanced weathering, and other technologies.
These corporate purchases show a strong demand for CCS-backed removal credits. They also help build a stable market for project developers.
Carbon Pricing, ESG Rules, and Global Markets
CCS is also benefiting from broader climate market trends:
- Carbon pricing and trading systems globally are starting to include CCS credits. As prices rise, CCS projects can improve their economics.
- ESG reporting and net-zero commitments are increasing transparency and accountability. Firms are expected to show real results—CCS helps deliver that.
- The rise of international carbon markets and registries is creating standardized ways to value and certify carbon removals. This makes CCS credits more trustworthy and investable.
Quick Take
By 2030, CCS capacity could rise eightfold—from 50 million to over 400 million tonnes. This growth is being driven by government policy, big corporate offtake deals, and a maturing carbon credit market. While still far from what’s needed to fully tackle climate change, the CCS sector is clearly moving from pilot stage to commercial reality
The Role of CCS in a Net-Zero Future
CCS isn’t a silver bullet. It’s a vital tool that works with renewables, electrification, and nature-based solutions like reforestation.
Renewables stop future emissions. CCS tackles the emissions that still exist, especially from old infrastructure in steel, cement, and chemicals. These are costly and slow to replace.
CCS captures emissions at the source. This helps extend facility lifespans and supports climate goals. It’s especially important for economies with new industrial assets.

Beyond reduction, CCS can enable permanent carbon removal through direct air capture and bioenergy with CCS, storing CO₂ underground for centuries. These methods can offset hard-to-abate sectors such as aviation and agriculture.
Responsible deployment is key. It needs strong MRV standards, community engagement, and alignment with sustainability goals. This helps avoid delays in phasing out fossil fuels.
CCS, when used wisely, connects our current fossil fuel economy to a low-carbon future. It helps reduce emissions we can’t fully eliminate yet and gives us time to develop cleaner technologies.
CCS is Not a Silver Bullet—But a Vital Tool
Carbon capture and storage is not a cure-all for the climate crisis. No single technology can deliver net zero on its own, and CCS should be viewed as one tool in a broader decarbonization toolkit.
A balanced approach requires acknowledging both the potential and the limitations of CCS. The technology can cut emissions and even remove carbon permanently when it’s based on solid science, strong policies, and clear reporting.
However, overreliance or misuse—particularly if it delays the shift away from fossil fuels—risks undermining climate goals.
The pathway to net zero will demand a combination of innovation, investment, and urgency. Carbon capture and storage is part of that solution set, and with careful governance, sustained funding, and clear standards, it can help bridge the gap between today’s emissions reality and the low-carbon future we urgently need.
- FURTHER READING: Carbon Capture and Storage to Grow 4x by 2030: Is It a Turning Point for Climate Action?
The post What is Carbon Capture and Storage? Your Ultimate Guide to CCS Technology appeared first on Carbon Credits.

EU carbon credit claims changed on 27 September 2026, the day the Directive (EU) 2024/825 began to apply across the European Union. The change is narrow. It changes how a company can talk about the credits it buys. A product can no longer be called neutral on the strength of compensation alone; however, every specific, evidenced statement about what a company measured, reduced, and funded stays fully available.

The post Promoting Improved Cooking Practices in Nigeria appeared first on Terrapass.
