

The amount of forest lost around the world has reduced by millions of hectares each year in recent decades, but countries are still off track to meet “important” deforestation targets.
These are the findings of the Global Forest Resources Assessment – a major new report from the UN’s Food and Agriculture Organization – which says that an estimated 10.9m hectares (Mha) of land was deforested each year between 2015 and 2025.
This is almost 7Mha less than the amount of annual forest loss over 1990-2000.
Since 1990, the area of forest destroyed each year has halved in South America, although it still remains the region with the highest amount of deforestation.
Europe was the only region in the world where annual forest loss has increased since 1990.
Agriculture has historically been the leading cause of deforestation around the world, but the report notes that wildfires, climate change-fuelled extreme weather, insects and diseases increasingly pose a threat.
The Global Forest Resources Assessment is published every five years. The 2025 report compiles and analyses national forest data from almost every country in the world over 1990-2025.
Carbon Brief has picked out five key findings from the report around deforestation, carbon storage and the amount of forest held within protected areas around the world.
1. Rates of deforestation are declining around the world
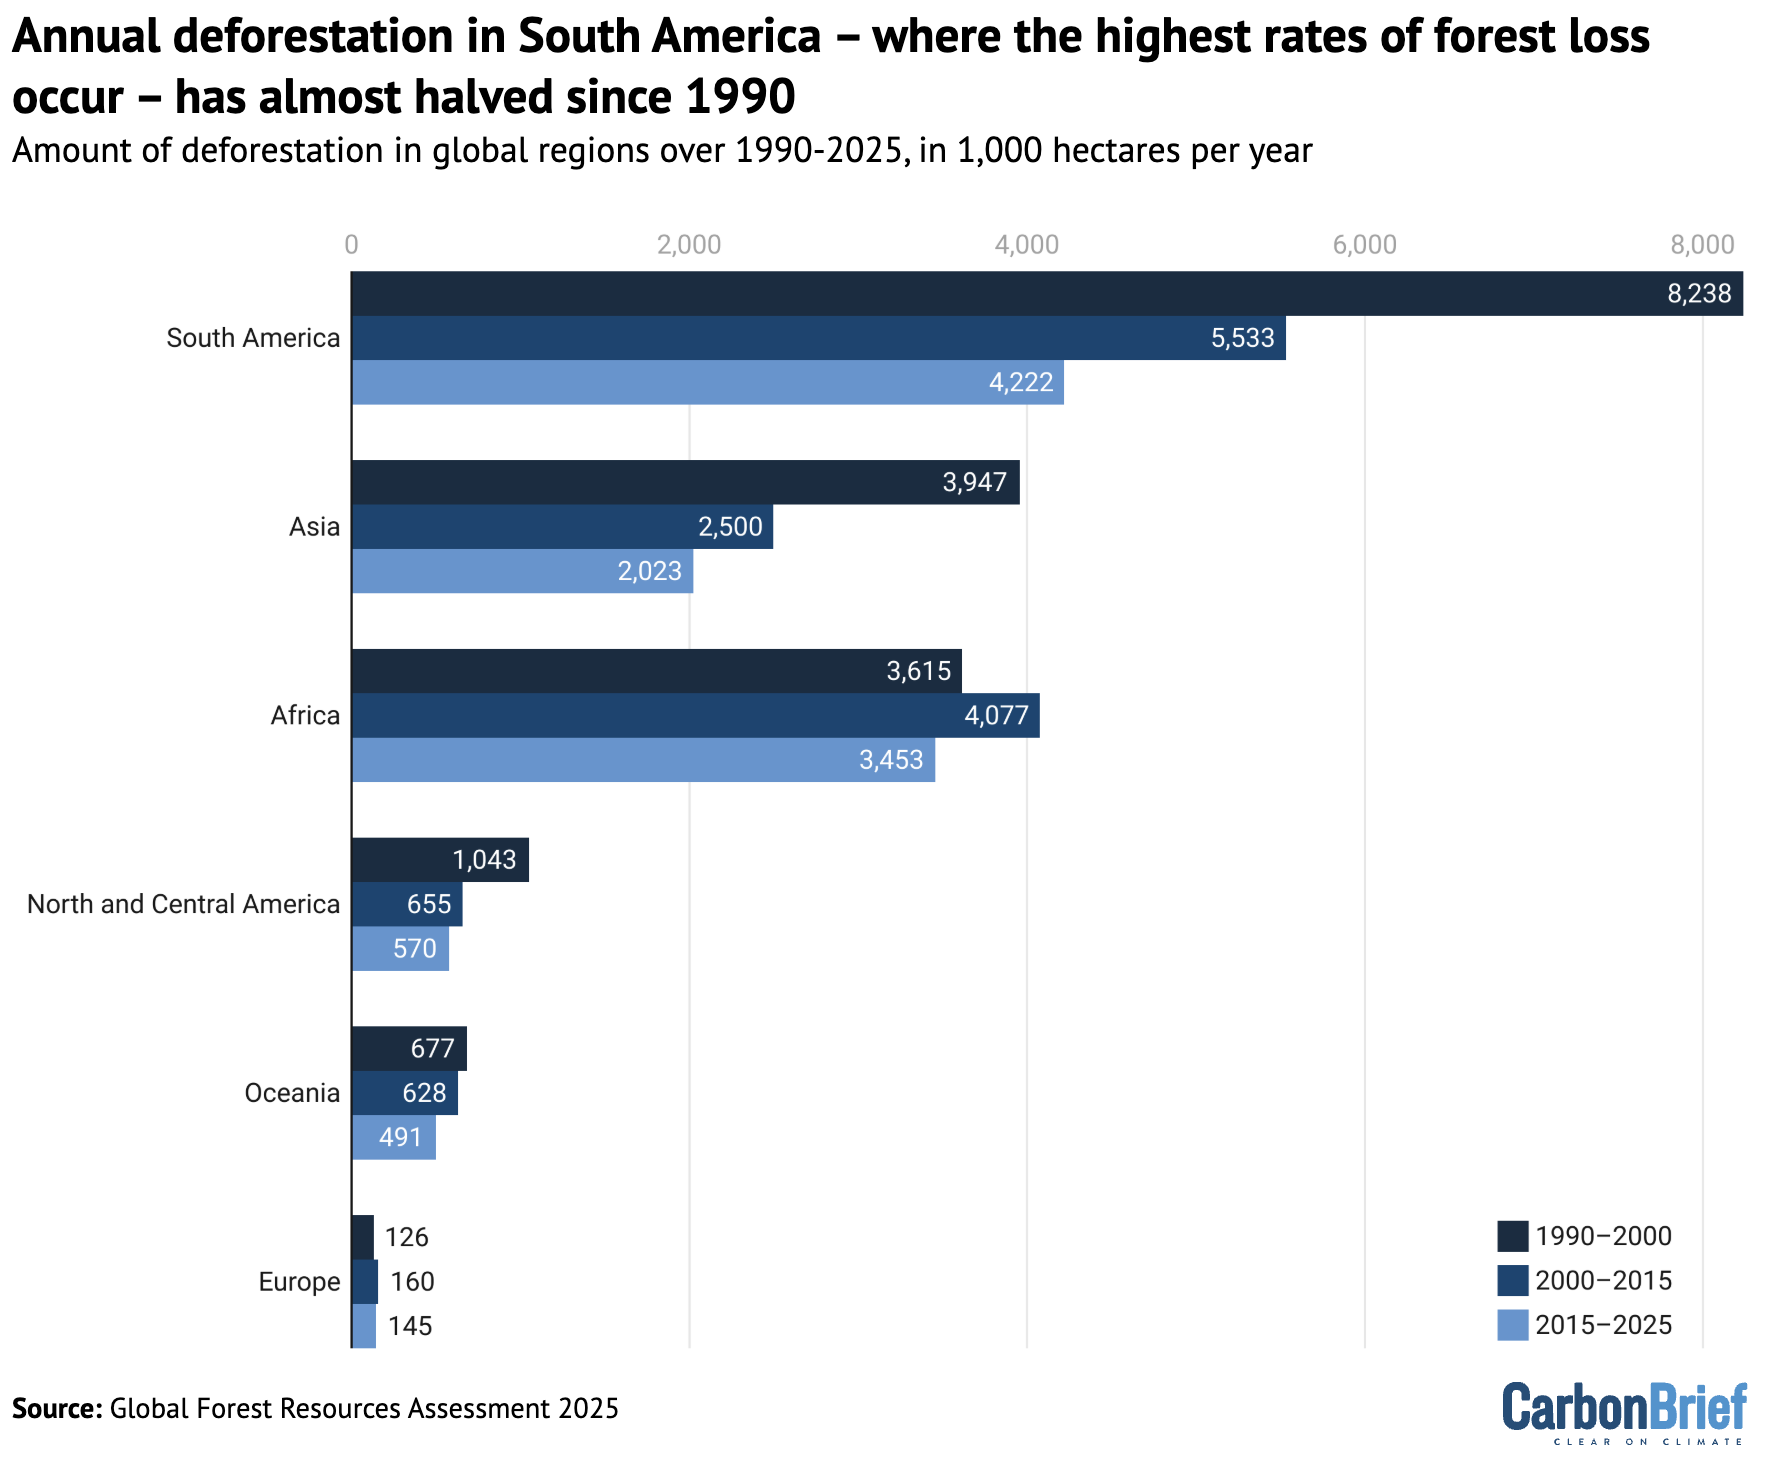
Rates of annual deforestation, in thousands of hectares, in South America, Asia, Africa, North and Central America, Oceania and Europe over 1990-2000 (dark blue), 2000-15 (medium blue) and 2015-25 (light blue). Source: Global Forest Resources Assessment 2025
In total, around 489Mha of forest have been lost due to deforestation since 1990, the new report finds. Most of this – 88% – occurred in the tropics.
This breaks down to around 10.9Mha of forest lost each year between 2015 and 2025, a reduction compared to 13.6Mha of loss over 2000-15 and 17.6Mha over 1990-2000.
Deforestation refers to the clearing of a forest, typically to repurpose the land for agriculture or use the trees for wood.
The chart above shows that South America experiences the most forest loss each year, although annual deforestation levels have halved from 8.2Mha over 1990-2000 to 4.2Mha over 2015-25.
Annual deforestation in Asia also saw a sizable reduction, from 3.9Mha over 1990-2000 to 2Mha over 2015-25, the report says.
Europe had the lowest overall deforestation rates, but was also the only region to record an increase over the last 35 years, with deforestation rates growing from 126,000 hectares over 1990-2000 to 145,000 hectares in the past 10 years.
Despite the downward global trend, FAO chief Dr Qu Dongyu notes in the report’s foreword that the “world is not on track to meet important global forest targets”.
In 2021, more than 100 countries pledged to halt and reverse global deforestation by 2030. But deforestation rates in 2024 were 63% higher than the trajectory needed to meet this 2030 target, according to a recent report from civil society groups.
The goals of this pledge were formally recognised in a key text at the COP28 climate summit in Dubai in 2023, which “emphasise[d]” that halting and reversing deforestation and forest degradation by 2030 would be key to meeting climate goals.
2. Global net forest loss has more than halved since 1990
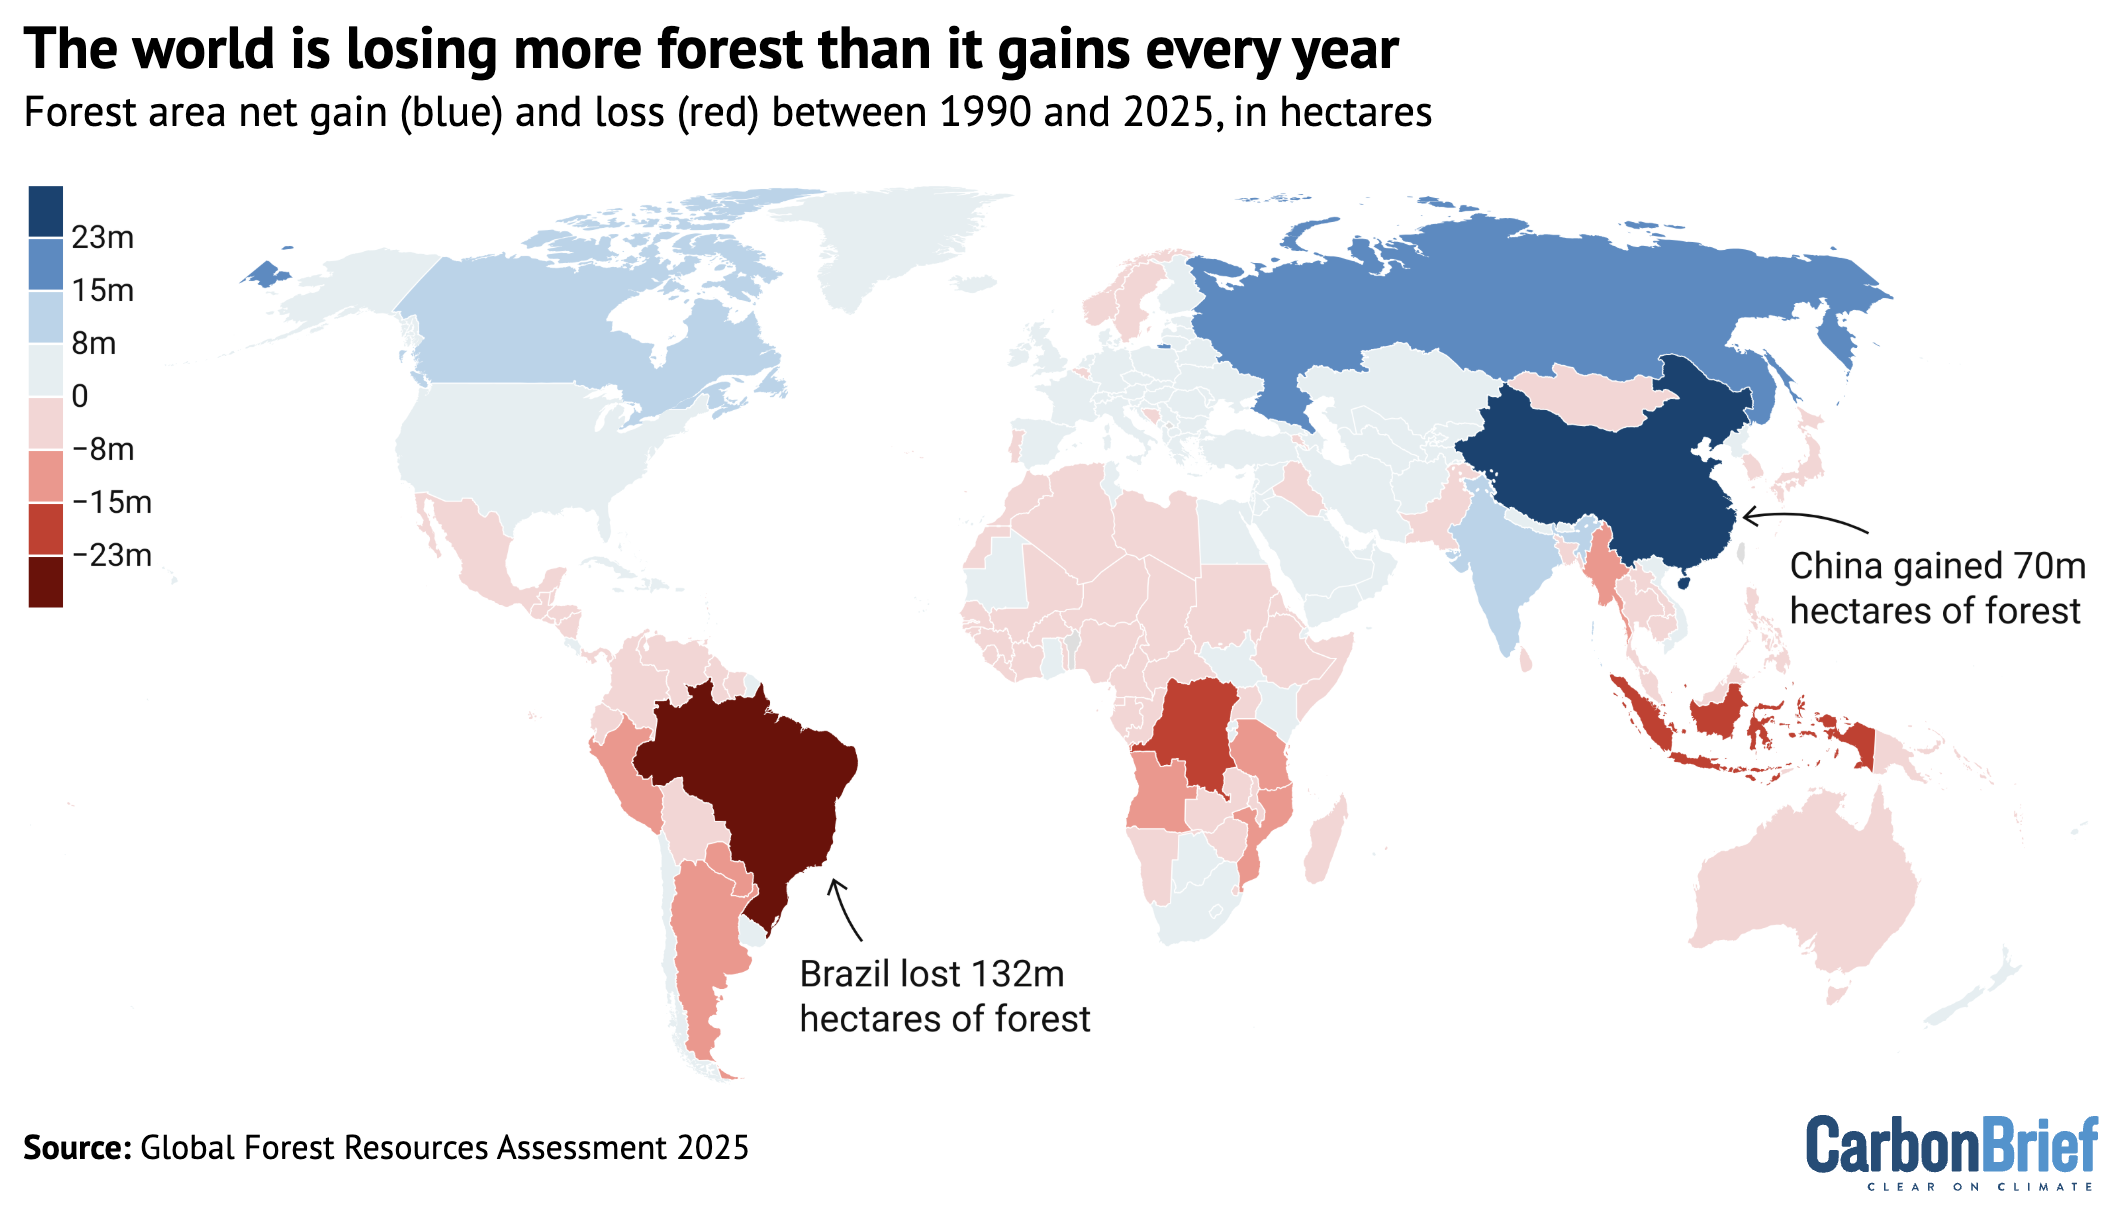
Forest area net change by country between 1990 and 2025, in hectares. Source: Global Forest Resources Assessment 2025
The new report finds that forests cover more than 4bn hectares of land, an area encompassing one-third of the planet’s land surface.
More than half of the world’s forested area is located in just five countries: Russia, Brazil, Canada, the US and China.
The map above shows that, overall, more forest is lost than gained each year around the world. There was 6.8Mha of forest growth over 2015-25, but 10.9Mha of forest lost.
The annual rate of this global net forest loss – the amount that deforestation has exceeded the amount regrown – has more than halved since 1990, dropping from 10.7Mha over 1990-2000 to 4.1Mha over 2015-25.
The report says this change was due to reduced deforestation in some countries and increased forest expansion in others. However, the rate of forest expansion has also slowed over time – from 9.9Mha per year in 2000-15 to 6.8Mha per year in 2015-25.
There are many driving factors behind continuing deforestation. Agriculture has historically been the leading cause of forest loss, but wildfire is increasingly posing a threat. Wildfires were the leading driver of tropical forest loss in 2024 for the first time on record, a Global Forest Watch report found earlier this year.
The new UN report says that an average of 261Mha of land was burned by fire each year over 2007-19. Around half of this area was forest. Around 80% of the forested land impacted by fires in 2019 was in the subtropics – areas located just outside tropical regions, such as parts of Argentina, the US and Australia.
The report notes that fire is widely used in land management practices, but uncontrolled fires can have “major negative impacts on people, ecosystems and climate”.
It adds that researchers gathered information on fires up as far as 2023, but chose to focus on 2007-19 due to a lack of more recent data for some countries.
A different report from an international team of scientists recently found that fires burned at least 370Mha of land – an area larger than India – between March 2024 and February 2025.
3. Many countries are hugely increasing their forest area
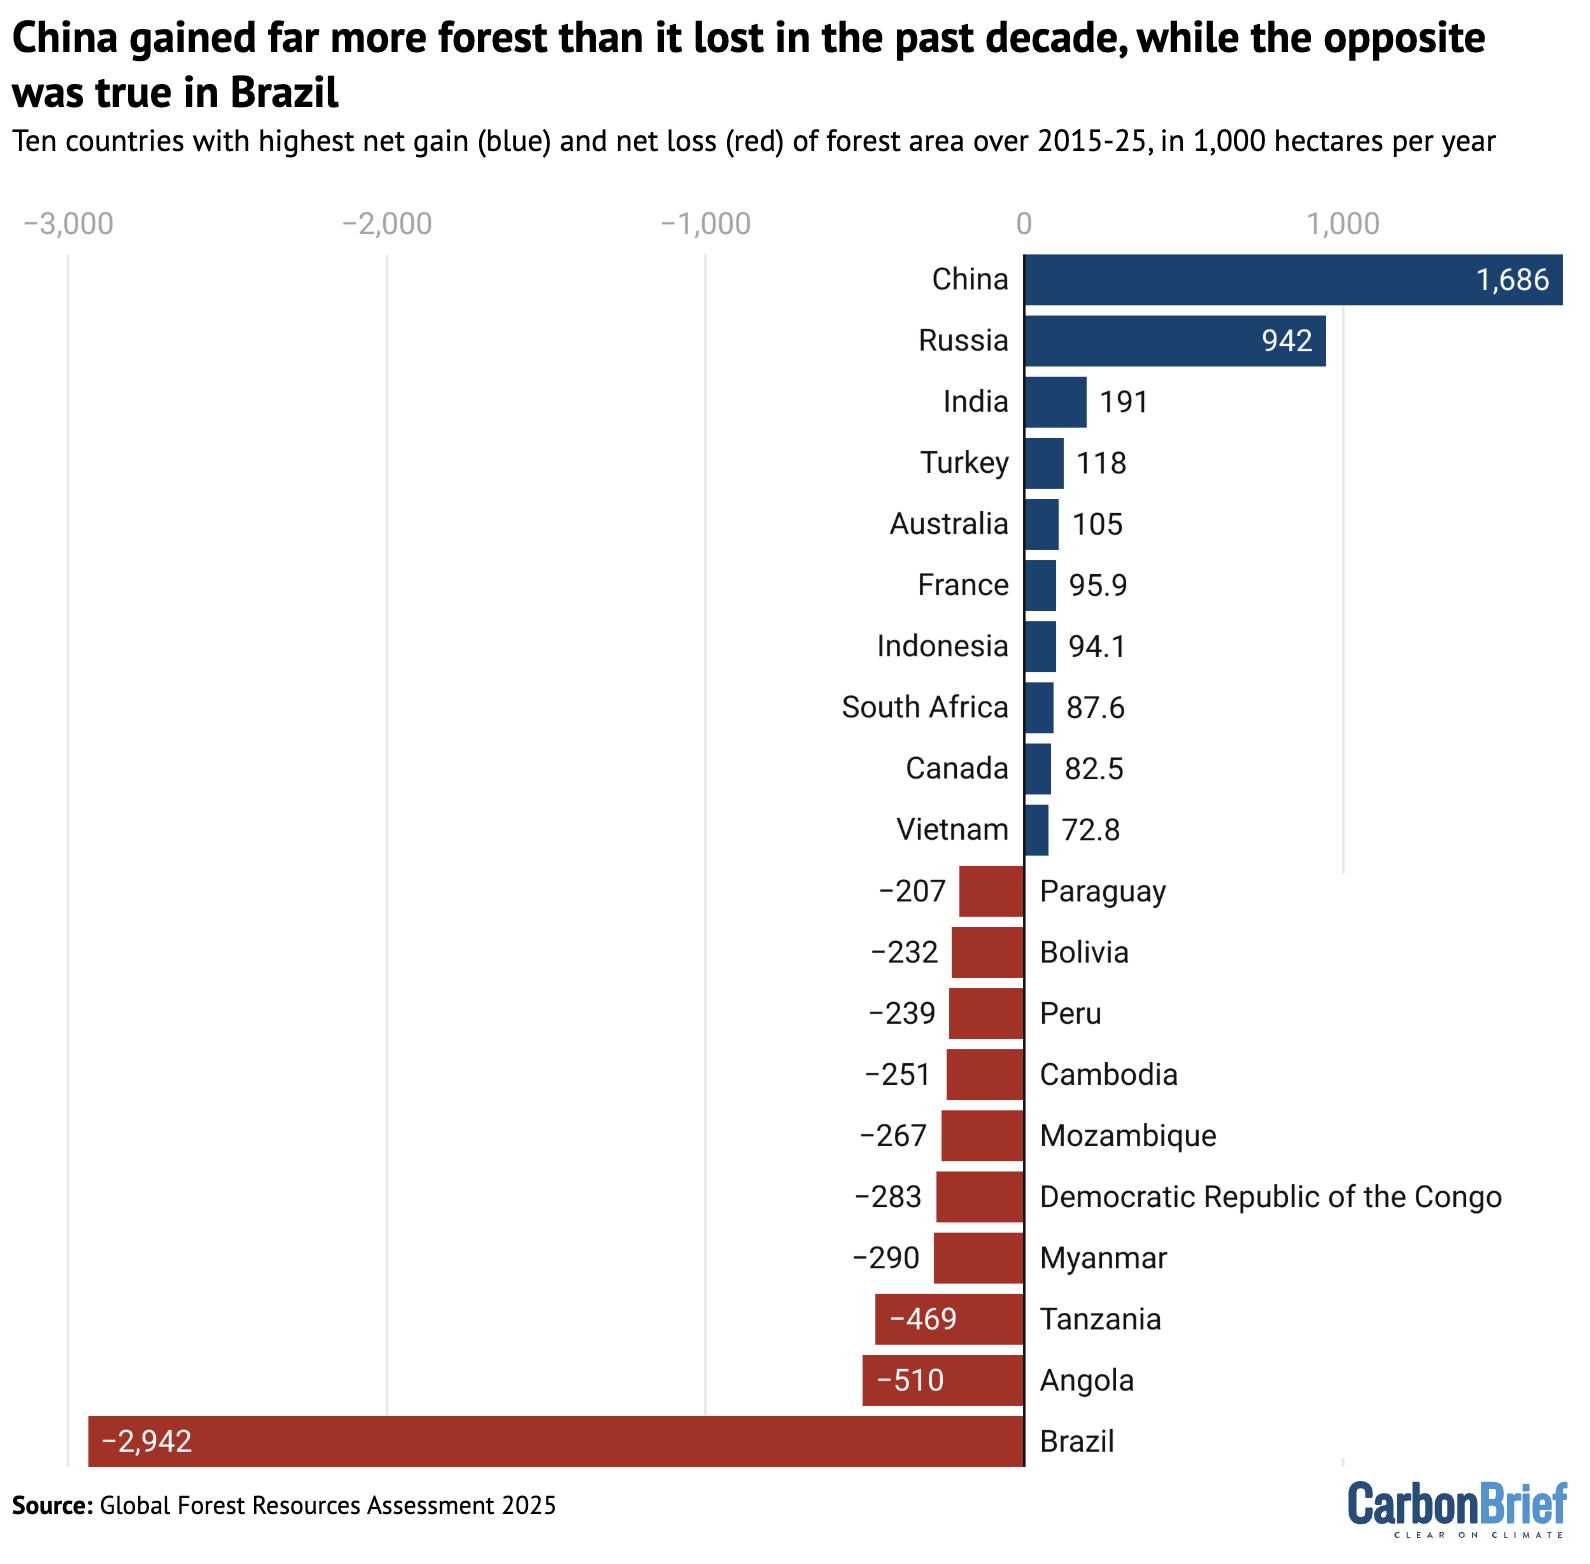
Top 10 countries for annual net gain (blue) and net loss (red) of forest area over 2015-25, in 1,000 hectares per year. Source: Global Forest Resources Assessment 2025
Globally, deforestation is declining, but the trend varies from country to country.
The chart above shows that some nations, such as China and Russia, added a lot more forest cover than they removed in the past decade through, for example, afforestation programmes.
But in other countries – particularly Brazil – the level of deforestation far surpasses the amount of forest re-grown.
Deforestation in Brazil dropped by almost one-third between 2023 and 2024, news outlet Brasil de Fato reported earlier this year, which was during the time Luiz Inácio Lula da Silva took over as president. The new UN report finds that, on average, Brazil lost 2.9Mha of forest area each year over 2015-25, compared to 5.8Mha over 1990-2000.
Russia’s net gain of forest cover increased significantly since 1990 – growing from 80,400ha per year in 1990-2000 to 942,000ha per year in 2015-25.
In China, although it is also planting significant levels of forest, the forest level gained has dropped over time, from 2.2Mha per year in 2000-15 to 1.7Mha per year in 2015-25.
Levels of net forest gain in Canada also fell from 513,000ha per year in 2000-15 to 82,500ha per year in 2015-25.
In the US, the net forest growth trend reversed over the past decade – from 437,000ha per year of gain in 2000-15 to a net forest loss of 120,000ha per year from 2015 to 2025.
Oceania reversed a previously negative trend to gain 140,000ha of forests per year in the past decade, the report says. This was mainly due to changes in Australia, where previous losses of tens of thousands of hectares each year turned into an annual net gain of 105,000ha each year by 2015-25.
4. The world’s forests hold more than 700bn tonnes of carbon
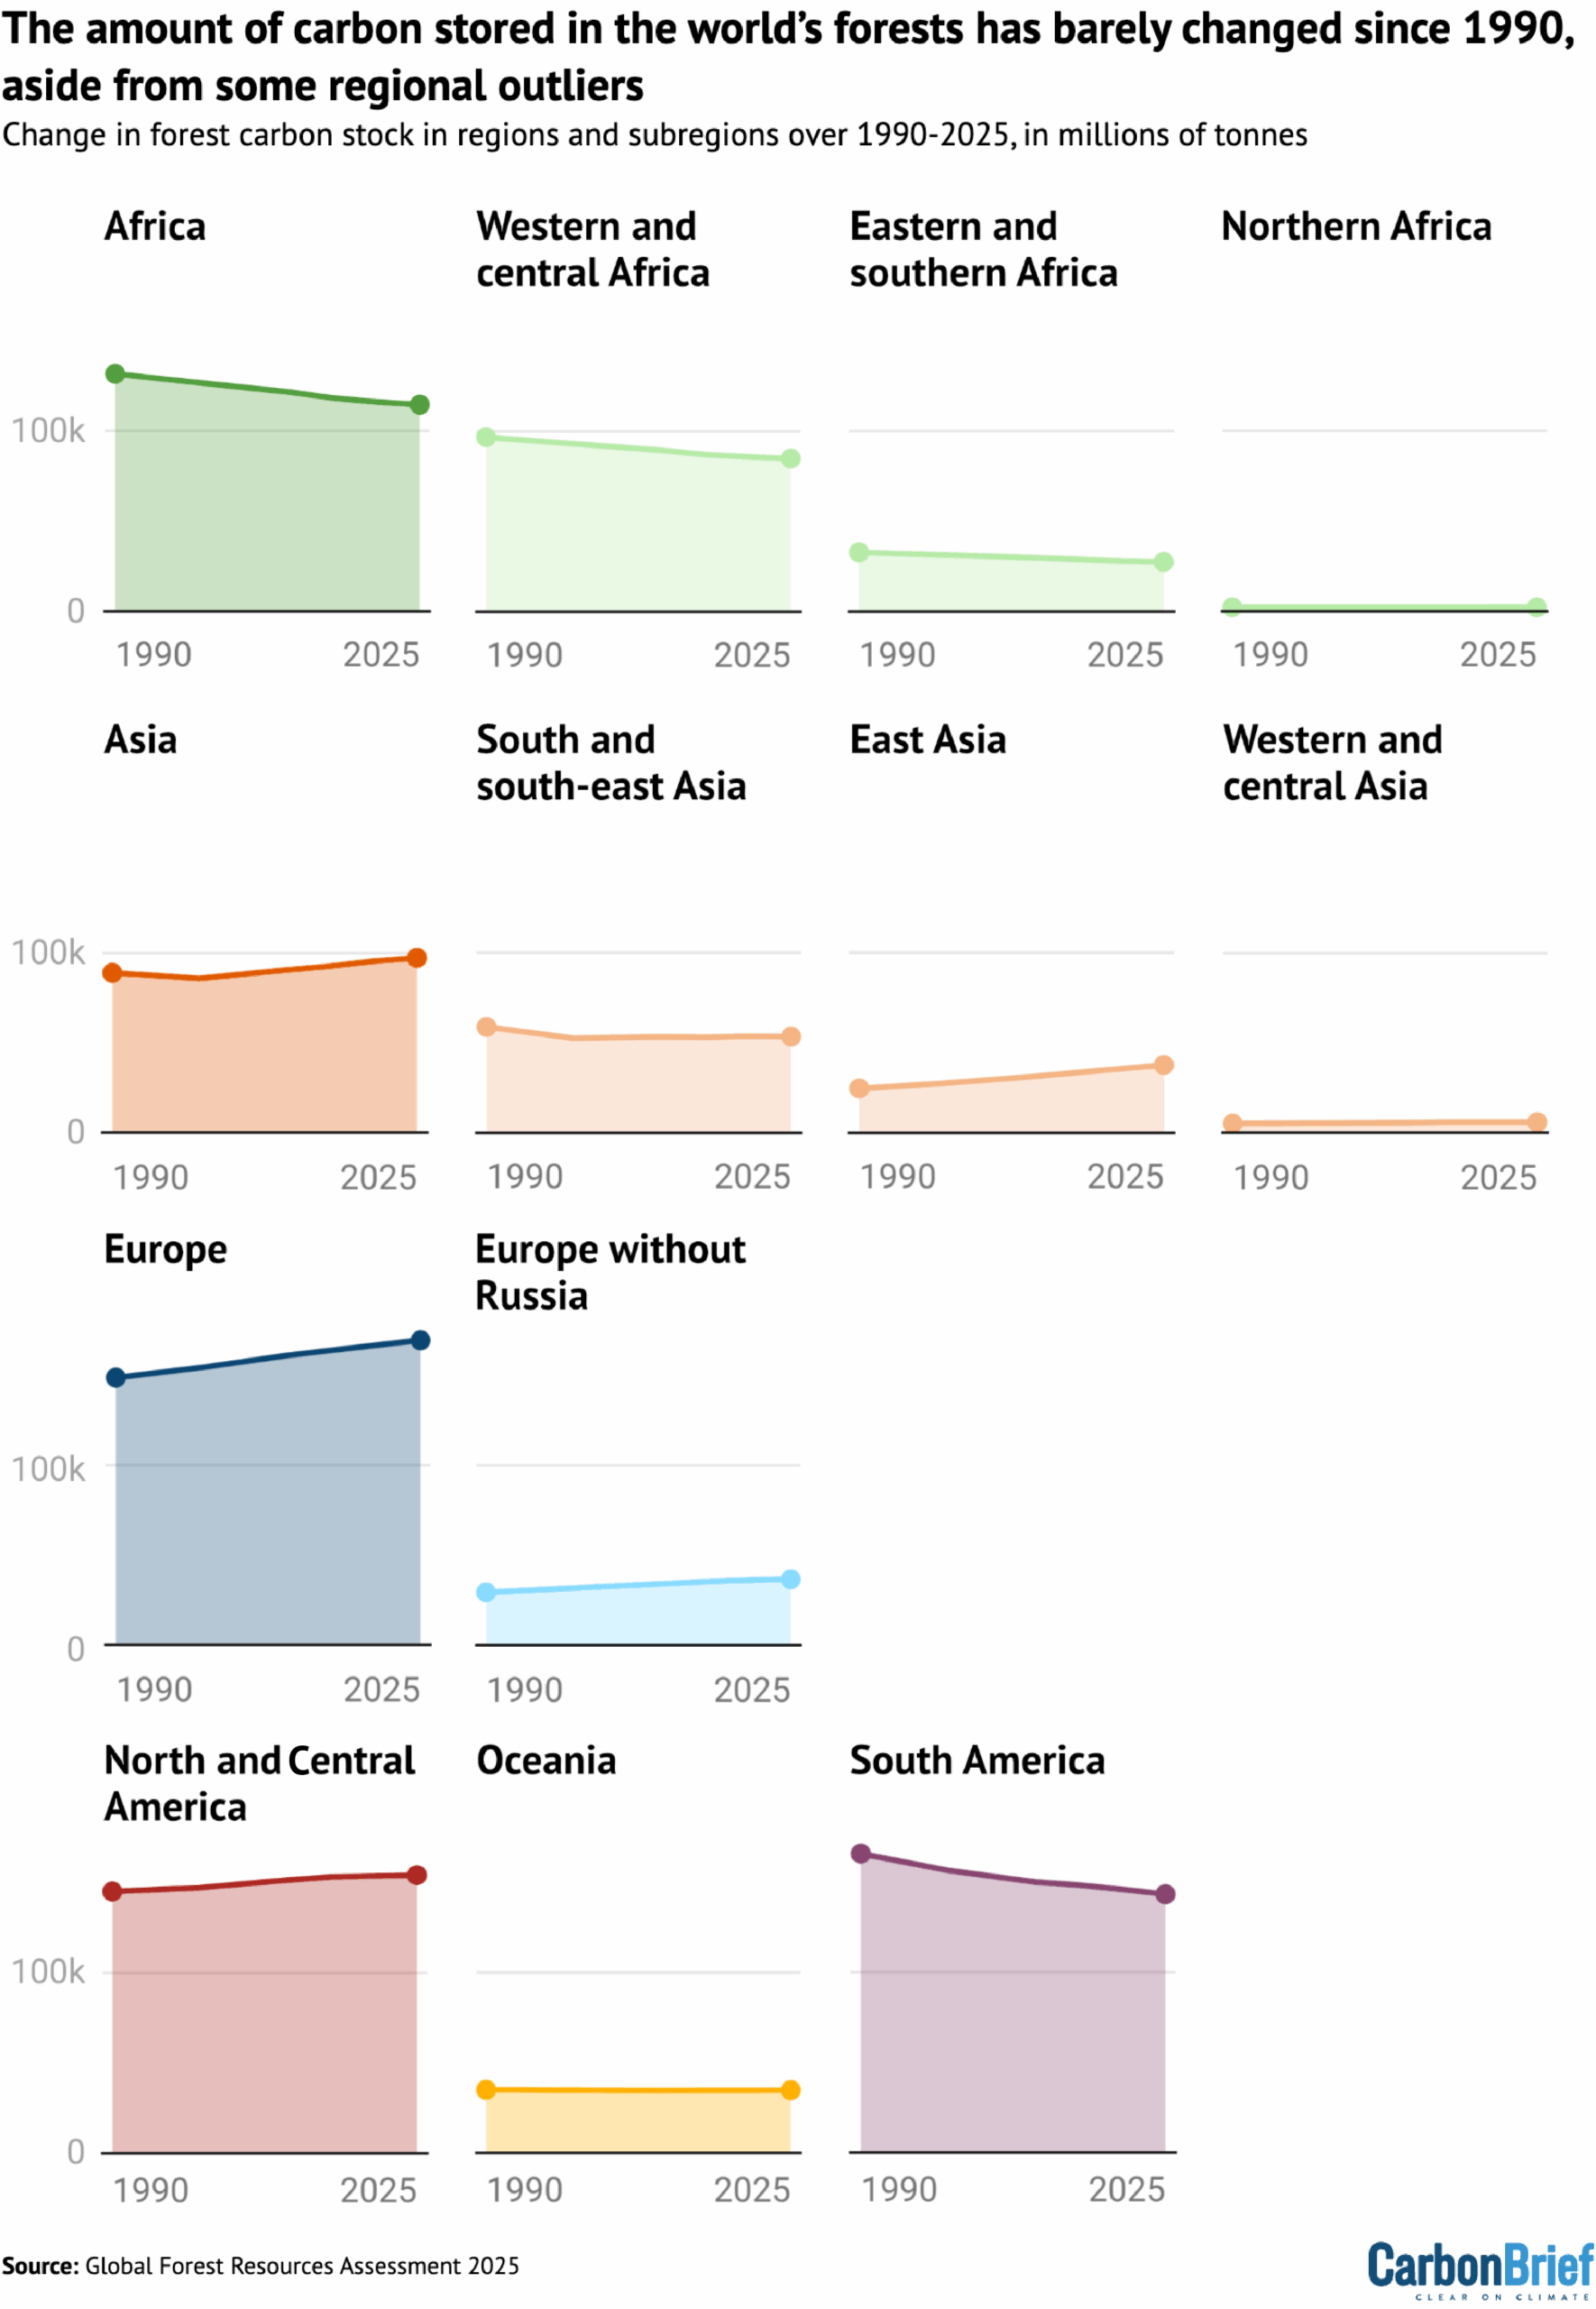
Changes in forest carbon stock by region and subregion of the world over 1990-2025. Source: Global Forest Resources Assessment 2025
The “carbon stock” of a forest refers to how much carbon is stored in its trees and soils. Forests are among the planet’s major carbon sinks.
The new report estimates that forests stored an estimated 714bn tonnes, or gigatonnes, of carbon (GtC) in 2025.
Europe (including Russia) and the Americas account for two-thirds of the world’s total forest carbon storage.
The global forest carbon stock decreased from 716GtC to 706GtC between 1990 and 2000, before growing slightly again by 2025. The report mainly attributes this recent increase to forest growth in Asia and Europe.
The report notes that the total amount of carbon stored in forests has remained largely static over the past 35 years, but with some regional differences, as highlighted in the chart above.
The amount of carbon stored in forests across east Asia, Europe and North America is “significantly higher” now due to expanded forest areas, but it is lower in South America, Africa and Central America.
Several studies have shown that there are limitations on the ability of forests to keep absorbing CO2, with difficulties posed by hotter, drier weather fuelled by climate change.
A 2024 study found that record heat in 2023 negatively impacted the ability of land and ocean sinks to absorb carbon – and that the global land sink was at its weakest since 2003.
Another study, published in 2022, said that drying and warming as a result of deforestation reduces the carbon storage ability of tropical forests, especially in the Congo basin and the Amazon rainforest.
5. Around one-fifth of the world’s forests are located in protected areas
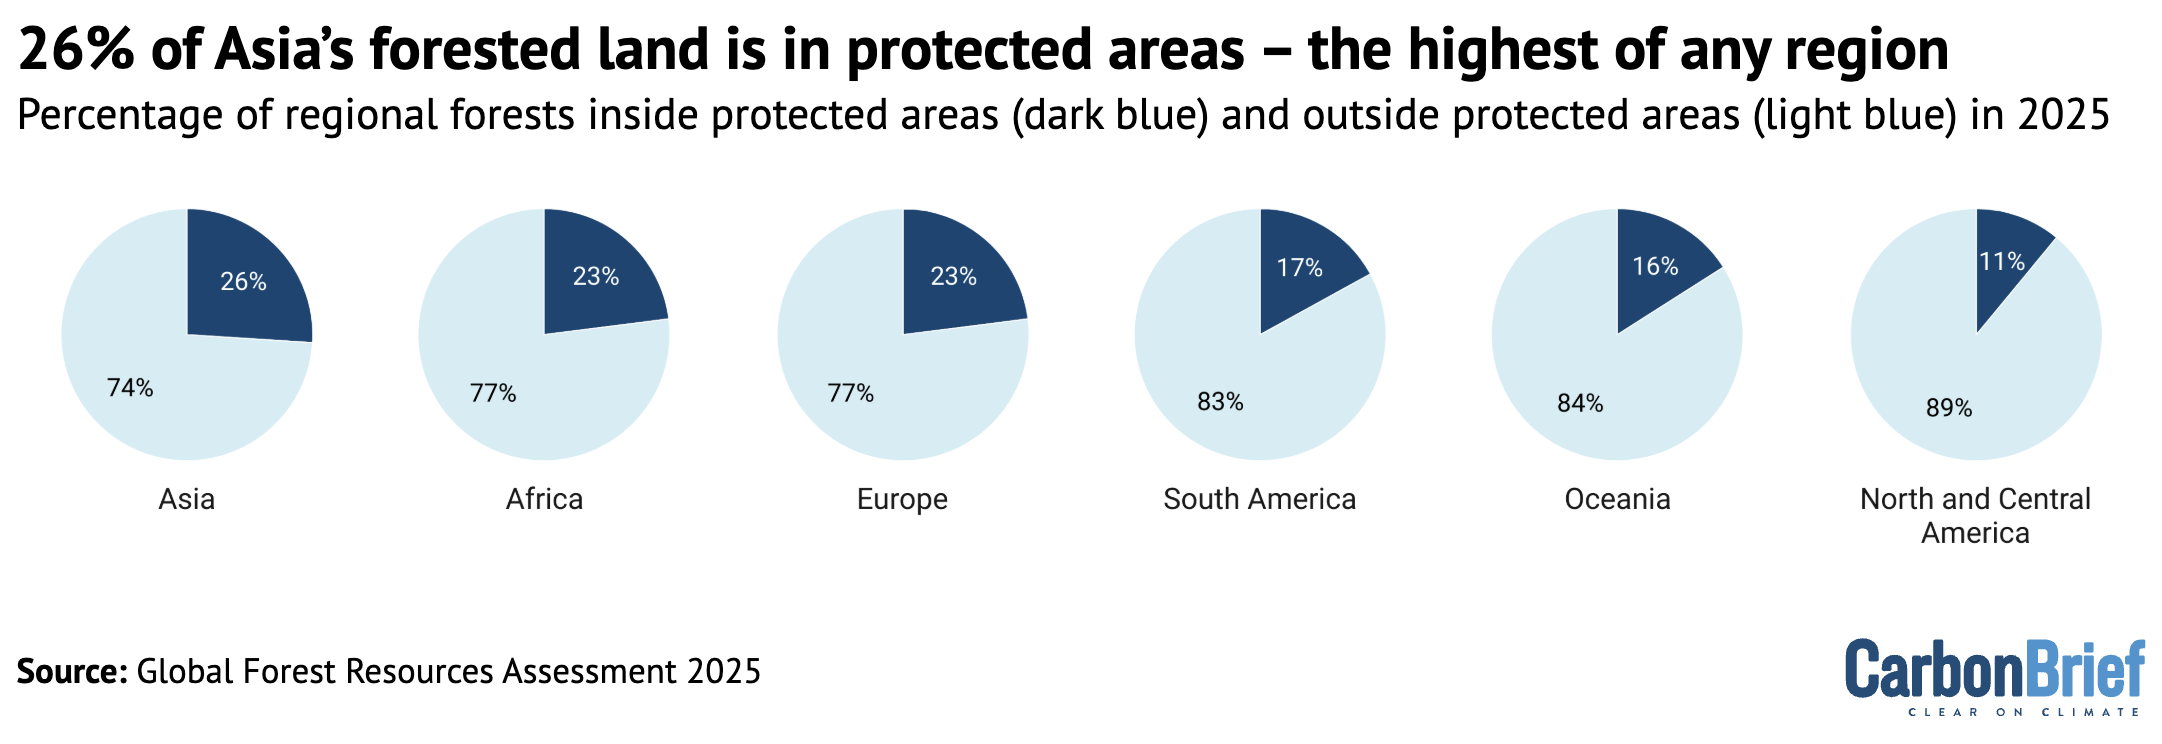
The percentage of forest land in Asia, Africa, Europe, South America, Oceania and North and Central America contained inside protected areas (dark blue) and outside protected areas (light blue) in 2025. Source: Global Forest Resources Assessment 2025
The amount of forested land located in protected areas increased across all regions between 1990 and 2025.
For an area to be considered “protected”, it must be managed in a way that conserves nature.
Around 20% of the world’s forests are located in these protected areas, the new report finds, which amounts to 813Mha of land – an area almost the size of Brazil.
Nearly every country in the world has pledged to protect 30% of the Earth’s land and sea by 2030. However, more than half of countries have not committed to this target on a national basis, Carbon Brief analysis showed earlier this year.
Almost 18% of land and around 8% of the ocean are currently in protected areas, a UN report found last year. The level is increasing, the report said, but considerable progress is still needed to reach the 2030 goal.
The new UN report notes that Europe, including Russia, holds 235Mha of protected forest area, which is the largest of any region and accounts for 23% of the continent’s total forested land.
As highlighted in the chart above, 26% of all forests in Asia are protected, which is the highest of any region. The report notes that this is largely due to a vast amount of protected forested land in Indonesia.
Three countries and one island territory reported that upwards of 90% of their forests are protected – Norfolk Island, Saudi Arabia, Cook Islands and Uzbekistan.

The post UN report: Five charts showing how global deforestation is declining appeared first on Carbon Brief.
UN report: Five charts showing how global deforestation is declining

Three countries have been named by the Paris Agreement’s compliance committee for failing to submit a nationally determined contribution (NDC) and repeatedly snubbing offers of help with their climate plans.
After months of internal debate over whether to identify serial non-responders, the Paris Agreement’s Implementation and Compliance Committee (PAICC) named the three countries which have failed to engage with it over their NDCs on Friday.
It named Democratic Republic of Congo, Senegal and North Korea in a footnote of its annual report, adding that it decided to name them “with a view to facilitating engagement”, adding that representatives of the three nations had been invited to its meeting in early 2027 “with the purpose of identifying any challenges and constraints”.
“The Committee noted the importance of Parties engaging with the Committee in a timely manner, while noting that some delays may be due to the national capabilities and circumstances of the Parties”, the report said.
-
Under US pressure, World Bank says it will back gas “where appropriate”
The US wants the World Bank to expand its gas support while climate campaigners are pushing for it to end – its head spoke this week of limited backing for the fossil fuel -
IPCC scientists vow to press on with climate reports despite political deadlock
After governments again failed to agree a timeline, nearly 120 IPCC authors pledged to complete their assessment on time and with full scientific rigour -
Paris Agreement committee snubbed over missing NDC climate plans
Many governments have still not submitted a nationally determined contribution to the UN, breaching a key requirement of the Paris Agreement



In July, PAICC said 12 countries had ignored its repeated attempts to discuss why they had not published an NDC as required every five years under the 2015 Paris accord.
Members of the committee had been divided over whether to name them, but at a September meeting decided to do so in their annual report to the annual climate COP summit.
By the time the report was published on Friday, only Congo, Senegal and North Korea “had not communicated an NDC or submitted a [Biennial Transparency Report] and had not yet responded to any of the Committee’s notifications, despite several reminders issued by the Committee in this regard”.
Rainforest and renewable energy ambitions
The silence from Congo and Senegal is notable because the former is home to much of the Congo Basin rainforest while the latter has sought billions of dollars in climate finance to support its renewable energy ambitions.
After Brazil, Congo has more rainforest than any country in the world. This forest, and the country’s peatlands, absorb huge amounts of greenhouse gas but are fast being lost to expanding farmland, charcoal production, logging and mining.
Senegal signed a Just Energy Transition Partnership with Canada and wealthy European nations in 2023, to help it meet its renewable energy targets under the-then government of Macky Sall. It was chair of the Least Developed Countries group between January 2022 and December 2023.

Tejas Rao, who is researching the PAICC as part of a doctoral thesis at Cambridge University, said the governments of the three countries should engage with the committee.
“Engagement costs these governments very little and the committee has shown it will listen,” he said.
“Silence leaves the committee with no basis to help, and it leaves the [governments] exposed to the narrative that they are simply disengaged,” he told Climate Home News.
Paris Agreement requirement
The 2015 Paris Agreement requires all parties to publish an NDC every five years outlining their emissions reduction targets, with each plan meant to be more ambitious than the country’s last NDC.
The latest set – the third round of plans, with new targets for 2035 – was due in February 2025. While most countries missed this deadline, all but around 30 – mostly small emitters but including Egypt, Vietnam and Argentina – have now submitted them.
Over the year, the PAICC – which is made up of government climate officials from developed and developing countries – has been communicating with governments that have not submitted NDCs and trying to overcome barriers to them doing so.
Some nations have cited exceptional circumstances as the reason for not submitting an NDC, a process that requires a significant amount of work in tracking emissions and consulting on how to curb them across the economy. For example, a letter from a Sudanese official to the PAICC, seen by Climate Home News, said that the country’s civil war had led to the suspension of its NDC preparation.
-
IPCC scientists vow to press on with climate reports despite political deadlock
After governments again failed to agree a timeline, nearly 120 IPCC authors pledged to complete their assessment on time and with full scientific rigour -
Under US pressure, World Bank says it will back gas “where appropriate”
The US wants the World Bank to expand its gas support while climate campaigners are pushing for it to end – its head spoke this week of limited backing for the fossil fuel -
Who shapes climate science? The equity question facing the IPCC
Early completion of the next global climate science assessment reports risks excluding research from the Global South, which is key to ensuring the findings are fair

The US and Iran are not signed up to the Paris Agreement and so do not have active NDCs, nor does Taiwan, which is not a UN member state.
Rao said that because the PAICC is “facilitative and non-punitive”, naming the countries “is meant to open a door, not close one – the invited consultation is the point”.
“In recent months, governments that explained their constraints, whether capacity, finance or domestic process, have been met with follow-up and support rather than sanction, and the number of silent governments has fallen sharply,” Rao said.
The post Paris Agreement committee names three countries snubbing it over NDCs appeared first on Climate Home News.
Paris Agreement committee names three countries snubbing it over NDCs