Keeping global warming to less than 2C above pre-industrial temperatures is “crucial” for limiting damage to the Antarctic Peninsula’s unique ecosystems, according to a new study.
The paper, published in Frontiers in Environmental Science, reviews the latest literature on the impacts of warming on Antarctica’s most biodiverse region.
The Antarctic Peninsula is home to many types of penguins, whales and seals, as well as the continent’s only two flowering plant species.
The study also analyses previously published data and model output to create a fuller picture of the potential futures facing the peninsula under different levels of global warming.
Under a low-emissions scenario that keeps global temperature rise to less than 2C, the Antarctic Peninsula will still face 2.28C of warming by the end of the century, the study says, while higher-emissions futures could push the region’s warming above 5C.
Limiting warming to 2C would avoid the more dramatic impacts associated with higher emissions, such as ice-shelf collapse, increasingly frequent extreme weather events and extinction of some of the peninsula’s native species, according to the paper.
However, warming of 4C would result in “dramatic and irreversible” damages, it adds.
Importantly, the paper shows that the outlook for the peninsula is “dependent on the choices we make now and in the near future”, a researcher not involved in the study tells Carbon Brief.
‘Alternative futures’
The Antarctic Peninsula juts northwards from West Antarctica, stretching towards the tip of South America.
The region is made up of the main peninsula, which spans around 232,000 square kilometres (km2) and a series of islands and archipelagos that cover another 80,000km2. The mainland peninsula is nearly entirely covered in ice, while its islands – many of which are further north – are around 92% covered.
Taken as a whole, the Antarctic Peninsula is the most biodiverse region of the icy continent, and a “beautiful, pristine environment”, says Prof Bethan Davies, a glaciologist at Newcastle University, who led the new work.
It hosts many species of penguins and whales, as well as apex predators, such as orcas and leopard seals. Each spring, more than 100m birds nest there to rear their young. It is also home to hundreds of species of moss and lichens, along with the only two flowering plant species on the continent.
The peninsula is also the part of Antarctica that is undergoing the most significant changes due to climate change, according to the Intergovernmental Panel on Climate Change’s (IPCC’s) sixth assessment report.
In 2019, a group of researchers published a study on the fate of the Antarctic Peninsula at 1.5C of global warming above pre-industrial temperatures. However, it has since “become apparent” that keeping warming below this limit is no longer in reach, Davies says.
The team selected three warming scenarios for their study:
- a low-emissions scenario, SSP1-2.6
- a high-emissions scenario characterised by growing nationalism, SSP3-7.0
- a very-high-emissions scenario, SSP5-8.5
SSP1-2.6 represents the “new goal” of keeping warming less than 2C, Davies says.
SSP3-7.0 and SSP5-8.5 represent “alternative futures” – with the former being one that “felt quite relevant” to the current state of the world and the latter being “useful to consider as a high end”, she adds.
For each potential future, the researchers conducted a literature review to assess the changes to different parts of the peninsula’s physical and biological systems. To fill gaps in the published literature, the team also reanalysed existing datasets and results from the Coupled Model Intercomparison Project 6 (CMIP6) group of models developed for the IPCC’s latest assessment cycle.
Dr Sammie Buzzard, a glaciologist at the Centre for Polar Observation and Modelling, tells Carbon Brief:
“By choosing three different emissions scenarios, they’ve shown just how much variability there is in the possible future of the Antarctica Peninsula that is dependent on the choices we make now and in the near future.”
Buzzard, who was not involved in the new study, adds that it “highlights the consequences of this [change] for the glaciers, sea ice and unique wildlife habitats in this region”.
Physical changes
The Antarctic Peninsula is already experiencing climate change, with one record showing sustained warming over nearly a century. The peninsula is also warming more rapidly than the global average.
For the new study, Davies and her team assess the changes in temperature for the decade 2090-99 across 19 CMIP6 models.
They find that under the low-emissions scenario, the Antarctic Peninsula is projected to warm by 2.28C compared to pre-industrial temperatures, or about 0.55C above its current level of warming. Under the high- and very-high-emissions scenarios, the peninsula will reach temperatures of 5.22C and 6.10C above pre-industrial levels, respectively.
They also analyse output from 12 sea ice models.
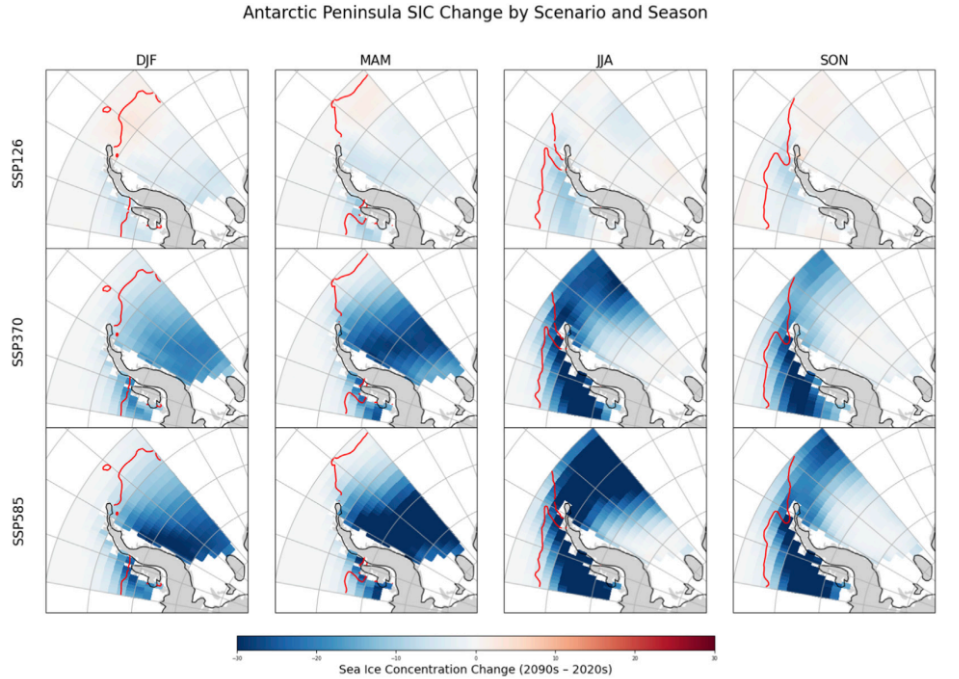
In each scenario, they find that the western side of the Antarctic Peninsula experiences the largest declines in sea ice concentration during the winter months of June, July and August. For the southern hemisphere’s summertime, it is the eastern side of the peninsula that shows the largest decreases.
The maps below show the projected change in sea-ice concentration around the Antarctic Peninsula for each season (left to right) under low (top), high (middle) and very high (bottom) emissions. Decreasing concentrations are shown in blue and increasing concentrations are shown in red.
The paper gives a “great overview of the current literature on the Antarctic Peninsula, examining multiple aspects of the region holistically”, Dr Tri Datta, a climate scientist at the Delft University of Technology, tells Carbon Brief.
However, Datta – who was not involved in the study – notes that the coarse resolution of CMIP6 models means that the “most vulnerable regions are too poorly represented to capture important feedbacks”, such as the forming of meltwater ponds on the tops of glaciers, which warm much more than the icy surface around them.
Ecosystem impacts
The study also looks at potential futures for the Antarctic Peninsula’s marine and terrestrial ecosystems – albeit, much more briefly than it examines the physical changes.
This is because modelling ecosystem change is very difficult, Davies explains:
“If you’re going to model an ecosystem, you have to model the climate and the ocean and the ice and how that changes. Exactly how that ecosystem responds to those changes is still beyond most of our Earth system models.”
Still, by looking at trends in the Antarctic over the past several decades, as well as changes that have occurred in other high-latitude regions, the researchers piece together some of the potential impacts of warming.
They conclude that under SSP1, the changes experienced by ecosystems are “uncertain”, but will “likely” be similar to present day – with some terrestrial species, such as its flowering plants, even benefitting from increased habitat area and water availability.

However, under higher-emissions scenarios, species will become “increasingly likely” to experience warmer temperatures than they are suited for.
Other changes that may occur in the very-high-emissions scenario are closely linked to the projected reductions in sea ice. These include the increased spread of invasive alien species, reduced ranges for krill and the displacement of animals unable to tolerate the warmer temperatures by those more able to adapt.
Prof Scott Doney, an oceanographer and biogeochemist at the University of Virginia, notes that some of these changes are already happening. Doney, who was not involved in the study, is part of an ongoing research programme on the Antarctic Peninsula known as the Palmer Long-Term Ecological Research project.
He tells Carbon Brief that Adélie penguins, which are a polar species, have “seen a massive drop in their breeding population” at their research sites. Meanwhile, gentoo penguins – whose range extends into the subpolar regions – “have been quite opportunistic” in colonising those breeding sites.
‘Changes here first’
Antarctica is home to 50 year-round research stations and dozens of summer-only ones, operated by more than 30 countries.
Around a dozen year-round stations are found on the peninsula and its islands, including the oldest permanent settlement in Antarctica – Argentina’s Base Orcadas, established in 1903 by the Scottish national Antarctic expedition.
The continent is home to commercially important fisheries – particularly krill, which also play a critical role in the Antarctic marine food chain.
Increasingly, the Antarctic Peninsula is also a tourist destination.
Climate change poses a threat to all of these activities, Davies says.
For example, much of the research infrastructure on the Antarctic Peninsula was “built to assume dry, snowy conditions”, she says. Rain can “cause quite a lot of difficulty”, she adds.
(In an article published last year, Carbon Brief looked at the causes of rain in sub-zero temperatures in West Antarctica.)
Decreased sea ice cover can impact krill populations. It can also lead to increased ship traffic, as more of the continent becomes accessible throughout more of the year.
Furthermore, Davies says, the changes occurring on the peninsula will reverberate across Antarctica and around the world. She tells Carbon Brief:
“We’ll see changes here first and those changes will continue to be felt in West Antarctica and continent-wide…What happens in Antarctica doesn’t stay in Antarctica.”


The post Limiting warming to 2C is ‘crucial’ to protect pristine Antarctic Peninsula appeared first on Carbon Brief.
Limiting warming to 2C is ‘crucial’ to protect pristine Antarctic Peninsula

The launch of the Africa Energy Bank (AEB) has been put back yet again, raising doubts about the institution’s future ability to finance fossil fuel projects – its main objective – as global lenders retreat from such investments over climate concerns, experts told Climate Home News.
The bank, which had been billed to launch in September after a series of delays, is now scheduled to begin operations in November, according to the head of the African Energy Chamber, an advocacy body for the continent’s oil and gas sector.
Even as the world aims to transition away from fossil fuels, many African leaders have made clear they want to continue exploring and extracting the continent’s large oil and gas deposits – estimated at around 125 billion barrels of crude and over 600 trillion cubic feet of gas – to boost economic development.
As a group, Africa sided with a number of powerful oil-and-gas producing nations in blocking progress on negotiations to craft a global roadmap to transition away from fossil fuels at last year’s UN COP30 climate talks, although some countries did individually support the proposal.
-
Campaigners oppose Dangote’s planned Kenya refinery over climate and ecological risks
Plans to build Africa’s second largest oil refinery in ecologically sensitive region criticised as “environmental recklessness” -
Tanzania pushed African nations to oppose fossil fuel transition at COP30
While chairing the African group at the summit, the gas-dependent nation advised the continent’s ministers to block language on transitioning away from fossil fuels


Meanwhile, major projects under development across the continent – including the 1,443-km East African Crude Oil Pipeline (EACOP) and Dangote’s 700,000-barrel-per-day Kenyan refinery – show that African governments see oil and gas as playing a significant role in meeting their energy and economic needs for many years to come.
In 2022, at a gathering of the African Petroleum Producers’ Organization (APPO) in oil-rich Angola, ministers from its member states adopted a resolution to create the Africa Energy Bank to finance projects for the production, use and trade of oil, gas and broader energy sources.
African control over energy resources
An article on the APPO website explains that the bank was conceived as a way to overcome “disenchantment” with fossil fuels among “the international community” which it said had crystallised around the “energy transition” concept.
“If Western countries, after having long taken advantage of the energy sources they now revile to develop, can afford the luxury of abandoning them, this is not the case in Africa,” it adds, noting that many of the continent’s economies are still largely dependent on oil and gas revenues.
A separate web page about the bank, also hosted on APPO’s website, says its objectives include financing the exploration, production and refining of oil and gas, as well as supporting member states in transitioning from fossil fuels to cleaner energy sources “while ensuring energy security”.
Said Addi, a former executive with Shell and energy commodities trading house Gunvor, said the new bank was judged necessary because financing for hydrocarbons from many traditional international lenders has become constrained.
In trying to fill this financing gap, Africa is not simply setting up another fund to support oil and gas, he added. “It is also an attempt to give African countries greater control over how their energy resources and infrastructure are financed,” he explained.
Nigeria to host the AEB
The energy bank – a joint initiative of APPO and the African Export–Import Bank (Afreximbank) – has so far suffered several delays and is almost two years behind schedule. The initial plan was to start operations in January 2025, with Nigeria as the host country, but the bank’s opening was delayed to June of that year to allow Nigeria time to finalise the construction of the bank’s headquarters in Abuja.
After the government announced the completion of the offices in late November 2025, a new launch date was set for January 2026, which was moved back to April, June and then September. Now it has shifted again to November, raising concerns that the institution may be losing momentum.
Former Shell executive Addi said that if the capital is eventually paid in, the bank becomes operational and its first projects are commercially credible, then the delays will be regarded as normal teething troubles in setting up a multilateral institution. But, he added, scepticism will be justified if it continues to stall.
Uganda may see lower oil revenues than expected as costs rise and demand falls
Baron Lamarré, an oil and gas expert and former Petronas oil trader, said that missing “three deadlines in a row is not normal”, and warned that if the timeline slips again, “the story flips from ‘ambitious institution finding its footing’ to ‘good idea that lost momentum before it found any’.”
The Nigerian government, APPO and Afreximbank did not respond to requests for comment by the time of publication.
The funding challenge
The Africa Energy Bank is targeting base capital of $5 billion, with plans to scale up to $120 billion within five years by mobilising private-sector funds. However, it is expected to start operations with initial seed capital of $500 million.
The funding plan is to have the 18 member countries of the APPO contribute $83 million each to the bank as equity for a combined $1.5 billion. Afreximbank, other non-APPO African countries and investors outside the continent are expected to provide the remaining $3.5 billion.
But even the initial $500 million has not been easy to mobilise. In May, APPO Secretary-General Farid Ghezali called on members to deliver on their pledges towards the startup goal before the end of June. But the delays suggest this may not have been met, with experts saying Africa may be finding it difficult to self-fund its oil and gas projects in the absence of international capital.
Lamarré said every extension of the deadline points to the fact that “raising fossil fuel capital in Africa without the majors and their financing networks is brutally hard”.
Why the global electrification agenda misses the point on Africa’s energy crisis
Since 2020, Western lenders, export credit agencies and insurers have been in steady retreat from African hydrocarbons, he said, while oil majors are divesting their African assets, handing over fields to smaller local operators whose credit ratings are not high enough to borrow cheaply.
Even capital from China and the Gulf, which has partially filled the gap, cannot match the volume, tenor or pricing that Western investors once offered, Lamarré argued.
“If mobilising the first $500 million of seed capital [for the AEB] has taken this long, that’s the clearest signal yet of how steep the climb to $120 billion looks,” he said, noting that the continent’s energy financing gap is as large as $30 billion-$45 billion per year.
Africa’s investment landscape, meanwhile, has been shifting. While foreign direct investment dropped from a 2024 peak, inflows remained roughly one-third above the continent’s long-term average in 2025, according to the 2026 World Investment Report from UN Trade and Development (UNCTAD). They are concentrated in a few sectors including critical minerals needed for renewable energy technologies, battery manufacturing and advanced industrial production.
At the same time, data on global energy investment from the International Energy Agency (IEA) shows that fossil fuel investment in Africa has declined over the last decade.

“Trojan horse” for fossil fuels
While the Africa Energy Bank struggles to get off the ground, climate campaigners have criticised its primary aim of financing oil and gas on the continent at a time when the world is starting to move away from high-carbon fuels to cleaner alternatives.
Bhekumuzi Dean Bhebhe, founder of Africa Change Lab, described the bank as a “Trojan horse”, arguing that its focus on fossil fuel financing runs counter to the global energy transition and the African Union’s Agenda 2063 goals of sustainable development and inclusive growth.
The energy bank, he warned, “risks locking Africa into a new cycle of debt, dependency and fossil fuel entrenchment”, adding that its financing blueprint does not pave the way for a climate-resilient future. “In truth, it is to deepen the same extractive, carbon-heavy pathways that the continent should be moving away from,” he added.
Ugandan farmers use British court to try to stop East Africa oil pipeline
Kenya-based climate and energy expert Joab Okanda said the AEB’s plan to finance oil and gas is “a misplaced priority” and it should instead back clean energy in line with the policies of some of Africa’s major export markets like Europe.
In addition, the new bank could struggle to mobilise enough resources to advance large-scale oil and gas projects, he added, noting that its proposed $5-billion initial capital is equivalent to the cost of the East African Crude Oil Pipeline alone.
The AEB’s aim of backing more fossil fuels should be flipped “to support countries that are oil-dependent to start working on their transition plans”, Okanda said.
The post Launch of Africa Energy Bank delayed again in blow to oil and gas hopes appeared first on Climate Home News.
Launch of Africa Energy Bank delayed again in blow to oil and gas hopes
A booklet published by the UK’s opposition Conservative party includes a “cost of net-zero” that appears to have been doubled by a spreadsheet error.
The “common sense” policy document argues that “what people ultimately want is a government competent enough to solve the problems for which it takes responsibility”.
In a section that says “sophisticat[ed]…modelling” should not be a substitute for “political judgement”, the “Right Way” document disparages various estimates of the cost of net-zero.
The Conservative document then claims – incorrectly – that the government’s official adviser, the Climate Change Committee (CCC), had put the cost of net-zero at close to £1tn. It says:
“In 2020, the CCC estimated that its route to net-zero would cost £957bn.”
In fact, the CCC’s 2020 estimate was exactly half this amount – £478bn – and last year it published a revised figure of £108bn, largely as a result of the falling cost of electric vehicles (EVs).
Spreadsheet error
The Conservative party’s erroneous claim appears to stem from another report that had accidentally added up numbers twice, using a spreadsheet published by the CCC in 2020.
The 2020 spreadsheet contains a table listing the additional investments that would be needed to build a net-zero economy, from low-carbon electricity generation through to heat pumps and EVs.
These extra capital expenditures, listed as “CAPEX”, add up to a total of £1.38tn over the 30 years of 2020-50. They are set against operational savings, listed as “OPEX”, of £0.90tn.
Added up over 2020-50, the combined CAPEX and OPEX figures come to a total of £478bn.
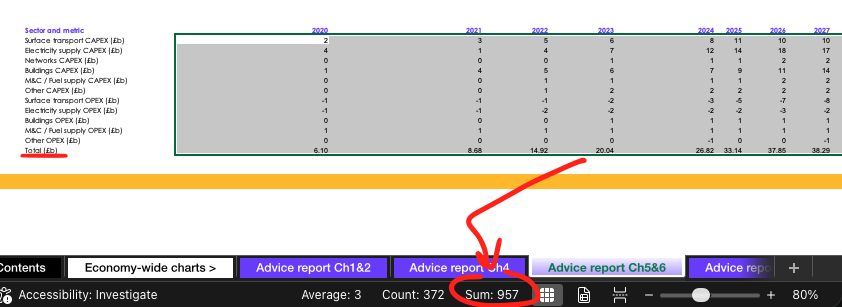
In addition to the annual sectoral CAPEX and OPEX figures, the CCC’s 2020 spreadsheet also has a line giving combined totals for each year. It appears that someone has added all of these numbers together, resulting in the savings and costs being counted twice.
This double-counted total for the cost of net-zero amounts to £957bn – as shown in the image below – and it appears to be the source of the claim in the Conservative booklet.
At the time of publication in 2020, the CCC said that the £478bn net cost of net-zero amounted to less than 1% of GDP over 30 years – and that the large investment needed would not only result in savings due to lower fossil-fuel imports, but that it would boost GDP overall, by around 2%.
In 2025, the CCC revised its estimates for investment costs and operating savings to £670bn and £562bn respectively, giving a net total of £108bn over 2025-50, or less than 0.2% of GDP.
Earlier this year, the committee said that cutting emissions to net-zero would cost less than a single fossil-fuel price shock and that doing so would have benefits worth £110bn per year.
Paper trail
The erroneous claim in the Conservative document is referenced to the CCC’s 2020 advice on the UK’s sixth “carbon budget”, which, as explained, does not contain the £957bn figure.
The earliest online use of the £957bn figure found by Carbon Brief is a 12 January 2026 article in the Spectator, by retired engineer and self-described “accidental energy analyst” David Turver.
A day later, Turver repeated the mistaken number in a report for the free-market Institute of Economic Affairs. His report cites figure 5.3 of the CCC’s 2020 advice.
However, as set out above, the CCC spreadsheet containing the data for figure 5.3 only adds up to £478bn, half the figure claimed by Turver.
It appears that Turver accidentally added up all of the numbers in the CCC spreadsheet, without noting that it already included a line for the annual total. This results in double-counting the cost.
(Turver’s report also triggered a slew of inaccurate headlines stating that net-zero would cost £7.6tn – or even £9tn. These figures, which came from Turver’s report, were based, among other things, on the implicit assumption that fossil fuels and the cars, boilers and power plants that use them are all free.)
After Turver’s report and article in January 2026, the erroneous £957bn figure was repeated in March by the Great British Think Tank. The organisation has the tagline “data, not vibes” and says of its work: “Every figure [is] sourced from official public bodies.”
The £957bn figure then appeared in the Conservative “Right Way” document in October 2026.