Carbon dioxide removal (CDR) technologies will need to be deployed at rates even faster than those seen for solar power, if the world is to have a chance of limiting global warming to 1.5C by 2100, says a new report.
Nearly all pathways to meeting the Paris Agreement’s highest ambition of keeping global temperatures to 1.5C above pre-industrial levels in 2100 involve CDR techniques – ranging from tree-planting to sucking CO2 from air with machines.
This is in addition to steep and immediate emissions cuts.
Scientists expect carbon emissions to push warming beyond 1.5C in the decade ahead, meaning that the target can only be achieved “from above” via large-scale CDR that brings down global temperatures.
These temperature trajectories are known as “overshoot” pathways.
The third “state of CDR” report, written by more than 50 scientists, says that countries’ current CDR plans would fall short of what is needed to limit warming to 1.5C by more than 5bn tonnes of CO2 (GtCO2) per year by 2050.
Global CDR would have to increase fourfold – from 2.2GtCO2 in 2026 to 8.75GtCO2 by 2050 – to have a chance of meeting the 1.5C target by 2100, according to the report.
It adds that deploying CDR can be a “gradual process”, making the period 2026-30 “crucial” for “establishing CDR’s role in limiting climate damages” in the future.
Below, Carbon Brief covers the key findings of the third state of CDR report. (This follows from Carbon Brief’s coverage of the first report in 2023 and second report in 2024.)
- What is CDR?
- What are current levels of CDR?
- How much CDR is needed to reach net-zero goals?
- What does the science say about the potential and costs of CDR?
- What have governments pledged on CDR?
- What is the current funding and research landscape for CDR?
- How is policy impacting CDR demand?
What is CDR?
According to the report, the definition of CDR is:
“Human activities capturing CO2 from the atmosphere and storing it durably in geological, terrestrial or ocean reservoirs, or in products. This includes human enhancement of natural removal processes but excludes natural uptake not directly caused by anthropogenic [human-caused] activities.”
In addition to this, the report includes “three key principles” for CDR, which are:
- The captured CO2 must come from the atmosphere, not from “fossil sources”.
- The subsequent storage “must be durable”, so that the CO2 is not soon reintroduced to the atmosphere.
- The removal must result from human intervention that is in addition to Earth’s natural processes.
In this report, a CDR method is considered durable if it is able to lock up carbon for “decades or more”.
The report classifies CDR techniques as either “conventional” or “novel”.
“Convential” CDR techniques are “well established, already deployed at scale and widely reported by countries as part of [land-use] activities”.
The methods included in this group are tree-planting, ecosystem restoration, agroforestry (trees in agriculture), improving soil carbon in croplands and natural lands, and durable wood production.
“Novel” CDR techniques have “lower level of readiness for deployment and, as a consequence, are currently deployed at smaller scales”, says the report.
Some examples of different CDR methods are listed on the graphic below.
The graphic also shows whether carbon is captured through biological or chemical processes, as well as how “ready” the method is and for how long it can store carbon, among other features.
The report says that CDR is “needed alongside deep and rapid emissions reductions” to give Earth a chance of limiting global warming to 1.5C. It continues:
“It should play a smaller role than emissions reductions given uncertainty around the feasible levels of scaling, sustainability limits, storage availability and the risk of reversal, among other constraints.
“In general, CDR should be seen as a limited resource that will need to be used prudently.”
It adds that CDR can “fulfil three major functions”.
In the near term, CDR can help reduce “net emissions”, it says.
In the medium term, CDR can “counterbalance residual emissions” to achieve net-zero CO2 or net-zero greenhouse gas emissions, the report continues.
(“Residual emissions” are those that cannot be eradicated through technologies or societal changes, such as methane emissions from rice production.)
Research suggests that global warming is likely to stop, more or less, once net-zero is achieved globally.
In the long term, CDR can “help achieve net-negative emissions”, a state where CO2 removal exceeds emissions, says the report.
In this state, humans could lower global temperatures. This may allow the world to limit global warming to 1.5C by 2100, even if the temperature target is surpassed earlier on in the century.
Future trajectories where temperatures exceed the 1.5C limit before being brought back down again through CDR techniques are known as “overshoot” pathways.
What are current levels of CDR?
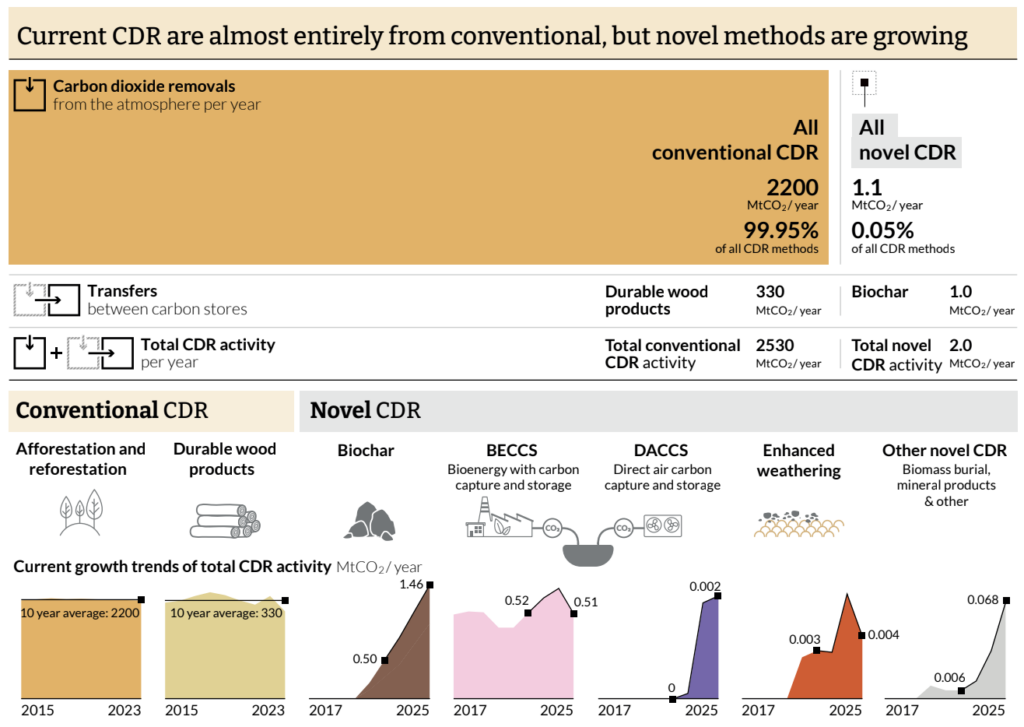
The report says that, at present, “99.9%” of existing CDR is conventional, land-based techniques such as tree-planting and ecosystem restoration.
The world currently removes 2.2GtCO2 per year, equivalent to around 5% of gross global CO2 emissions, it continues.
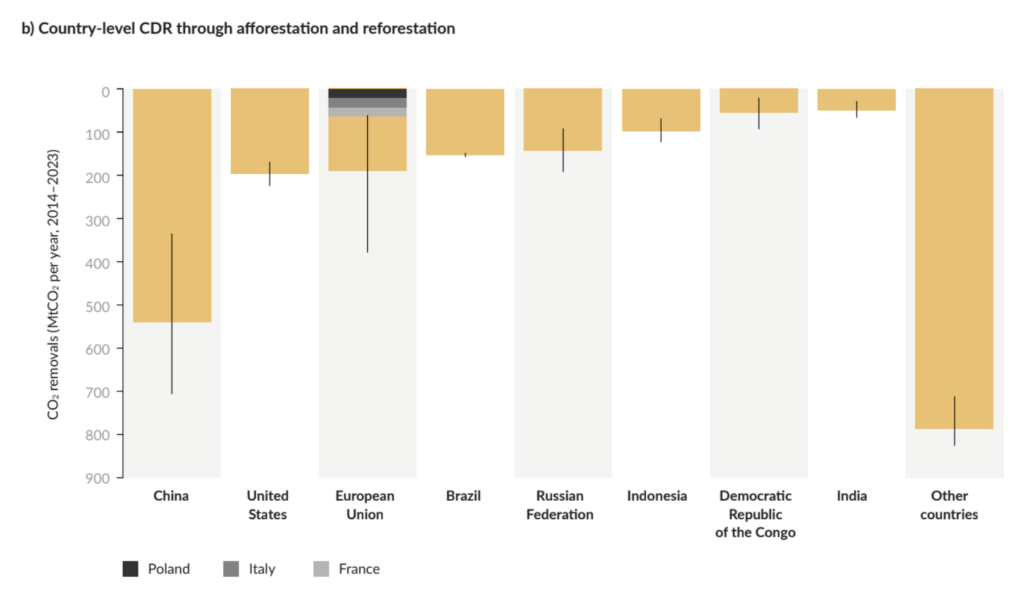
The largest contributors to removing CO2 from the atmosphere are China, the US, the EU, Brazil and Russia.
The chart below shows the amount of CO2 removed each year over 2014-23 by the largest contributors, through tree-planting (afforestation) and forest restoration (reforestation).
“Novel” CDR, such as biochar and direct air capture, currently removes just 2m tonnes of CO2 annually at present, according to the report.
However, these methods have been growing at a rate of 40% per year – “similar to successful technologies like solar energy, but insufficient for the scale-up required to meet the Paris temperature goal”, says the report.
The graphic below illustrates how the contribution of conventional CDR currently dwarfs novel CDR, but how the latter techniques are quickly growing.
The report says that investment in CDR companies recovered in 2025 following a dip – and its “share of all climate-tech funding” grew to 2.6%.
The report also notes that, at present, most CDR efforts are unevenly distributed across the world.
For example, two-thirds of conventional CDR in voluntary carbon markets is in Latin America, according to the report. (Voluntary carbon markets are where companies can buy credits for carbon-reducing or removing projects, such as tree-planting, to claim that they have “offset” some of their own emissions.)
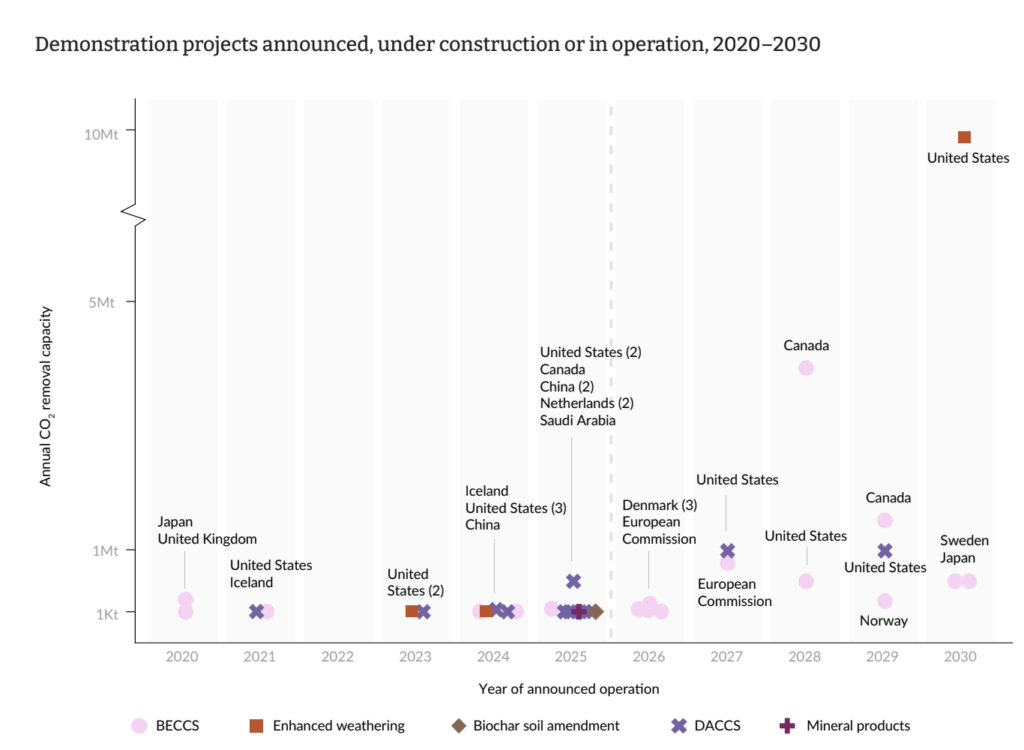
In addition, most pilot projects that aim to demonstrate novel CDR methods are located in only a few countries, such as Sweden, Denmark and the US, says the report.
The chart below shows the location and timeline of demonstration projects that have been announced, are under construction or in operation globally.
The report continues:
“While first-movers play important roles, if their actions do not diffuse more widely, vulnerability emerges, as evidenced by the impact of US climate policy dismantling.”
(For more, see: How is policy impacting CDR demand?)
How much CDR is needed to reach net-zero goals?
The report examines three scenarios where global temperature rise is limited to “well below” 2C by 2100:
- A current ambition scenario, based on national climate pledges (but omitting the US);
- A highest-possible ambition scenario;
- A delayed ambition scenario, which is consistent with current targets until 2035 and then switches to the highest ambition scenario.
The pledges considered in the report are “nationally determined contributions”, or NDCs, which countries submit periodically to the UN Framework Convention on Climate Change (UNFCCC). NDCs lay out a country’s climate ambition.
Under the current ambition scenario, the report projects a total of 5.9GtCO2 of CDR by 2050 and 12GtCO2 by 2100.
This scenario would result in end-of-century warming of 1.7-2.7C. Importantly, the report says, this scenario does not result in the world reaching net-zero CO2 levels, “meaning that global temperatures would continue to rise, albeit at a much more gradual pace, beyond 2100”.
Under the highest-possible ambition scenario, CDR scales up to 8.8GtCO2 by mid-century and 15.3GtCO2 by the end of the century.
This scenario assumes “full buy-in by all nations”, with economics, scale-up and sustainability providing the main constraints on CDR deployment, the report says.
The highest ambition scenario results in global temperatures peaking at 1.7-1.8C around 2050 and the world achieving net-zero emissions around that time.
Under the delayed ambition scenario, CDR would scale up to 7GtCO2 by 2050 and 23.6GtCO2 by 2100. This scenario shows global temperatures peaking between 1.7C and 2.0C.
This scenario requires larger CDR deployment in the long term than the highest-ambition scenario does, due to the larger cumulative emissions caused by delaying deep emissions reductions.
In both the high ambition and delayed ambition scenarios, the world reaches “deeply net-negative CO2 emissions” by 2100, the report says. This continued deployment of CDR will further draw CO2 from the atmosphere, lowering global temperatures back down to 1.5C.
The chart below shows annual global greenhouse gas emissions through the end of the century under current ambition (red), highest ambition (green) and delayed ambition (blue) scenarios.
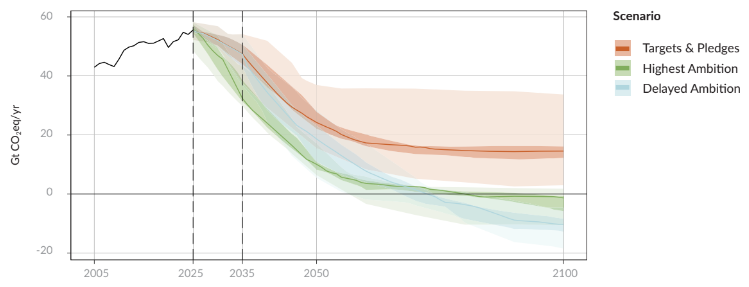
While global CDR capacity scales up more slowly in the first and third scenarios, the report notes that, in all three cases, “novel CDR reaches gigatonne-scale deployment by 2050”.
What does the science say about the potential and costs of CDR?
There is a wide range of both carbon-removal potential and associated costs between different methods of CDR, according to the report.
However, it also notes that these numbers “range widely” in the scientific literature.
The discrepancies in estimates of carbon-removal potential are due to a number of factors, the report says, including a lack of available scientific data, inconsistencies in the assumptions made in assessing technical feasibility and a lack of agreement on what, exactly, “potential” means.
These elements also influence the cost of different CDR methods, but additional factors – such as deployment costs in different areas, technological approaches and scope – also play a role in establishing price differences. Because of this, the report says, “cost estimates are often difficult to compare across methods, complicating design and policy decisions”.
The chart below shows the reported range of mitigation potential (left) and reported range of costs (right) for different CDR methods. The top four rows indicate conventional CDR methods, while bottom 11 rows show novel CDR methods. The chart refers to “mitigation potential”, rather than removal potential, because some estimates do not distinguish between removals and avoided emissions.
(Avoided emissions refers to the difference in emissions from carrying out a project, compared to a hypothetical alternative – such as the reduced emissions from halting deforestation.)
The darker colours indicate estimates that are more constrained, meaning that they are either based on stricter assumptions or there is more agreement between different estimates.
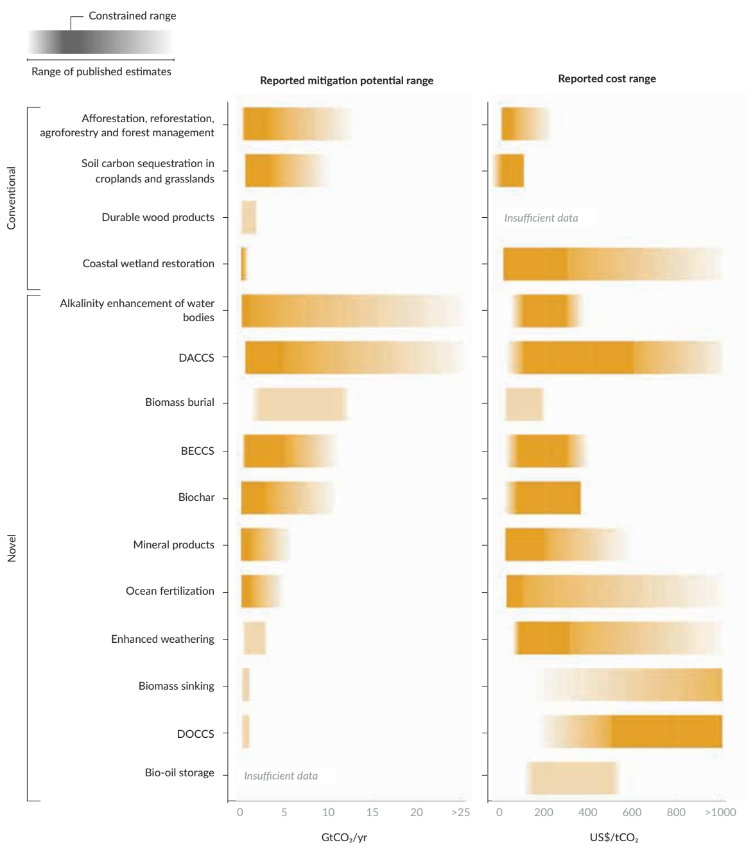
The report notes that for most removal methods, the low end of the potential is around 1GtCO2 per year, while the upper limit of costs is more than $200/tCO2.
The least expensive CDR approaches are forestry-based methods, soil-carbon sequestration and biomass burial. For forestry-based methods, the report puts the cost of CDR at $5-$53 per tonne of CO2 removed. Soil-carbon sequestration costs reach as high as $150 per tonne of CO2 removed, but could have negative overall costs “when accounting for crop yield increases potentially resulting” from changed farm-management practices, the report says.
However, it adds that “these CDR methods are typically associated with lower levels of permanence” than other methods.
Other relatively low-cost methods include coastal wetland restoration, biochar, bioenergy with carbon capture and storage (BECCS) and enhanced rock weathering, while ocean alkalinity enhancement is a medium-cost option.
The most expensive methods include direct air carbon capture and storage (DACCS) and direct ocean carbon capture and storage (DOCCS).
The report also notes that a total estimate of CDR removals cannot be obtained by adding up the removal potential of all of the separate methods, since different methods can compete for scarce resources. For example, BECCS, biochar, biomass burial and biomass sinking all rely on the same base input – biomass – and therefore cannot all be maximised at the same time.
What have governments pledged on CDR?
While many countries include some amount of CDR in their national climate plans, there is currently a large gap between the amount of CDR pledged in these plans and the amount that will be needed to limit global temperature rise to 1.5C by the end of the century, says the report.
This quantity is referred to as the “CDR gap” – the difference between what is pledged and what is needed.
The size of the CDR gap is dependent not just on the pledges made by countries, but also the choice of the “benchmark” scenario against which the pledges are measured. Lower – or delayed – emissions reductions lead to larger shortfalls in the long term, meaning “CDR must subsequently be scaled to very high levels”, says the report.
Current NDCs and other country submissions to the UNFCCC total 2.5GtCO2 per year of removals in 2030, 2.7GtCO2 per year in 2035 and 3.6GtCO2 per year in 2050.
This gives a CDR gap of 0.3GtCO2 in 2030, 1.2GtCO2 in 2035 and 5.2GtCO2 in 2050, according to the report. These figures are obtained using assumed “immediate, ambitious action at all levels to reduce emissions” and the most-ambitious estimates of CDR set out in national pledges. Together, this provides a “lower bound” for the CDR gap, says the report.
By comparison, a 10-year delay in implementing ambitious emissions reductions will result in the need to remove at least an additional 150GtCO2 from the atmosphere, compared to the most ambitious scenario. (See: How much CDR is needed to reach net-zero goals?)
The report says that the CDR gap has widened since the second state of CDR report was released in 2024, due to the US leaving the Paris Agreement. It adds that other countries have “not delivered a step change in ambition” in their latest round of climate pledges.
It also cautions that “credibility issues with national pledges may mean that the CDR gap is actually larger than what we assess here”.
The report notes that current CDR pledges by companies are “substantially higher than country pledges”, at 5GtCO2 per year in 2050. However, it adds, “credibility in these announcements is low”.
What is the current funding and research landscape for CDR?
Funding of CDR research and development – as well as investment in CDR companies – has continued to increase in recent years.
In total, there has been around $5.6bn in grant funding distributed to CDR research since 2005, according to the report’s analysis. Roughly one-third of this has come in the past three years.
Funding for CDR research grants grew 13% each year between 2022 and 2025, the report says, and the corresponding number of research publications grew at a similar rate.
Funding was largely targeted at a handful of key areas, notably soil carbon sequestration, biochar and forest-based CDR.
DACCS and BECCS only make up a small number of active grants, but together account for around two-fifths of all funding due to “substantially larger” project sizes.
Despite the growth of research grants and scientific publications, the report concludes that early-stage innovation in CDR is “uneven” and says there is “no strong evidence of a step-change”.
It notes that much of the support for CDR has come from projects with a broader focus, rather than those that focus specifically on CDR.
The authors also point to a decline in “inventive activity”, as measured by patenting of CDR-related innovations. While patenting for emissions-cutting technologies in general has been on an upward trajectory, CDR patenting peaked in 2011.
Meanwhile, the report highlights the “remarkable” sustained investment in CDR companies, against a backdrop of falling investment in climate-related technologies. It notes that CDR now accounts for around 3% of overall “climate-tech funding”.
Yet, again, it says future developments remain “uncertain”. Since the previous 2024 “state of CDR” report, companies have scaled back their ambitions and policy reversals – notably in the US – “underscore that funding uncertainty remains a key barrier”. (See: How is policy impacting CDR demand?)
An upward tick in funding in 2025 was driven primarily by a “surge” in grants from predominantly public institutions, as well as $0.5bn in debt financing for a single BECCS project in Sweden.
Reliance on such funding sources “highlight[s] the volatility of the CDR innovation ecosystem”, according to the report.
The report also has a chapter focusing on the voluntary carbon market, which it describes as “propelling most of the current demand for novel CDR”.
The scale of this market remains fairly small, with contracts for 0.04GtCO2 of removals signed last year.
Moreover, the concentration of sales within a small number of buyers – particularly Microsoft – remains a “critical vulnerability”, the authors note.
How is policy impacting CDR demand?
The report analyses CDR policies in G20 nations – which together account for three-quarters of global emissions – to assess how they are acting to support CDR across their economies.
In total, 140 countries have announced net-zero targets, including virtually all of the world’s major emitters. In doing so, the report points out that the governments of these nations have “implicitly included a role for CDR in their climate plans”.
However, this does not always translate into measures specifically designed to scale up CDR.
Only the EU has adopted a binding, quantified removals target into law – namely, the goal to reach 310m tonnes of CO2 equivalent (MtCO2e) of annual net removals in the land sector by 2030.
Overall, conventional CDR is the main focus of policy, with various governments focusing on tree planting to absorb CO2 from the atmosphere.
Among G20 nations, only the UK and Australia have set specific goals to scale up novel CDR, such as BECCS and DACCS, over the coming decade.
The report highlights some nations, including Canada, Germany, Switzerland and the UK, as taking proactive steps to incentivise CDR.
The authors point to national strategies, financial support for CDR and efforts to integrate it into emissions trading systems (ETS) as examples of effective policy making.
(The report also stresses that the US, which was previously a “leader” on CDR, has now “frozen or dismantled funding and support” for CDR under the Trump administration.)
Most of the successful policies highlighted in the report focus on supporting the supply of CDR, with “less attention so far on creating demand”.
This is significant because CDR “generally lacks a natural market”, meaning there are not automatically buyers willing to spend money on emissions removals. Therefore, the authors say, policy interventions are important to create markets and boost demand.
“Compliance” carbon credits – referring to credits that can be used to meet legally mandated emissions targets – provide a way to support demand, according to the report authors.
Only some ETSs, such as those used in New Zealand and Australia, allow the use of credits based on forest-related removals for compliance. (It is worth noting that such credits are controversial, as removals by forests are not always permanent.)
The report also highlights the need for “foundational policies to create a governance framework for CDR, including rules for quantification of removal, guidelines for community engagement and the minimisation of negative environmental impacts”.
The post Q&A: The current state of ‘carbon dioxide removal’ around the world appeared first on Carbon Brief.
Q&A: The current state of ‘carbon dioxide removal’ around the world

Next week, diplomats from around the world will descend on Yerevan, Armenia, to negotiate a series of decisions under the UN Convention on Biological Diversity (CBD).
Between 19 and 30 October, 196 parties will gather to hammer out the precise wording of the dozens of legal texts that make up the decisions under the Conference of the Parties (COP) to the CBD.
This year’s summit is particularly significant, as it marks the halfway point between the agreement of the Kunming-Montreal Global Biodiversity Framework and the deadline for achieving its targets.
The CBD has found that countries are currently not on track to meet 22 out of the framework’s 23 targets.
During the fortnight, delegates will also be negotiating decisions relating to the two supplemental protocols to the CBD: the Cartagena Protocol, which covers biosafety; and the Nagoya Protocol, which covers access and benefit-sharing for the use of genetic resources.
(The Cartagena and Nagoya Protocols, which are each governed by a “meeting of the parties”, or “MOP”, have fewer parties than the CBD as a whole, with 173 and 141, respectively.)
Carbon Brief is tracking the progress of countries towards consensus on dozens of negotiating texts using the interactive table below.
The tracker includes texts from the COP, as well as the MOPs for the Cartagena and Nagoya protocols. It also includes draft decisions from the most recent subsidiary body meetings, as these form the starting point for the negotiations in Yerevan.
The CBD has three subsidiary bodies: the subsidiary body on scientific, technical and technological advice (SBSTTA), the subsidiary body on implementation (SBI) and the subsidiary body on article 8(j) and other provisions (SB8J).
SB8J focuses on issues related to the Indigenous peoples and local communities. It was established at COP16 in Cali, Colombia, in 2024.
The first two columns of the interactive tracker list the topic of each agenda item and the relevant body, with subsequent columns including dates, page counts and links to the original documents.
The table is searchable and can be sorted using the arrows in the header.
Areas of disagreement in UN draft texts are denoted by square brackets. Counting the brackets in a particular iteration of a text therefore gives a sense of how far parties are from reaching consensus.
The bracket column is colour-coded, with dark green indicating a low number of brackets and red indicating a high number of brackets remaining.
Texts can also present parties with choices using “options” or alternatives (“alt”), which are counted together in the sixth column of the table.
The key discussions in Yerevan will centre around two agenda items in particular. The first is the global review, which will assess progress towards the GBF and make recommendations for accelerating action.
The second is finance, which can be separated into two parts: resource mobilisation and the financial mechanism. On resource mobilisation, biodiverse global south countries are likely to push for an increased amount of international finance for conservation.
Disagreement over the creation of the financial mechanism led to the suspension of COP16 in Cali in October 2024, as parties failed to find agreement on the mobilisation of finance before the end of the summit.
Global south countries want the establishment of a separate financial mechanism under the control of the CBD; global north countries largely prefer to maintain the existing mechanism, which sits under the Global Environment Facility.
At the resumed session of COP16 in Rome in early 2025, countries agreed on a roadmap that would lead to the establishment of a permanent mechanism.