


The European Commission’s (EC) 2024 Climate Action Progress Report highlights significant strides in reducing greenhouse gas (GHG) emissions across the EU, with an 8.3% decrease in 2023. This marks one of the largest non-COVID-related declines in recent history, driven largely by a 24% reduction in emissions from electricity production and heating.
Trading Carbon, Saving the Planet: How EU ETS Drives Climate Action
What makes such a significant reduction in EU emissions possible is the bloc’s Emissions Trading System (ETS). The ETS is a key policy tool that slashes GHG emissions across several high-emitting sectors. It applies the polluter pays principle, holding companies accountable for their emissions in these key sectors:
- Electricity and heat generation,
- Industrial manufacturing,
- Aviation, and
- Maritime transport
Together, these sectors account for about 40% of the EU’s total emissions.
Launched in 2005, the ETS has been a cornerstone of the EU’s climate strategy and 2050 net zero goals.
Achievements of the EU ETS
According to the report, by 2023, the EU ETS had significantly driven down emissions in its covered sectors. Key accomplishments include:
- 47.6% emissions reduction in electricity, heat generation, and industrial manufacturing compared to 2005.
- Raised over €200 billion through allowance auctions, with €43.6 billion generated in 2023. Member States have used these funds to:
-
- Support renewable energy projects.
- Improve energy efficiency.
- Develop low-emission transport solutions.
The 2023 revision of the EU ETS Directive introduced significant updates. As of June 2023, Member States are now required to direct all ETS revenue (or an equivalent amount) toward climate action and energy transformation. This includes measures to address the social impacts of the green transition.
- RELATED: EU Regulations Poised to Catalyze Global Carbon Market Convergence, Says Trafigura’s Hauman
Non-ETS sectors like buildings, agriculture, transport, and waste saw modest reductions, driven by a 5.5% decrease in building sector emissions. The EU’s carbon sinks in the Land Use, Land Use Change, and Forestry (LULUCF) sector increased by 8.5%. This raise reverses a decade-long decline, though further efforts are needed to meet long-term targets.
The Transition Powering Europe’s Emissions Drop
Provisional 2023 data of the EC report shows that the region is on track to meet its goal of cutting GHG emissions by at least 55% by 2030, compared to 1990 levels. To stay on target, the EU needs to reduce emissions by an annual average of 134 million tonnes of CO₂ until 2030. That is slightly more than the 120 million tonnes reduced annually between 2017 and 2023.

Achieving this goal will require fully enforcing climate policies and increasing investments. After 2030, the focus will shift to tougher industries and boosting carbon removal to reach net zero by 2050.
In 2023, greenhouse gas emissions saw their largest annual drop in decades, apart from the COVID-19 pandemic year of 2020. By the end of the year, total net emissions were 37% lower than in 1990, while the economy grew by 68% over the same period. This highlights the ongoing decoupling of emissions from economic growth, showing it’s possible to reduce emissions while expanding the economy.
EU GHG Net Emissions (EU Target Scope) and By Sector
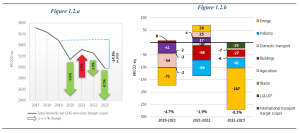
The report attributes the 8.3% emissions drop to a strong transition to renewable energy sources, particularly wind and solar, which now supply nearly 45% of EU electricity. Moreover, electricity and heat supply fell slightly by 3.1% and 2.3%, respectively.
Preliminary data shows renewables became the top electricity source, generating 44.7%, compared to 32.5% from fossil fuels and 22.8% from nuclear. Hydropower and nuclear energy also rebounded.
Additionally, gas has replaced coal in many cases, resulting in a 20% reduction in fossil fuel-generated electricity compared to 2022.
The EU’s ambitious climate goals are embedded in the European Green Deal and the 2021 European Climate Law. Its 2050 net zero goal includes a binding target of a 55% reduction in GHG emissions by 2030 relative to 1990 levels. This target is supported by the “Fit-for-55” legislative package, which includes expanding the EU ETS to cover more carbon-intensive sectors. The goal is to create further economic incentives to reduce emissions.
Economic Growth and Climate Action, Together
While the EU has already achieved a substantial emissions reduction, the report underscores ongoing challenges.
For instance, emissions from the EU ETS-covered aviation sector rose by 9.5% while other sectors showed slow progress in reductions. Agricultural emissions dropped by 2% and transport emissions by less than 1%. These figures indicate areas where the EU will need to accelerate efforts to meet future targets.
Looking ahead, the EU is contemplating a new emissions target for 2040, with the Commission recommending a 90% GHG reduction. Achieving this target would require an estimated €660 billion annually for energy systems and €870 billion per year in the transport sector.
Priority investments would focus on decarbonizing industrial processes, enhancing energy efficiency, shifting towards electrification, and developing sustainable fuels for the transport sector.
As the EU prepares for global climate talk, COP29, Wopke Hoekstra, Commissioner for Climate Action, emphasized that the EU’s efforts showcase how economic growth and climate action can coexist.
The report stresses the importance of climate resilience and international cooperation, particularly through the upcoming COP29. The bloc aims to lead in global climate finance and development assistance, contributing a third of global public climate funding.
The post How Did the EU Cut Over 8% of GHG Emissions in 2023? appeared first on Carbon Credits.

The post Promoting Improved Cooking Practices in Nigeria appeared first on Terrapass.
For most companies, the largest figure in the carbon inventory is not the office, the vehicle fleet, or the electricity bill. It sits upstream, in the goods and materials a business buys to make and sell its products. These purchased inputs form the bulk of a company’s Scope 3 emissions, which routinely exceeds everything the business controls directly, and can add up to 90% of their global footprint.

Carbon Footprint
Unlike A.I., climate change’s existential threat is not hypothetical. It is killing people now.”
Leah Stokes, professor of environmental politics at U-C, Santa Barbara, in New York Times, The Big Threat Has Been Climate Change. Now Comes A.I., Sept. 22.



-
Climate Change1 year ago
Guest post: Why China is still building new coal – and when it might stop
-

 Greenhouse Gases2 years ago
嘉宾来稿:满足中国增长的用电需求 光伏加储能“比新建煤电更实惠”
-
Greenhouse Gases1 year ago
Guest post: Why China is still building new coal – and when it might stop
-

 Climate Change2 years ago
嘉宾来稿:满足中国增长的用电需求 光伏加储能“比新建煤电更实惠”
-

 Renewable Energy12 months ago
Sending Progressive Philanthropist George Soros to Prison?
-
Climate Change2 years ago
Bill Discounting Climate Change in Florida’s Energy Policy Awaits DeSantis’ Approval
-
Greenhouse Gases1 year ago
嘉宾来稿:探究火山喷发如何影响气候预测
-

 Climate Change2 years ago
Analysis: China’s CO2 falls 1% in Q2 2024 in first quarterly drop since Covid-19