
Buildings account for about 40% of global CO2 emissions, so it’s no wonder why so much focus goes toward green building systems and reduced emissions from corporate structures. Reducing this structural carbon footprint can help counter climate change and push us toward the goals outlined in the Paris Agreement and other climate action pacts.
To help you plan and work toward lowering emissions from corporate buildings, you can look to a GHG emissions reduction audit checklist for building owners. These audit checklists and GHG inventory management can all help you reach your carbon emissions goals.
Continue reading for more about these audits and the actions you can take to reduce your building’s emissions.
How Do You Reduce GHG in Buildings?
Reducing greenhouse gas emissions (GHG emissions) in buildings starts when construction begins and continues throughout the building’s lifespan. Let’s review how to reduce emissions in both stages to minimize a building’s environmental impact.
GHG Emissions Reduction Audit Checklist for Building Owners During Construction
Starting on the right foot regarding GHG emissions reductions for building owners begins at the construction phase. Of course, none of this will apply if we’re talking about an existing building. However, if you’re constructing a new building, these tips can help lower the carbon footprint of erecting a new building.
Reuse Old Buildings

Instead of commissioning a new building, you can reduce emissions by reusing an old building. In fact, by doing this, you can save 50% to 75% of the embodied carbon emissions — the emissions associated with the materials and construction process — relative to new construction.
So, when considering a new building, think to yourself, “Is there an existing building we can renovate to fit our needs?” If so, you can reduce carbon dioxide (CO2) emissions by rehabilitating the old building. Plus, you can use some of the character in older commercial buildings to your advantage in the design phase.
Remember, that when reusing older buildings, you’ll likely have some extra work for efficiency improvements, but the emissions savings will easily offset that need.
Use Low-Carbon Concrete
Concrete production isn’t known for its GHG emissions, but its sheer weight and the amount that goes into a new building make it the most significant embodied carbon source in many projects. In fact, cement accounts for a whopping 7% of all global emissions and 50% to 85% of the embodied carbon in a building project.
You can reduce your building’s carbon footprint by opting for lower-emission concrete, such as those with fly ash, slag, or calcined clays. You can even opt for lower-strength concrete where it makes sense.
Limit Carbon-Heavy Materials
Materials with big carbon footprints, such as metals, plastic, and foam, can be a part of the construction process but seek low-carbon alternatives where possible to help with the decarbonization of your project.
So, consider a wooden instead of a steel structure to reach your building’s GMG emissions reduction goals. Or maybe opt for wooden siding instead of vinyl.
Reuse Materials
During the construction or renovation process, don’t immediately scrap all the old materials. Many of those materials, such as metal, bricks, concrete, and wood, are reusable. And each item you reuse directly reduces your project’s emission factors. Plus, it’s a more cost-effective way to build.
Focus on Recycled Materials
Recycled materials can help greatly lower the GHG emissions in your building or renovation project. For example, new steel can have five times the carbon footprint of recycled steel. On top of lowering your carbon footprint, recycled materials are often less expensive than new materials.
Minimize Finished Materials
Finishings like vinyl flooring or carpeting add to the carbon footprint of your project. Instead of going with these finishings, choose materials that don’t need finishings, such as polished concrete for the floors.
GHG Emissions Reduction Audit Checklist for Building Owners After Construction
After construction, you are still responsible for keeping the ongoing building emissions as low as possible, whether through improved energy efficiency, reduced waste, or improved sustainability. Let’s review some action plans building owners can take to ensure they improve their energy conservation and the building’s ongoing GMG emissions remain low.
Update Heating and Cooling
Heating, ventilation, and air conditioning (HVAC) make up 40% to 60% of all building carbon emissions, so this area is ripe for cutting. First, ensure you have an efficient system installed, such as some of the newer passive heating and cooling setups.
It’s also a good idea to have a programmable system. You can program it to a warmer setting during off-hours and a comfortable setting during occupancy hours.
Also, most buildings have outdoor air ventilation to keep the inside fresh, but the issue is this system runs constantly and always needs to be heated or cooled. You can counter this by installing air-quality sensors that detect when ventilation is necessary and activate this system only when needed.
This will help reduce your energy consumption, lower overall energy costs, and shrink your building’s footprint.
Perform Lighting Upgrades

Up to 40% of a commercial building’s energy consumption goes toward lighting, making this another prime target for reducing building emissions and adding in some cost savings.
Some ways to immediately lower the carbon footprint of your lighting is to install smart lights that only turn on when an area is in use and to replace all inefficient incandescent lights with more eco-friendly LED lighting. You can also add some daylighting to certain areas of the building, taking advantage of the greenest of all lights — the sun.
Install Renewable Energy
Offset some or all of your buildings’ energy use by installing renewable energy, such as solar panels. These energy efficiency measures may have significant upfront expenses, but federal and local government incentives and overall electricity savings can help make up for this cost.
By installing green appliances, you can lower energy consumption and increase energy savings. For example, you can replace old and inefficient boilers and water heaters with more efficient solar water heaters to lower electricity or natural gas usage when generating hot water. You can even swap old hard-wired ventilation fans with solar-powered ones to improve energy performance.
Reduce Water Waste
Sustainable water use can also go a long way in reducing your environmental impact and cutting operational costs. Some ways to help lower water use and waste include retrofitting low-flow water fixtures, reclaiming water systems for non-potable water recycling, and collecting rainwater for use in on-site irrigation and decorative water features.
How Do You Conduct a GHG Inventory?
First, what is a greenhouse gas (GHG) inventory? According to the U.S. Environmental Protection Agency (EPA), it is “a list of emission sources and the associated emissions quantified using standardized methods.”
The EPA outlines the GHG inventory development process in four steps: scope and plan, collect and quantify data, create a GHG inventory management plan, and set targets, track, and report. Let’s review these four steps in more detail.
Step 1: Scope and Plan
To conduct a GHG inventory, you start by reviewing the organization’s GHG accounting methods and how it reports on these emissions. The organization and its stakeholders must then determine the organization’s emissions boundaries, select a base year to start from, and consider bringing in a third party to verify the improvements.
Step 2: Collect and Quantify Data
In the second step, you’ll identify all the GHG data required and the preferred data-collection methods. Then, you’ll develop procedures, tools, and guidance that adhere to these requirements. After that, gather and review all the facility data, such as electricity and natural gas consumption from the baseline year you chose, and use estimation to fill in any data gaps. From there, you can calculate your emissions.
Step 3: Create a GHG Inventory Management Plan
Next, you‘ll create formal data collection procedures and document processes in the inventory management plan. This will include all institutional, managerial, and technical arrangements made for data collection, inventory preparation, and implementation of steps to manage inventory quality.
This management system ensures a systematic process is in place to help prevent and correct errors and identify where investments net the greatest improvements in inventory quality. However, this system’s main focus is to ensure the credibility of the organization’s GHG inventory data using five key GHG accounting principles, which we’ll cover later.
Overall, your inventory management plan will have seven key steps:
- Create an inventory quality team.
- Create a quality management plan.
- Perform generic quality tests.
- Perform source-specific quality tests.
- Review final inventory estimates and reports.
- Institutionalize formal feedback loops.
- Report, document, and archive data.
Step 4: Set Targets, Track, and Report
With the process in place, it’s now time to set your building-emissions-reduction targets relative to the base year you selected and, if you like, bring in a third party to verify your targets are attainable and helpful. You’ll then report all data as needed, publish a public GHG target report, and track your progress toward effective energy management and emissions reductions.
What Is the Standard for GHG Accounting?
Greenhouse gas emissions accounting and reporting must be based on five key principles. The principles are as follows:
- Relevance: The GHG inventory must appropriately reflect the company’s GHG emissions and serve internal and external users’ decision-making needs.
- Completeness: The organization must account for and report all sources of GHG emissions and activities within the chosen boundaries. It must also disclose and justify any GHG emissions it excluded.
- Consistency: An organization’s methodologies must remain consistent to allow accurate and meaningful GHG emission comparisons.
- Transparency: Address all relevant issues factually and coherently using a clear audit trail. If relevant assumptions are used, the organization must disclose them and make appropriate references.
- Accuracy: Ensure the GHG emissions quantification is neither over nor under the actual emissions and that uncertainties are reduced as much as possible. The organization must also ensure sufficient accuracy so users can decide based on the reported information’s integrity.
How Do You Measure GHG Emissions in a Building?
Emissions from a building can come in all three scopes: scope one, scope two, and scope three. When calculating GHG emissions from a building, you must consider all three scopes, which can make it tricky.
Scope one emissions are relatively simple to track, as these are direct GHG emissions, such as burning fossil fuels. To calculate GHG emissions in this scope, review resource consumption on utility bills, and use a calculator to determine the GHG emissions that amount of consumption made.
Scope two emissions are indirect GHG emissions that stem from the building’s energy usage from the electrical grid. So, if your company’s electricity comes from a coal-fired plant, this would include your building’s share of that plant’s emissions based on your energy consumption.
You can estimate your scope two emissions using a GHG emissions calculator and the building information, such as square feet. Keep in mind, getting a precise number is generally not possible because many power grids include multiple energy sources, including coal, natural gas, nuclear, and solar.
Finally, scope three emissions include GHG emissions from all other sources, including the supply chain and other business operations that are not within the organization’s control. In terms of a building, this can include all embodied carbon too.
Scope three emissions are difficult to track and are generally not in the organization’s control, for this reason, organizations normally aren’t required to report on them. However, monitoring, understanding, and reducing scope three emissions can help you create a green building.
Help Fight Global Warming by Auditing and Reducing Your Building’s GHG Emissions

Global warming and climate change are critical, and it’s time for everyone to chip in and do their part. This includes building owners reducing their buildings’ carbon footprints. Fortunately, GHG emissions reduction audit checklists for building owners can help in this process by giving you firm steps to follow and the data you need to successfully reduce your structural carbon footprint.
If you’re not yet ready to take on the task of reducing building emissions or already have and want to further decrease your corporate carbon footprint, we have options for you at Terrapass. Check out our voluntary carbon credits, and see how they can help offset any remaining corporate emissions, helping you attain or get closer to being a net-zero carbon emitter.
Brought to you by terrapass.com
Images per Copyright free
The post GHG Emissions Reduction Audit Checklist for Building Owners appeared first on Terrapass.
Carbon Footprint
Philippines Taps Blue Carbon and Biodiversity Credits to Protect Coasts and Climate

The Philippines is stepping up efforts to protect its coastal ecosystems. The government recently advanced its National Blue Carbon Action Partnership (NBCAP) Roadmap. This plan aims to conserve and restore mangroves, seagrass beds, and tidal marshes. It also explores biodiversity credits — a new market linked to nature conservation.
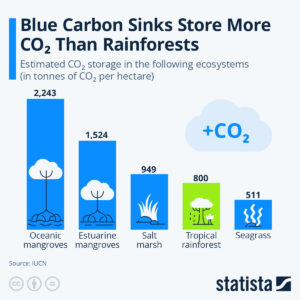
Blue carbon refers to the carbon stored in coastal and marine ecosystems. These habitats can hold large amounts of carbon in plants and soil. Mangroves, for example, store carbon at much higher rates than many land forests. Protecting them reduces greenhouse gases in the atmosphere.
Biodiversity credits are a related concept. They reward actions that protect or restore species and ecosystems. They work alongside carbon credits but focus more on ecosystem health and species diversity. Markets for biodiversity credits are being discussed globally as a complement to carbon markets.
Why the Philippines Is Targeting Blue Carbon
The Philippines is rich in coastal ecosystems. It has more than 327,000 hectares of mangroves along its shores. These areas protect coastlines from storms, support fisheries, and store carbon.
Mangroves and seagrasses also support high levels of biodiversity. Many fish, birds, and marine species depend on these habitats. Restoring these ecosystems helps conserve species and supports local food systems.
The NBCAP Roadmap was handed over to the Department of Environment and Natural Resources (DENR) during the Philippine Mangrove Conference 2026. The roadmap is a strategy to protect blue carbon ecosystems while linking them to climate goals and local livelihoods.
DENR Undersecretary, Atty. Analiza Rebuelta-Teh, remarked during the turnover:
“This Roadmap reflects the Philippines’ strong commitment to advancing blue carbon accounting and delivering tangible impact for coastal communities.”
Edwina Garchitorena, country director of ZSL Philippines, which will oversee its implementation, also commented:
“The handover of the NBCAP Roadmap to the DENR represents a turning point in advancing blue carbon action and strengthening the Philippines’ leadership in coastal conservation in the region.”
The plan highlights four main pillars:
- Science, technology, and innovation.
- Policy and governance.
- Communication and community engagement.
- Finance and sustainable livelihoods.
These pillars aim to strengthen coastal resilience, support community well‑being, and align blue carbon action with national climate commitments.
What Blue Carbon Credits Could Mean for Markets
Globally, blue carbon markets are growing. These markets allow coastal restoration projects to sell carbon credits. Projects that preserve or restore mangroves, seagrass meadows, and tidal marshes can generate credits. Buyers pay for these credits to offset emissions.
According to Grand View Research, the global blue carbon market was valued at US$2.42 million in 2025. It is projected to reach US$14.79 million by 2033, growing at a compound annual growth rate (CAGR) of almost 25%.
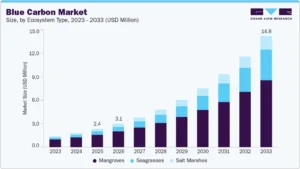
The Asia Pacific region led the market in 2025, with 39% of global revenue, due to its extensive coastal ecosystems and government support. Within the market, mangroves accounted for 68% of revenue, reflecting their high carbon storage capacity.
Blue carbon credits belong to the voluntary carbon market. Companies purchase these credits to offset emissions they can’t eliminate right now. Buyers are often motivated by sustainability goals and environmental, social, and corporate governance (ESG) standards.
Experts at the UN Environment Programme say these blue habitats can capture carbon 4x faster than forests:
Why Biodiversity Credits Matter: Rewarding Species, Strengthening Ecosystems
Carbon credits aim to cut greenhouse gases. In contrast, biodiversity credits focus on saving species and habitats. These credits reward projects that improve ecosystem health and may be used alongside carbon markets to attract finance for nature.
Biodiversity credits are particularly relevant in the Philippines, one of 17 megadiverse countries. The nation is home to thousands of unique plant and animal species. Supporting biodiversity through market mechanisms can strengthen conservation efforts while also supporting local communities.
Globally, biodiversity credit markets are still developing. Organizations such as the Biodiversity Credit Alliance are creating standards to ensure transparency, equity, and measurable outcomes. They want to link private investment to good environmental outcomes. They also respect the rights of local communities and indigenous peoples.
These markets complement carbon markets. They can support conservation efforts. This boosts ecosystem resilience and protects species while also capturing carbon.
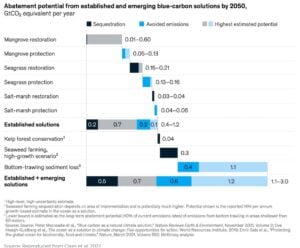
Together with blue carbon credits, they form part of a broader nature-based solution to climate change and biodiversity loss. A report by the Ecosystem Marketplace estimates the potential carbon abatement for every type of blue carbon solution by 2050.
Science, Policy, and Funding: The Roadblocks Ahead
Building blue carbon and biodiversity credit markets is not easy. There are several challenges ahead for the Philippines.
One key challenge is measurement and verification. To sell carbon or biodiversity credits, projects must prove they deliver real and measurable benefits. This requires science‑based methods and monitoring systems.
Another challenge is finance. Case studies reveal that creating a blue carbon action roadmap in the Philippines may need around US$1 million. This funding will help set up essential systems and support initial actions.
Policy frameworks are also needed. Laws and rules must support credit issuance, protect local rights, and ensure fair sharing of benefits. Coordination across government agencies, local communities, and investors will be important.
Stakeholder engagement is key. The NBCAP Roadmap and related forums involve scientists, policymakers, civil society, and private sector partners. This teamwork approach makes sure actions are based on science, inclusive, and fair in the long run.
Looking Ahead: Coastal Conservation as Climate Strategy
Blue carbon and biodiversity credits could provide multiple benefits for the Philippines. Protecting and restoring coastal habitats reduces greenhouse gases, conserves species, and supports local economies. Coastal ecosystems also provide natural defenses against storms and rising seas.
If blue carbon and biodiversity credit markets grow, they could fund coastal conservation at scale while supporting global climate targets. Biodiversity credits could further enhance ecosystem protection by linking nature’s intrinsic value to market mechanisms.
The market also involves climate finance and corporate buyers looking for quality credits. Additionally, international development partners focused on coastal resilience may join in.
For the Philippines, the next few years will be critical. Implementing the NBCAP roadmap, establishing credit systems, and strengthening governance could unlock new opportunities for climate action, sustainable development, and regional leadership in blue carbon finance.
The post Philippines Taps Blue Carbon and Biodiversity Credits to Protect Coasts and Climate appeared first on Carbon Credits.

The global electric vehicle (EV) market is gaining speed again. A sharp rise in oil prices, triggered by the recent U.S.–Iran conflict in early 2026, has changed how consumers think about fuel and mobility. What looked like a slow market just months ago is now showing strong signs of recovery.
According to SNE Research’s latest report, this sudden shift in energy markets is pushing EV adoption faster than expected. Rising gasoline costs and uncertainty about future oil supply are driving buyers toward electric cars. As a result, the EV transition is no longer gradual—it is accelerating.
Oil Price Shock Changes Consumer Behavior
The conflict in the Middle East sent oil markets into turmoil. Gasoline prices jumped quickly, rising from around 1,600–1,700 KRW per liter to as high as 2,200 KRW. This sudden spike acted as a wake-up call for many drivers.
Consumers who once hesitated to switch to EVs are now rethinking their choices. High and unstable fuel prices have made traditional gasoline vehicles less attractive. At the same time, EVs now look more cost-effective and reliable over the long term.
SNE Research noted that even if oil prices stabilize later, the fear of future spikes will remain. This uncertainty is a key driver behind early EV adoption. People no longer want to depend on volatile fuel markets.
EV Growth Forecasts Get a Major Boost
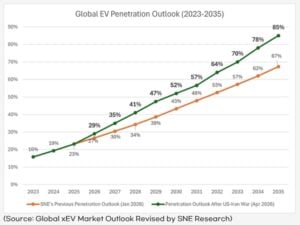
SNE Research has revised its global EV outlook. The firm now expects faster adoption across the decade.
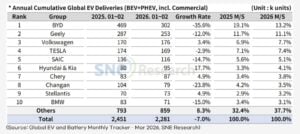
- EV market penetration is projected to reach 29% in 2026, up from an earlier estimate of 27%.
- By 2027, the share could jump to 35%, instead of the previously expected 30%.
- Most importantly, EVs are now expected to cross 50% of new car sales by 2030, earlier than prior forecasts.

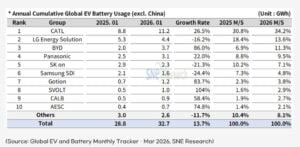
The post Global EV Sales Set to Hit 50% by 2030 Amid Oil Shock While CATL Leads Batteries appeared first on Carbon Credits.
Carbon Footprint
AI Data Centers Power Crisis: Massive Energy Demand Threatens Emissions Targets and Latest Delays Signal Market Shift

The rapid growth of artificial intelligence (AI) is creating a new challenge for global energy systems. AI data centers now require far more electricity than traditional computing facilities. This surge in demand is putting pressure on power grids and raising concerns about whether climate targets can still be met.
Large AI data centers typically need 100 to 300 megawatts (MW) of continuous power. In contrast, conventional data centers use around 10-50 MW. This makes AI facilities up to 10x more energy-intensive, depending on the scale and workload.
AI Data Centers Are Driving a Sharp Rise in Power Demand
The increase is happening quickly. The International Energy Agency estimates that global data center electricity use reached about 415 terawatt-hours (TWh) in 2024. That number could rise to more than 1,000 TWh by 2026, largely driven by AI applications such as machine learning, cloud computing, and generative models. 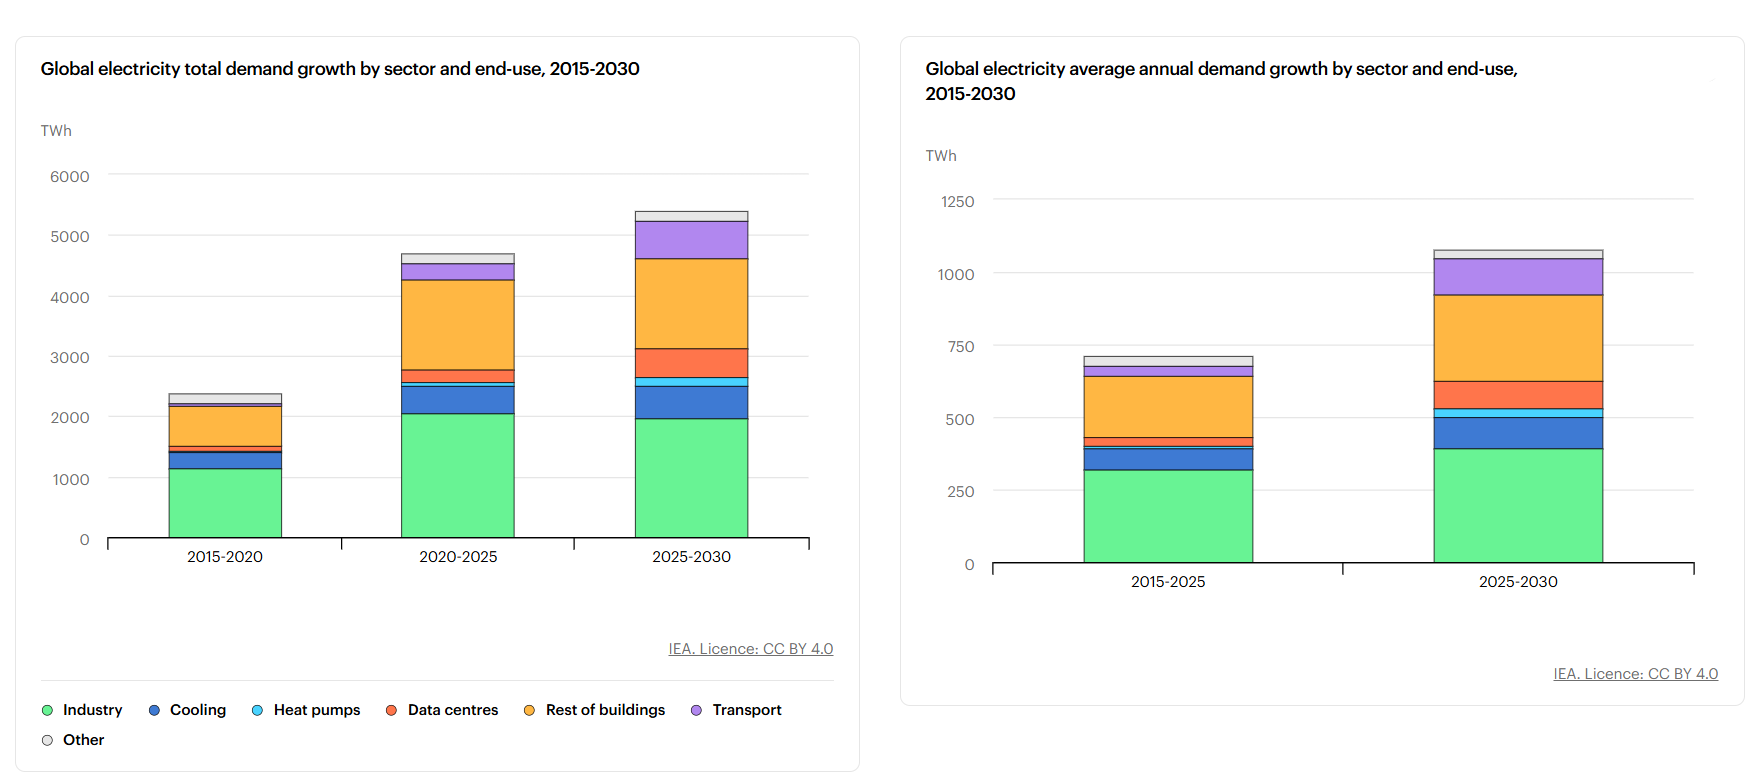
At that level, data centers would consume as much electricity as an entire mid-sized country like Japan.
In the United States, the impact is also growing. Data centers could account for 6% to 8% of total electricity demand by 2030, based on utility projections and grid operator estimates. AI is expected to drive most of that increase as companies continue to scale infrastructure to support new applications.
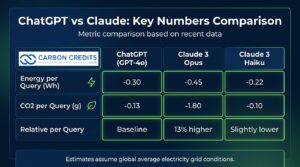
Training large AI models is especially energy-intensive. Some estimates say an advanced model can use millions of kilowatt-hours (kWh) just for training. For instance, training GPT-3 needs roughly 1.287 million kWh, and Google’s PaLM at about 3.4 million kWh. Analytical estimates suggest training newer models like GPT-4 may require between 50 million and over 100 million kWh.
That is equal to the annual electricity use of hundreds of households. When combined with ongoing usage, known as inference, total energy consumption rises even further.
This rapid growth is creating a gap between electricity demand and available supply. It is also raising questions about how the technology sector can expand while staying aligned with global climate goals.
The Grid Bottleneck: Why Data Centers Are Waiting Years for Power
Power demand from AI is rising faster than grid infrastructure can support. Utilities in key regions are now facing a surge in interconnection requests from technology companies building new data centers.
This has led to delays in several major projects. In many cases, developers must wait years before they can secure enough electricity to operate. These delays are becoming more common in established tech hubs where grid capacity is already stretched.
The main constraints include:
- Limited transmission capacity in high-demand areas,
- Slow grid upgrades and long permitting timelines, and
- Regulatory systems not designed for AI-scale demand.
Grid stability is another concern. AI data centers require constant and uninterrupted power. Even short disruptions can affect performance and reliability. This makes it more difficult for utilities to balance supply and demand, especially during peak periods.
In some regions, utilities are struggling to manage the size and concentration of new loads. A single large data center can use as much electricity as a small city. When several projects are planned in the same area, the pressure on local infrastructure increases significantly.
As a result, some companies are rethinking their expansion strategies. Projects may be delayed, scaled down, or moved to new locations where energy is more accessible. These shifts could slow the pace of AI deployment, at least in the short term.
Renewable Energy Growth Faces a Reality Check
Technology companies have made strong commitments to clean energy. Many aim to power their operations with 100% renewable electricity. This is part of their larger environmental, social, and governance (ESG) goals.
For example, Microsoft plans to become carbon negative by 2030, meaning it will remove more carbon than it emits. Google is targeting 24/7 carbon-free energy by 2030, which goes beyond annual matching to ensure clean power is used at all times. Amazon has committed to reaching net-zero carbon emissions by 2040 under its Climate Pledge.
Despite these targets, AI data centers present a difficult challenge. They need reliable electricity around the clock, while renewable energy sources such as wind and solar are not always available. Output can vary depending on weather conditions and time of day.
To maintain stable operations, many facilities rely on a mix of energy sources. This often includes grid electricity, which may still be partly generated from fossil fuels. In some cases, natural gas backup systems are used more frequently than planned.
Battery storage can help balance supply and demand. However, long-duration storage remains expensive and is not yet widely deployed at the scale needed for large AI facilities. This creates both technical and financial barriers.
Thus, there is a growing gap between corporate clean energy goals and real-world energy use. Closing that gap will require faster deployment of renewable energy, improved storage solutions, and more flexible grid systems.
Carbon Credits Use Surge as Tech Tries to Close the Emissions Gap
The mismatch between AI growth and clean energy supply is also affecting carbon markets. Many technology companies are increasing their use of carbon credits to offset emissions linked to data center operations.
According to the World Bank’s State and Trends of Carbon Pricing 2025, carbon pricing now covers over 28% of global emissions. But carbon prices vary widely—from under $10 per ton in some systems to over $100 per ton in stricter markets. This gap is pushing companies toward voluntary carbon markets.

The Ecosystem Marketplace report shows rising demand for high-quality credits, especially carbon removal rather than avoidance credits. But supply is still limited.
Costs are especially high for engineered removals. The IEA estimates that direct air capture (DAC) costs today range from about $600 to over $1,000 per ton of CO₂. It may fall to $100–$300 per ton in the future, but supply is still very small.
Companies are focusing on credits that:
- Deliver verified emissions reductions,
- Support long-term carbon removal, and
- Align with ESG and net-zero commitments.
At the same time, many firms are taking a more active role in energy development. Instead of relying only on offsets, they are investing directly in renewable energy projects. This includes funding new solar and wind farms, as well as entering long-term power purchase agreements.
These investments help secure a dedicated clean energy supply. They also reduce long-term exposure to carbon markets, which can be volatile and subject to changing standards.
Companies Are Adapting Their Energy Strategies: The New AI Energy Playbook
AI companies are changing how they design and operate data centers to manage rising energy demand. Here are some of the key strategies:
- Energy efficiency improvements (new hardware and cooling systems) that reduce data center power use.
- More efficient AI chips, specialized processors, that drive performance gains.
- Advanced cooling systems that cut energy waste and can help cut total power use per workload by 20% to 40%.
- Data center location strategy is shifting, where facilities are built in regions with stronger renewable energy access.
- Infrastructure is becoming more distributed, where firms deploy smaller data centers across multiple locations to balance demand and improve resilience.
- Long-term renewable energy contracts are expanding, which helps companies secure power at stable prices.
A Turning Point for Energy and Climate Goals
The rise of AI is creating both risks and opportunities for the global energy transition. In the short term, increased electricity demand could lead to higher emissions if fossil fuels are used to fill supply gaps.
At the same time, AI is driving major investment in clean energy and infrastructure. The long-term outcome will depend on how quickly clean energy systems can scale.
If renewable supply, storage, and grid capacity keep pace with AI growth, the technology sector could help accelerate the shift to a low-carbon economy. If progress is too slow, however, AI could become a major new source of emissions.
Either way, AI is now a central force shaping global energy demand, infrastructure investment, and the future of carbon markets.
The post AI Data Centers Power Crisis: Massive Energy Demand Threatens Emissions Targets and Latest Delays Signal Market Shift appeared first on Carbon Credits.


-
Climate Change8 months ago
Guest post: Why China is still building new coal – and when it might stop
-
Greenhouse Gases8 months ago
Guest post: Why China is still building new coal – and when it might stop
-

 Greenhouse Gases2 years ago
嘉宾来稿:满足中国增长的用电需求 光伏加储能“比新建煤电更实惠”
-
Climate Change2 years ago
Bill Discounting Climate Change in Florida’s Energy Policy Awaits DeSantis’ Approval
-

 Climate Change2 years ago
嘉宾来稿:满足中国增长的用电需求 光伏加储能“比新建煤电更实惠”
-
Climate Change Videos2 years ago
The toxic gas flares fuelling Nigeria’s climate change – BBC News
-

 Renewable Energy6 months ago
Sending Progressive Philanthropist George Soros to Prison?
-

 Carbon Footprint2 years ago
US SEC’s Climate Disclosure Rules Spur Renewed Interest in Carbon Credits