
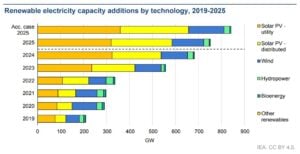
The world’s renewable energy sector has entered a new phase of record growth. According to the International Energy Agency’s Renewables 2025 report, global renewable power capacity grew by more than 510 gigawatts (GW) in 2024 — the fastest increase ever recorded. Another 520 GW is expected to be added in 2025, pushing renewables to account for over 90% of all new global power capacity.
Solar and wind dominate this growth. By 2025, solar will account for nearly three-quarters of new installations. This growth comes from cheaper technology, improved grid integration, and supportive policies. Wind power is also recovering after a slowdown in 2022–2023, supported by new offshore projects in Europe, China, and the United States.
The IEA says the world’s total renewable capacity will reach nearly 5,800 GW by 2025, up from around 4,200 GW in 2023. That means renewables now generate about 30% of global electricity and are on track to reach 42–45% by 2030.
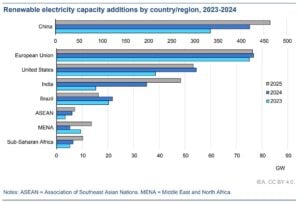
Four regions — China, Europe, the United States, and India — are responsible for almost 90% of this global expansion. Each is moving at a different pace, but together they are transforming how the world produces and consumes energy.
Europe: Accelerating the Energy Transition
Europe continues to lead in energy policy and innovation. In 2024, the European Union added more than 70 GW of new renewable capacity, driven mainly by solar. This is a record year. It shows the bloc’s goal to cut reliance on imported fossil fuels. They aim to meet their Green Deal target of a 55% emissions reduction by 2030.
Solar capacity across the EU doubled between 2020 and 2024, reaching over 300 GW, while wind capacity passed 220 GW. The IEA predicts that Europe will add 450 GW of renewables from 2025 to 2030. This will raise the total capacity to almost 870 GW by the end of the decade.
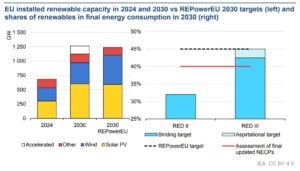
Much of this growth is tied to the REPowerEU plan, which aims to speed up permitting and expand rooftop solar. Offshore wind is gaining popularity. Countries like Germany, Denmark, and the Netherlands are investing in North Sea projects.
Despite progress, Europe faces challenges. Delays in grid expansion and limited local manufacturing capacity for wind turbines have created supply bottlenecks. Even so, strong policy support and high carbon prices still make renewables the best choice for power generation.
United States: Policy Support and Private Investment Drive Expansion
The United States is entering a period of major renewable growth, supported by the Inflation Reduction Act (IRA) and record private investment. The IEA expects the U.S. to add around 400 GW of new renewable capacity by 2030, effectively doubling its current base.
In 2024, U.S. solar installations rose by nearly 40%, reaching 45 GW for the year. Solar now accounts for the largest share of new capacity additions. Wind power also recovered, with onshore and offshore projects expanding in Texas, California, and along the East Coast.
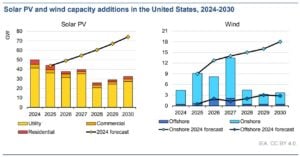
Renewables currently generate about 26% of U.S. electricity, up from 22% in 2022. The IEA projects this share will climb to over 40% by 2030, driven by federal tax incentives and falling technology costs.
Battery storage is another fast-growing sector. Storage capacity doubled between 2023 and 2024, helping stabilize variable solar and wind output. The IRA’s clean energy credits could draw over $400 billion in investments by 2032. This boost will help generate energy and support U.S. manufacturing of solar panels and turbines.
Challenges remain. The U.S. needs to modernize its grid and streamline permitting for transmission lines to connect renewable projects to demand centers. But the direction is clear — renewables are becoming the backbone of America’s energy system.
China: The Global Powerhouse of Renewables
China remains the undisputed leader in renewable energy growth. The IEA projects that China will account for about 60% of all new renewable capacity added worldwide by 2030.
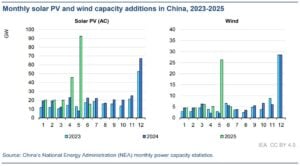
In 2024 alone, China installed more than 260 GW of new renewables — more than the rest of the world combined. Solar made up the majority of this, with over 190 GW of solar capacity added during the year.
Wind power grew by 60 GW. China kept building big onshore and offshore projects in Inner Mongolia, coastal areas, and deserts.
China now has an estimated 1,400 GW of total renewable capacity, representing about half of the global total. Renewables already supply more than 35% of China’s electricity, up from 27% in 2020.
Government policy is the key driver. China aims to reach 1,200 GW of combined solar and wind capacity by 2030, a target it is likely to achieve five years early. The country’s large manufacturing base keeps equipment prices low globally. This helps other regions grow their clean energy fleets.
Still, integration challenges persist. Some provinces face grid congestion and curtailment — when renewable power can’t be used due to transmission limits. The IEA recommends that China continue to invest in grid upgrades and flexible storage systems to handle its rapid growth.
India: The Fastest-Growing Emerging Market for Renewables
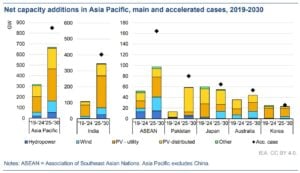
India is now the fastest-growing renewable energy market among developing economies. The IEA expects India’s renewable capacity to nearly double between 2023 and 2030, expanding from around 190 GW to 360–380 GW.
Solar energy is leading the charge. In 2024, India added more than 17 GW of solar capacity, supported by large auctions and declining costs. Wind capacity also grew modestly, and new hybrid projects combining solar and wind are improving reliability.
The government’s goal is ambitious: 500 GW of non-fossil capacity by 2030, which would cover about 50% of total power demand. India is also expanding its domestic solar manufacturing base to reduce dependence on imports.
Hydropower and bioenergy continue to play supporting roles, particularly in rural electrification. The IEA reports that renewable energy in India cuts over 250 million tonnes of CO₂ emissions each year. This makes India a major player in global emission reductions, second only to China.
However, financing and grid infrastructure remain key hurdles. The report notes that India needs annual clean energy investments of about $60–70 billion through 2030 to meet its targets.
The chart below compares renewable energy capacity in 2024 vs. 2030 projections for the four key regions, based on the IEA Renewables 2025 report.
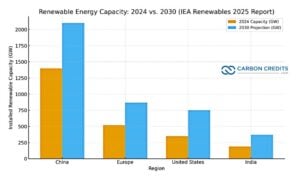
It clearly shows China’s dominant position, followed by steady growth in Europe and the U.S., and rapid expansion in India’s renewable capacity by the end of the decade.
The Decade of Clean Power: A Turning Point for Global Energy
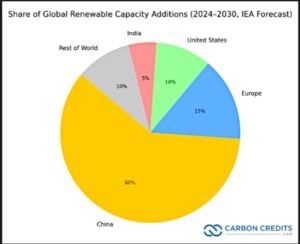
The combined momentum of China, Europe, the United States, and India is reshaping global energy markets. Together, these four regions will account for almost 90% of all renewable capacity growth by 2030.
The pie chart shows each region’s share of total global renewable capacity additions from 2024 to 2030, based on the IEA forecast. It also shows how dominant China remains in driving renewable expansion, while Europe, the U.S., and India together account for about one-third of the world’s clean-energy growth.
Global renewable electricity capacity is expected to surpass 6,200 GW in 2025 and reach 8,300 GW by 2030 — roughly triple the total in 2015. Solar will remain the dominant source, followed by wind and hydropower.
Yet challenges persist. The IEA warns that grid constraints, permitting delays, and uneven financing could slow progress in developing economies. To stay on track for the net-zero pathway, annual renewable additions must rise to around 800 GW per year by 2030.
Still, the direction is clear. The world is entering a decade where clean power becomes the main driver of growth, investment, and energy security. The actions of these four key players will determine how fast the transition happens and how close we come to a truly sustainable global energy system.
- FURTHER READING: Renewable Energy Investment Reaches Record High as China Operates World’s Biggest Solar Farm
The post Renewables 2025: How China, the US, Europe, and India Are Leading the World’s Clean Energy Growth appeared first on Carbon Credits.
For most businesses, the emissions that matter most sit outside their own walls. Scope 3 emissions, everything generated across your value chain, from the suppliers who make your inputs to the customers who use your products, typically make up the majority of a company’s total carbon footprint. Under the Corporate Sustainability Reporting Directive (CSRD), those value-chain emissions now have to be measured and disclosed with a rigour that spend-based estimates alone struggle to satisfy. This guide sets out how to improve Scope 3 data accuracy for CSRD: the calculation methods open to you, how to move from estimates to verified supplier data, and how to govern that data so it holds up to audit.
![]()
A carbon credit is a commitment that extends well into the future. The tonne of CO₂ compensated for today from a nature-based carbon project must remain out of the atmosphere for good, which means the forest behind the credit has to remain standing long after the transaction is complete. For any buyer, this raises a defining question: What ensures that the forest endures?
![]()
What replaced the cheap REDD credit on the boardroom slide deck, and why procurement is leading the rewrite.
Three years ago, a corporate slide showing a portfolio of cheap REDD+ credits could carry a board meeting. The number was big, the price was low, and the press release wrote itself. Today, that same slide gets sent back with questions. The questions are uncomfortable, the answers are unclear, and your general counsel is suddenly in the room.
Conventional carbon offsets are not dead. The voluntary carbon market retired 202 million tonnes in 2025, and the Morgan Stanley Institute for Sustainable Investing survey published in January 2026 confirmed that interest from corporate buyers remains substantial. What changed is the credibility threshold. The integrity floor has risen, the disclosure scrutiny has tightened, and the buyer profile has shifted. This article tracks what changed, what sophisticated buyers now ask before signing, and what serious corporates are putting on the board slide instead.
What boards used to buy, and why it stopped working
The 2020 to 2022 model was simple: buy a large tranche of avoidance credits at low single-digit prices, retire them against the company footprint, announce the carbon-neutral claim, and move on. Most of those credits came from REDD+ projects, renewable energy installations in countries where the renewable energy was already economic, or methane projects with thin documentation.
Several things broke that model. Academic research published in 2023, including a widely cited Science paper, found that the majority of REDD+ credits issued under the most common methodologies did not represent additional reductions when tested against rigorous counterfactuals. The Voluntary Carbon Markets Integrity Initiative published its Claims Code of Practice, which sets requirements for what companies can credibly claim from credit use. The European Union finalised its Green Claims Directive, restricting how companies can describe products as climate-neutral. France’s Décret 2022-539 already restricts carbon neutrality advertising. California’s AB 1305 imposes disclosure requirements on any company making net-zero or carbon-neutral claims while doing business in the state.
The collective effect: the cheap credit no longer buys the announcement, and the announcement now carries litigation risk.
The integrity reset: ICVCM, VCMI, and what changed
The Integrity Council for the Voluntary Carbon Market published the Core Carbon Principles in 2023 and began assessing methodologies against them in 2024. The first methodologies received the CCP label later that year. The point of the label is to give corporate buyers a defensible quality screen they can cite in disclosure.
The Voluntary Carbon Markets Integrity Initiative complements this on the demand side. Its Claims Code of Practice defines what a buyer can say (Silver, Gold, or Platinum claims, with associated requirements) based on the quality of credits used and the underlying decarbonisation strategy. Together, CCP and VCMI build a quality stack: CCP on the supply, VCMI on the claim, with the science-based target sitting underneath both.
The reset is not a ban on offsets. It is a ratchet. Credits that meet the new bar continue to clear; credits that do not, do not. The Morgan Stanley survey found that 61% of current buyers like the CCP label concept but that supply of labelled credits remains limited. That supply constraint is now visible in pricing.
What sophisticated buyers ask before they sign
The questions on the procurement scorecard have changed. A 2022 buyer might have asked about price, vintage, and project type. A 2026 buyer asks five different questions before any of those.
- What does the counterfactual look like, and who validated it.
- What is the permanence regime, and what is the buffer pool exposure.
- What is the leakage risk, and how is it mitigated.
- What rating has the project received from the independent ratings agencies (Sylvera, BeZero, Calyx Global), and what was the rationale.
- What is the documentation discipline that survives an audit four years from now when the procurement team that signed the contract has moved on.
If the vendor cannot answer those five questions on a first call, the conversation ends. Conversely, if the vendor can answer them with documented specificity, the conversation often expands beyond a single transaction toward a multi-year engagement.
Where this leaves your near-term commitments
You probably have near-term commitments that pre-date the integrity reset. Public targets to be carbon neutral by 2025 or 2030. Product-level claims that ran in last year’s marketing. Disclosed reduction trajectories that assumed continued access to cheap credits.
You have three workable paths. The first is to re-baseline your strategy, replacing the most exposed credits with higher-quality alternatives and adjusting the public language to match what you can defend. The second is to shift the underlying spend from offsetting outside your value chain to investing inside your value chain, where reductions count against Scope 3 directly and the audit trail is cleaner. The third is to keep the strategy and absorb the risk, which is increasingly the most expensive option once you price in litigation, restatement, and reputational exposure.
Most serious buyers are choosing the second path. It moves the carbon spend from a compliance cost to a procurement and resilience investment, and it removes the central failure point of the legacy model: the disconnect between where the emissions occurred and where the reductions sat. Nature-based supply chain investments, structured under the GHG Protocol Land Sector and Removals Standard and aligned to the SBTi FLAG Guidance, are the asset class that fits this brief. They generate inventory-grade reductions, they produce audit-grade documentation, and they survive the new claim restrictions because the carbon math sits inside the value chain that the disclosure already covers.
If you are reassessing a carbon strategy under the new integrity bar, or rebuilding a board narrative that has to survive a more skeptical audience, the carbon and sustainability experts at Carbon Credit Capital can help. The Dual-Value Model gives you a defensible alternative to legacy offset purchases, with the documentation and operational integration that survives the procurement scorecard and the audit. Schedule a consultation.


-
Climate Change11 months ago
Guest post: Why China is still building new coal – and when it might stop
-
Greenhouse Gases11 months ago
Guest post: Why China is still building new coal – and when it might stop
-

 Greenhouse Gases2 years ago
嘉宾来稿:满足中国增长的用电需求 光伏加储能“比新建煤电更实惠”
-

 Climate Change2 years ago
嘉宾来稿:满足中国增长的用电需求 光伏加储能“比新建煤电更实惠”
-
Climate Change2 years ago
Bill Discounting Climate Change in Florida’s Energy Policy Awaits DeSantis’ Approval
-

 Renewable Energy9 months ago
Sending Progressive Philanthropist George Soros to Prison?
-

 Carbon Footprint2 years ago
US SEC’s Climate Disclosure Rules Spur Renewed Interest in Carbon Credits
-
Greenhouse Gases1 year ago
嘉宾来稿:探究火山喷发如何影响气候预测