

International Seaweed Symposium
My name is Friederike Gronwald. I am a third-year PhD student in the Management Ecology of Marine Macrophytes Group (RU Experimental Ecology) at the GEOMAR Helmholtz Centre for Ocean Research. My work focuses on the hydrodynamic and aerodynamic effects on the drifting behaviour of marine macrophytes with diverse morphologies in the Baltic Sea.
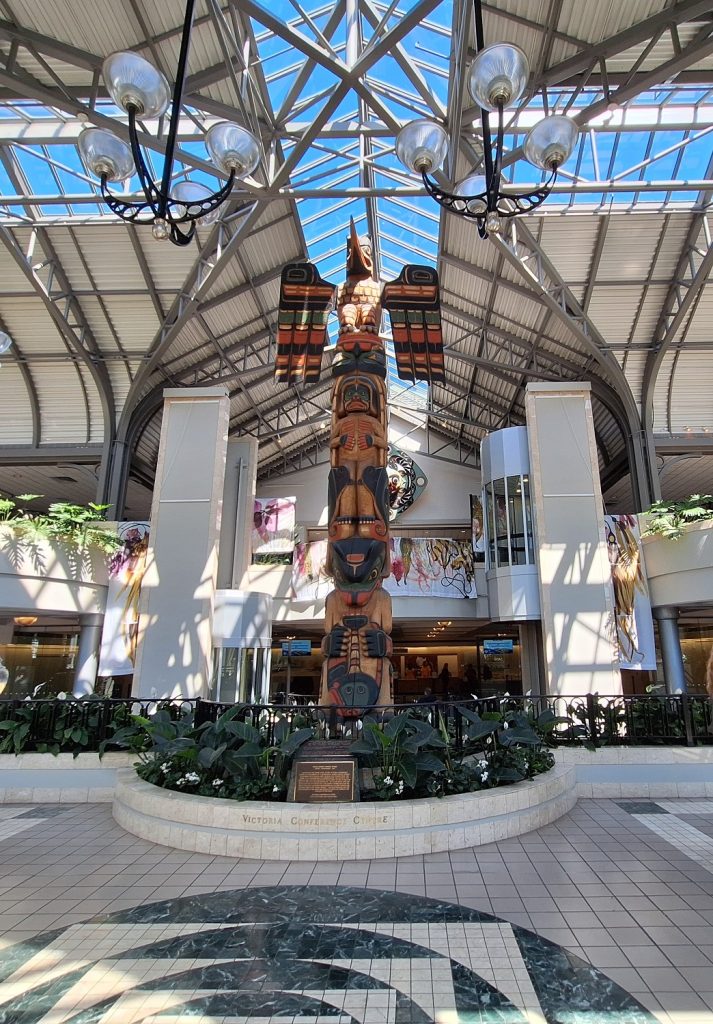
I had the opportunity to attend the 25th International Seaweed Symposium in Victoria, Canada, with the help of the FYORD travel grant. This conference focuses solely on seaweed research and its applications. It is organised every three years in a different country, with over 700 people from 43 countries participating this year.
As this was my first international conference, I was quite nervous at first, but I soon became more relaxed after talking to other people and meeting lots of interesting researchers. My goal for the conference was to meet new people for possible collaborations and knowledge transfer and I was definitely able to achieve that. I was fortunate to be able to present my research in a talk, which enabled me to get in touch with even more people.
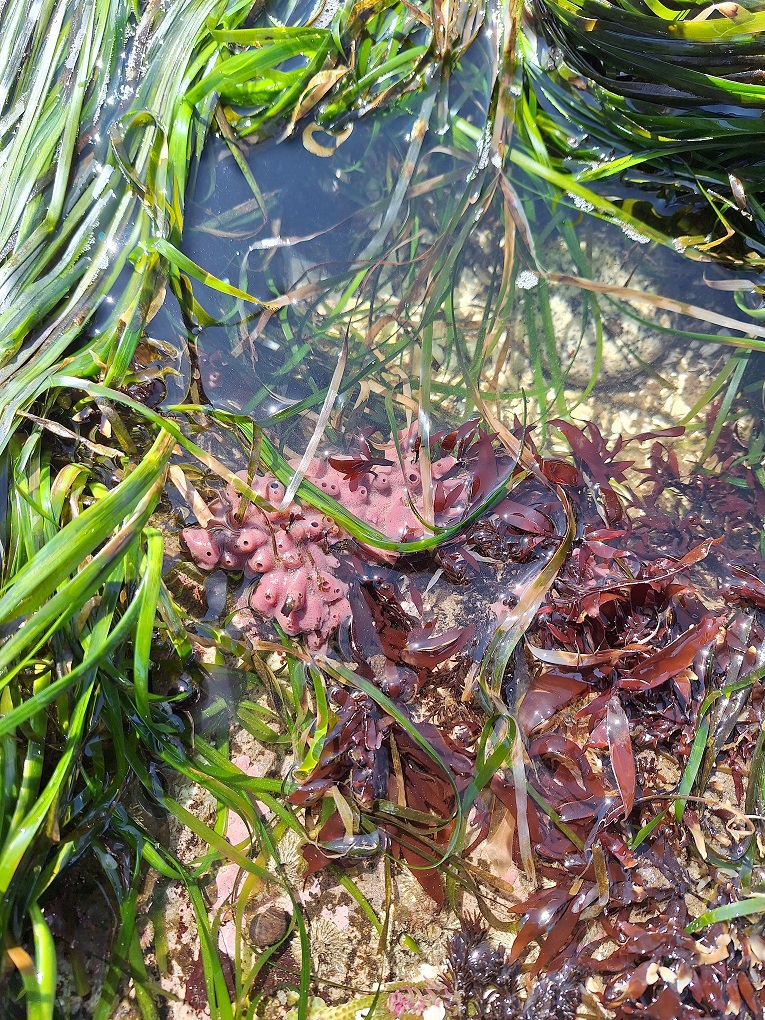
Next to all the interesting sessions, the conference offered great workshops and tours. I was able to attend an intertidal tour, where experts from the University of Victoria explained many interesting facts about the marine macrophytes. It was fascinating to explore a new ecosystem based on various kelp species. Another highlight was the whale-watching tour, where we got to see humpback whales and spent the afternoon on the water.
Overall, it was a great experience to present my work and meet lots of new people. I would recommend the International Seaweed Symposium to anyone working with macroalgae.
Friederike

Ocean Acidification
Dr Heidarzadeh’s TV interview with SkyNews on the massive M7.7 Panama earthquake on 9 October 2026
Dr Heidarzadeh’s TV interview with SkyNews on the massive M7.7 Panama earthquake on 9 October 2026. Click here for the full story.
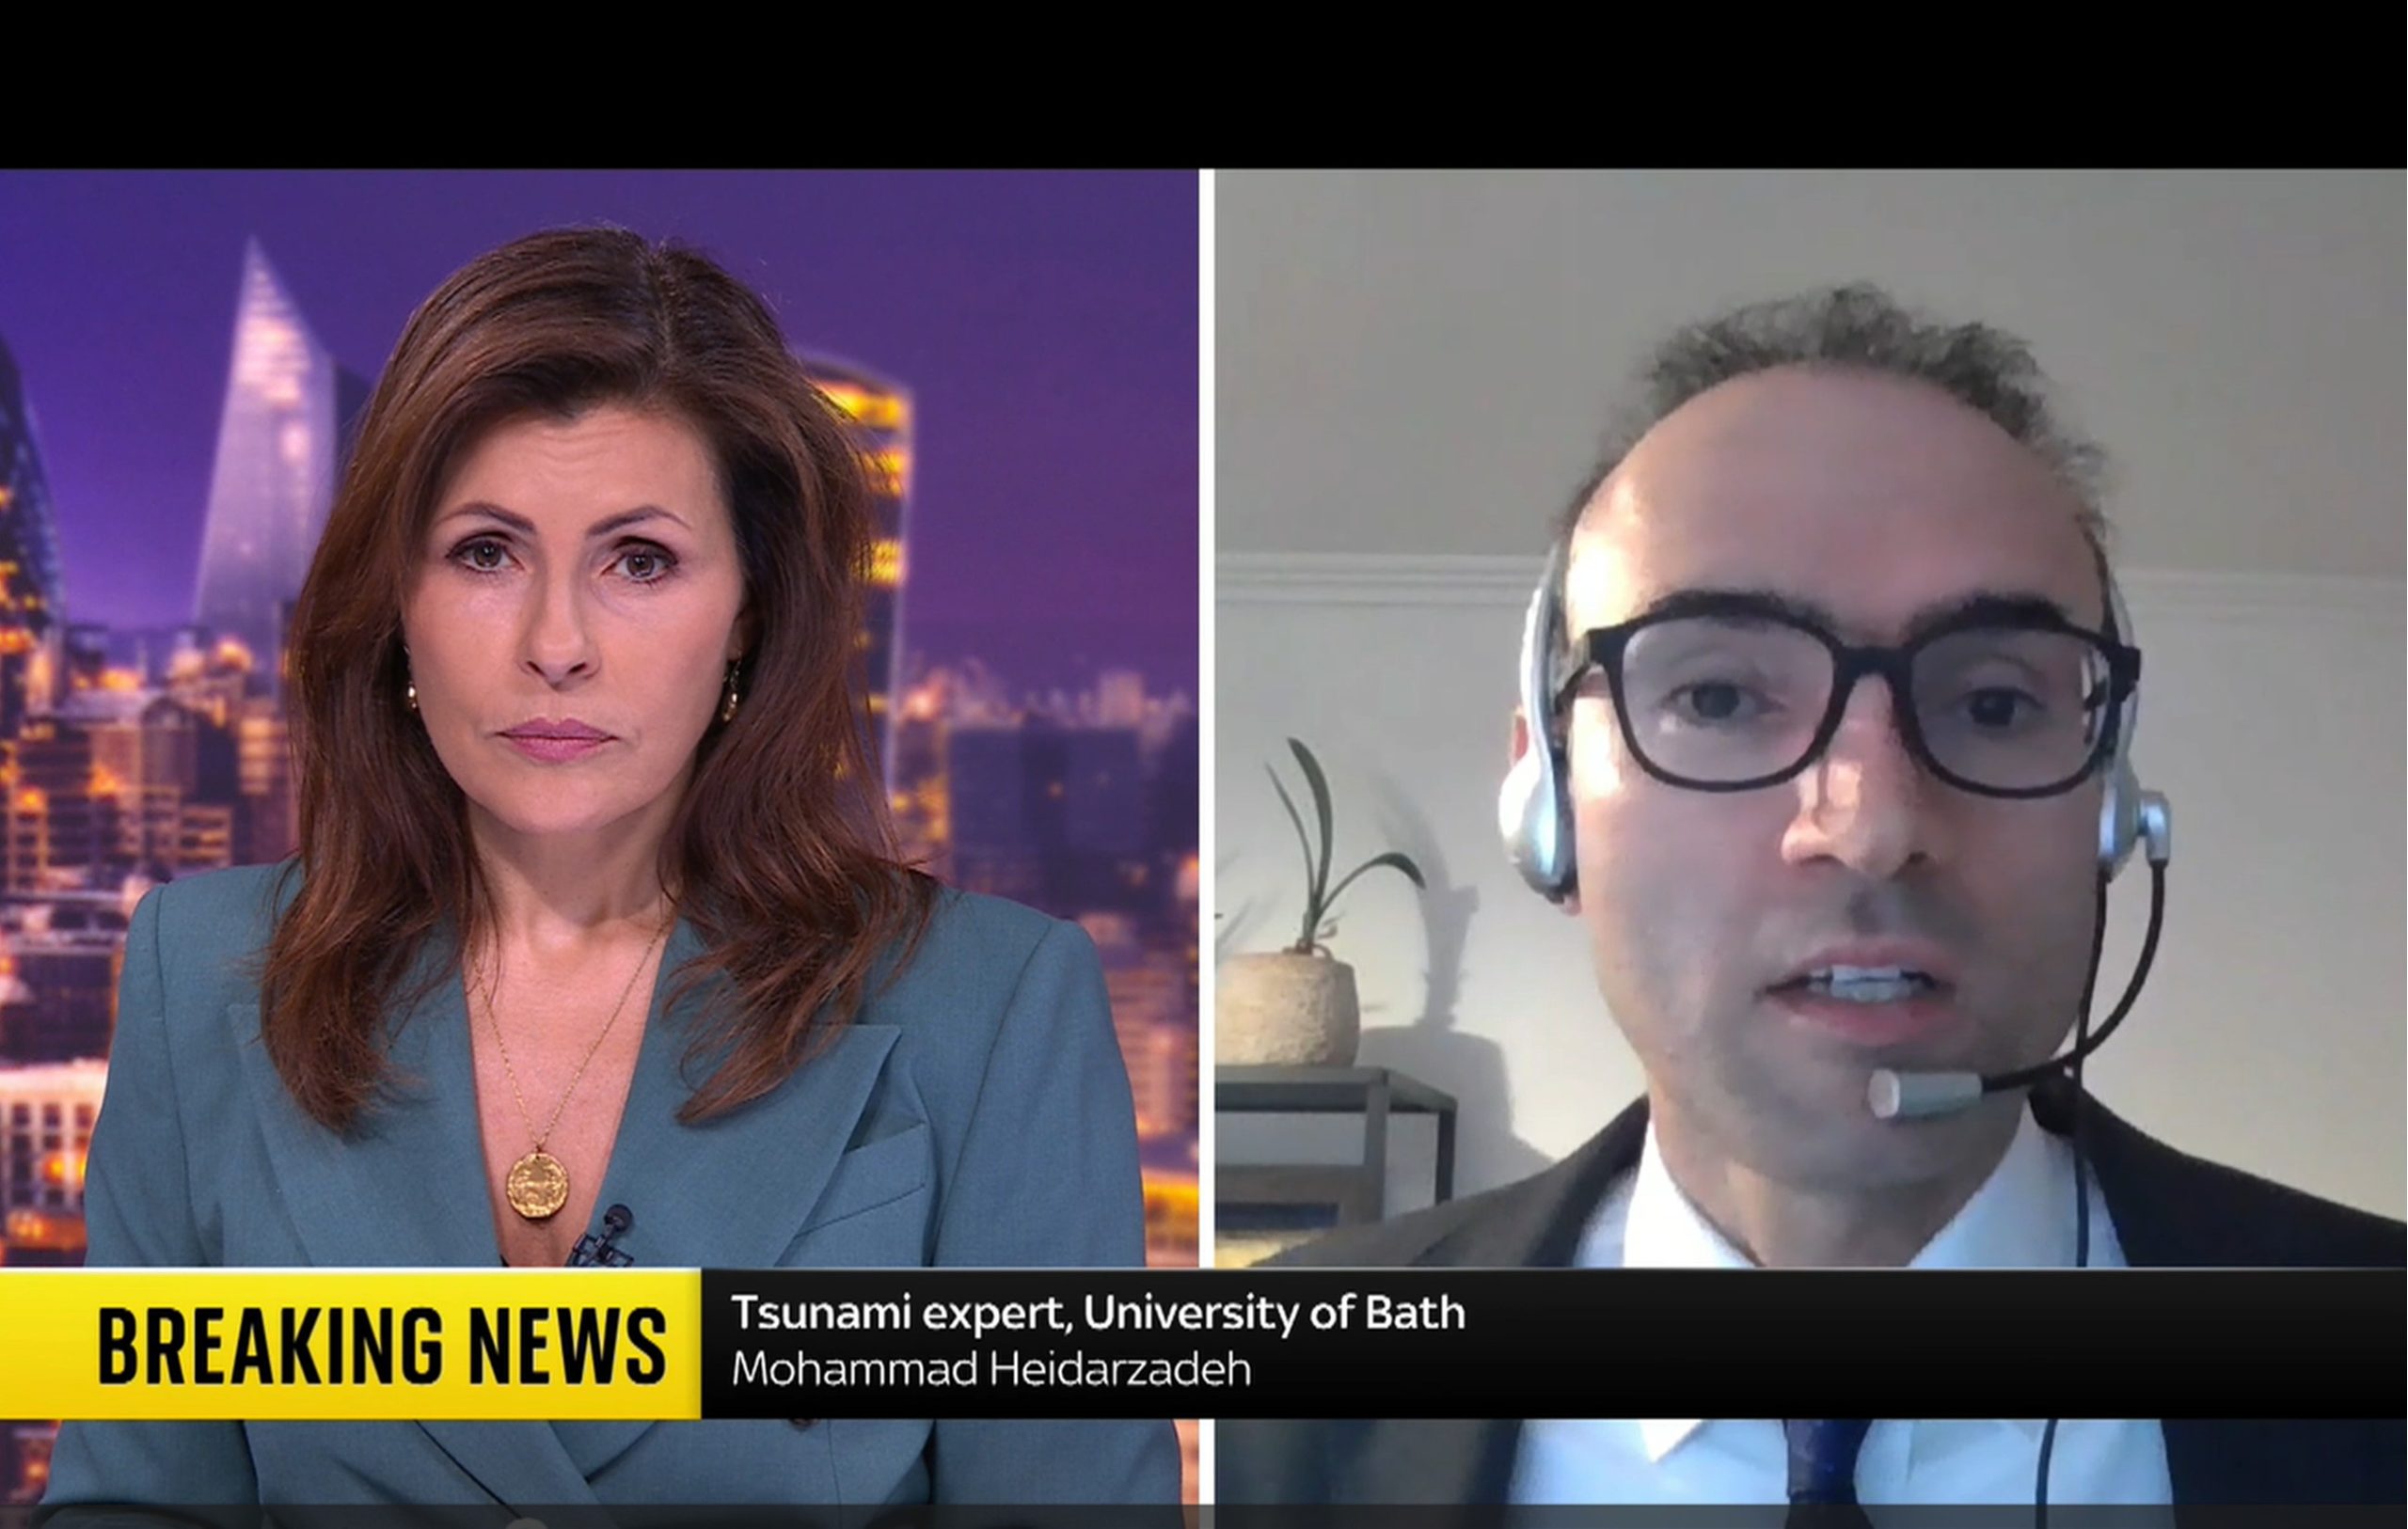
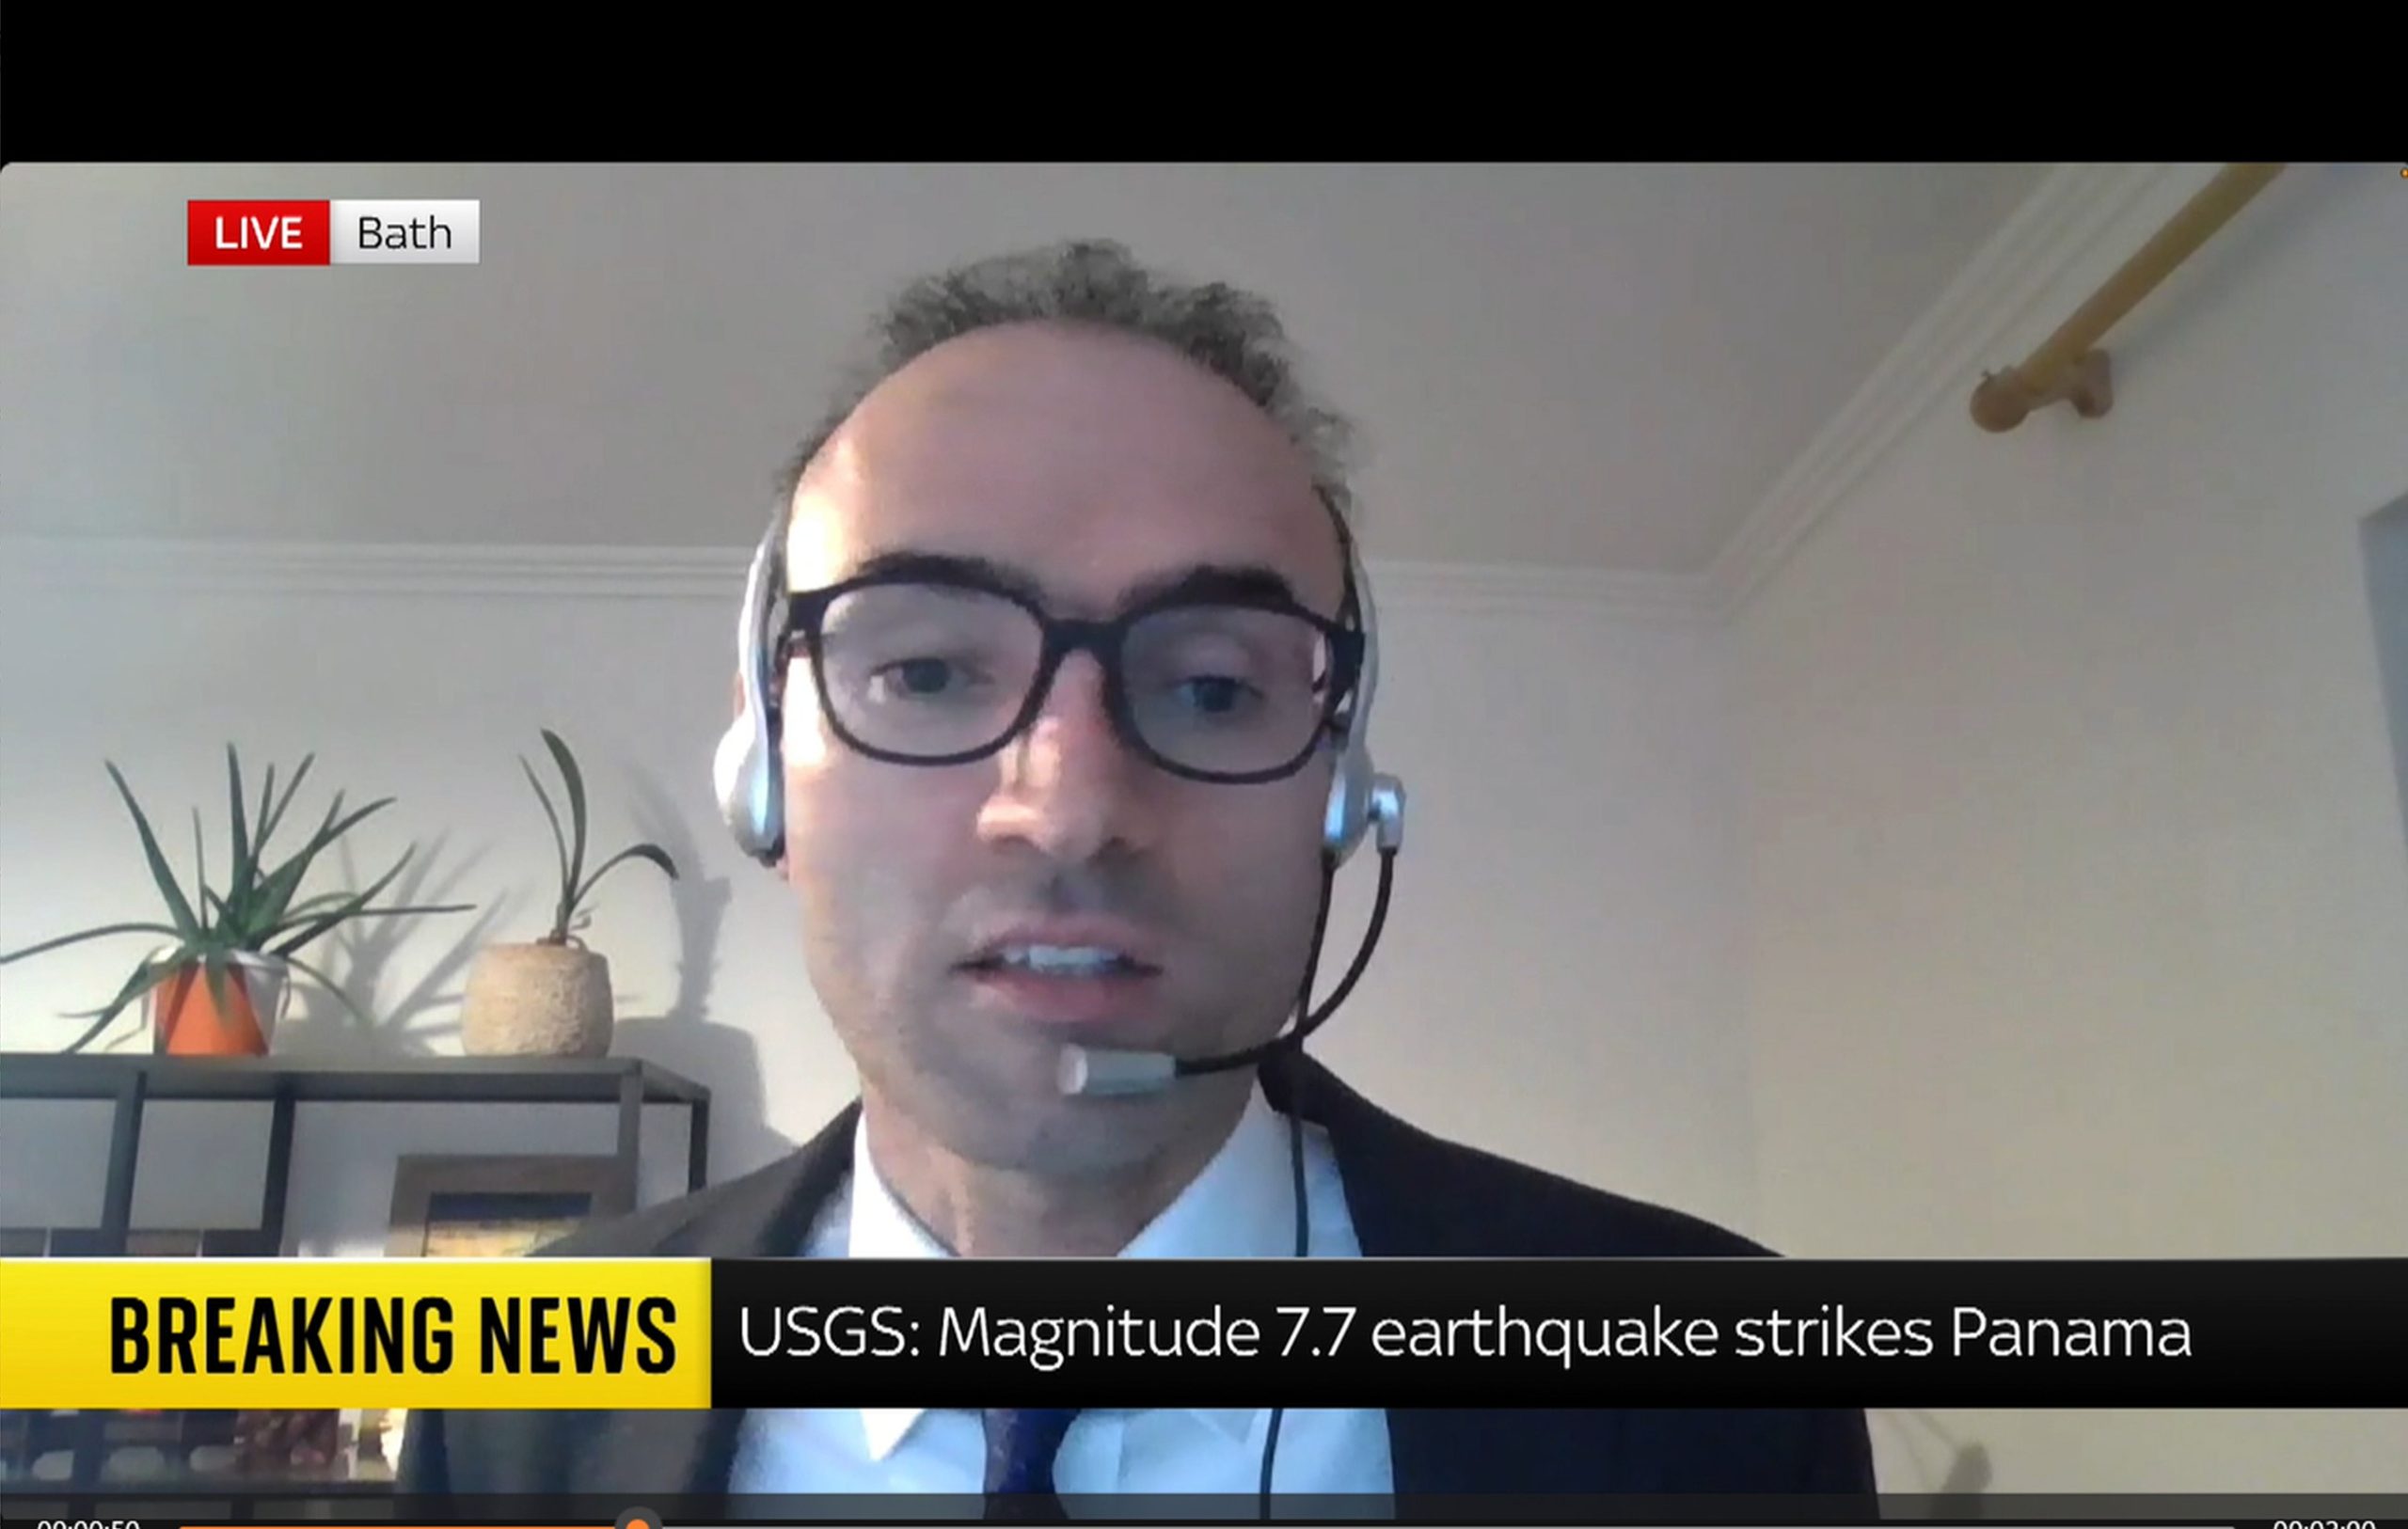
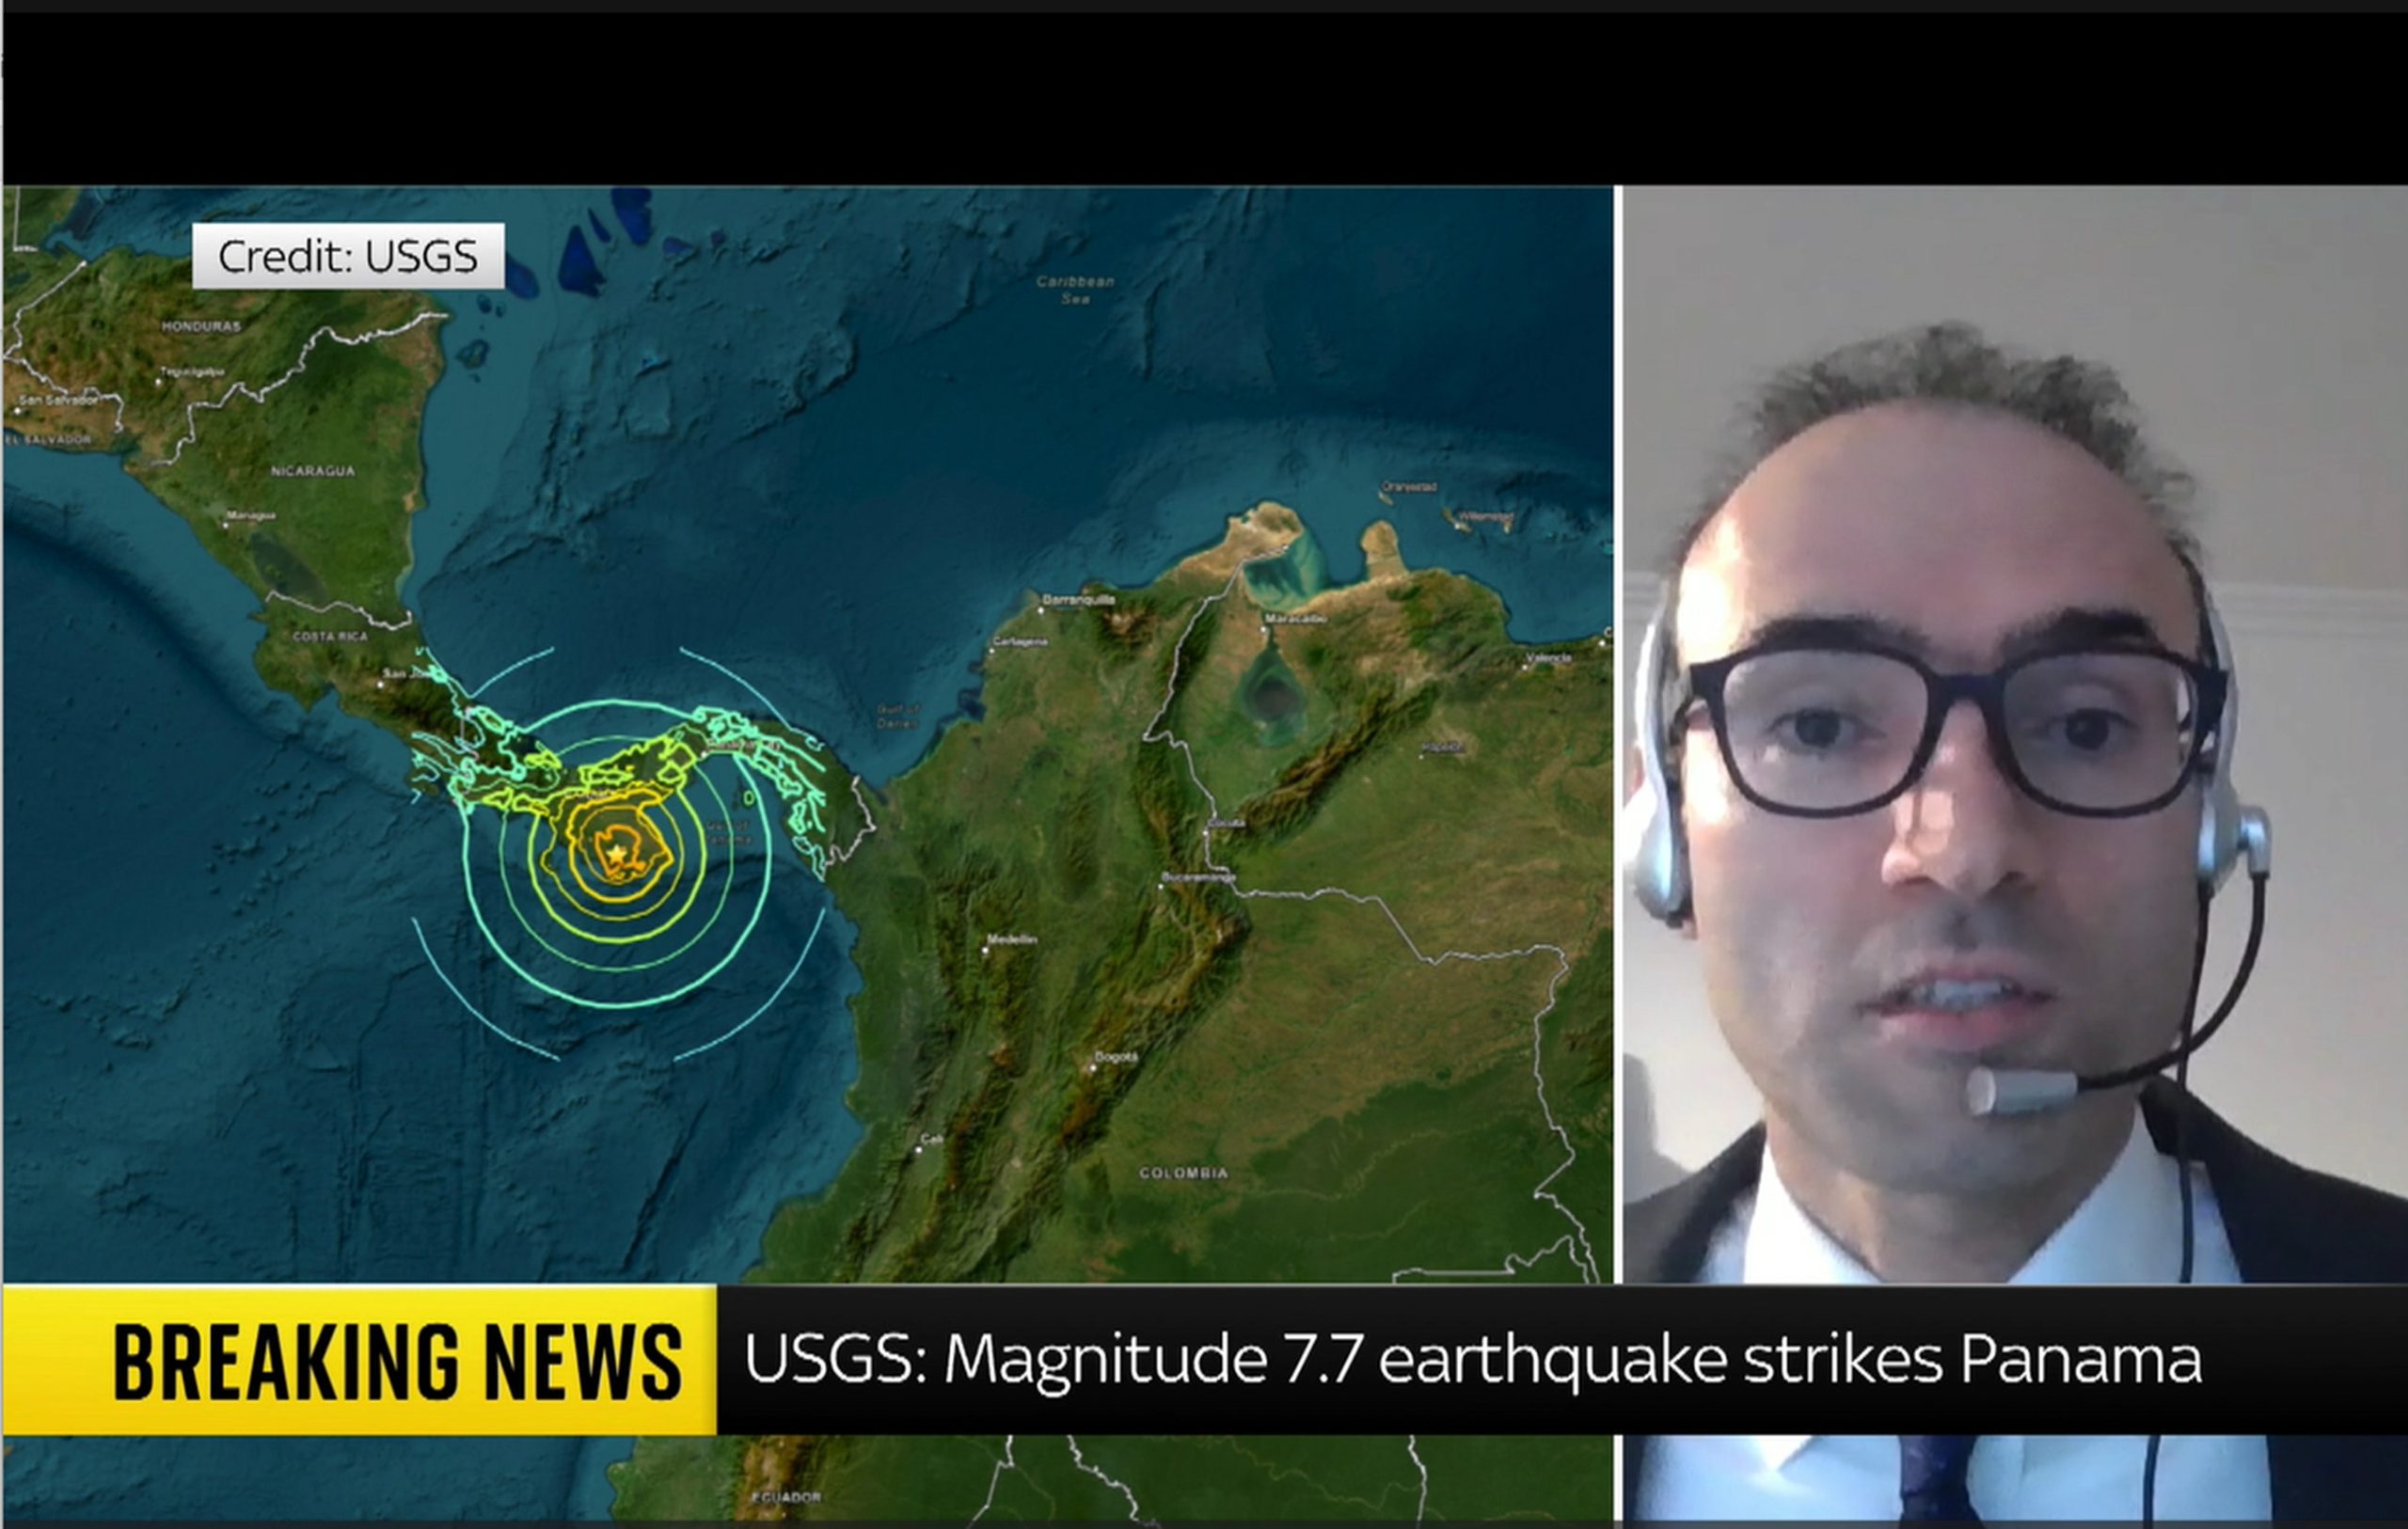
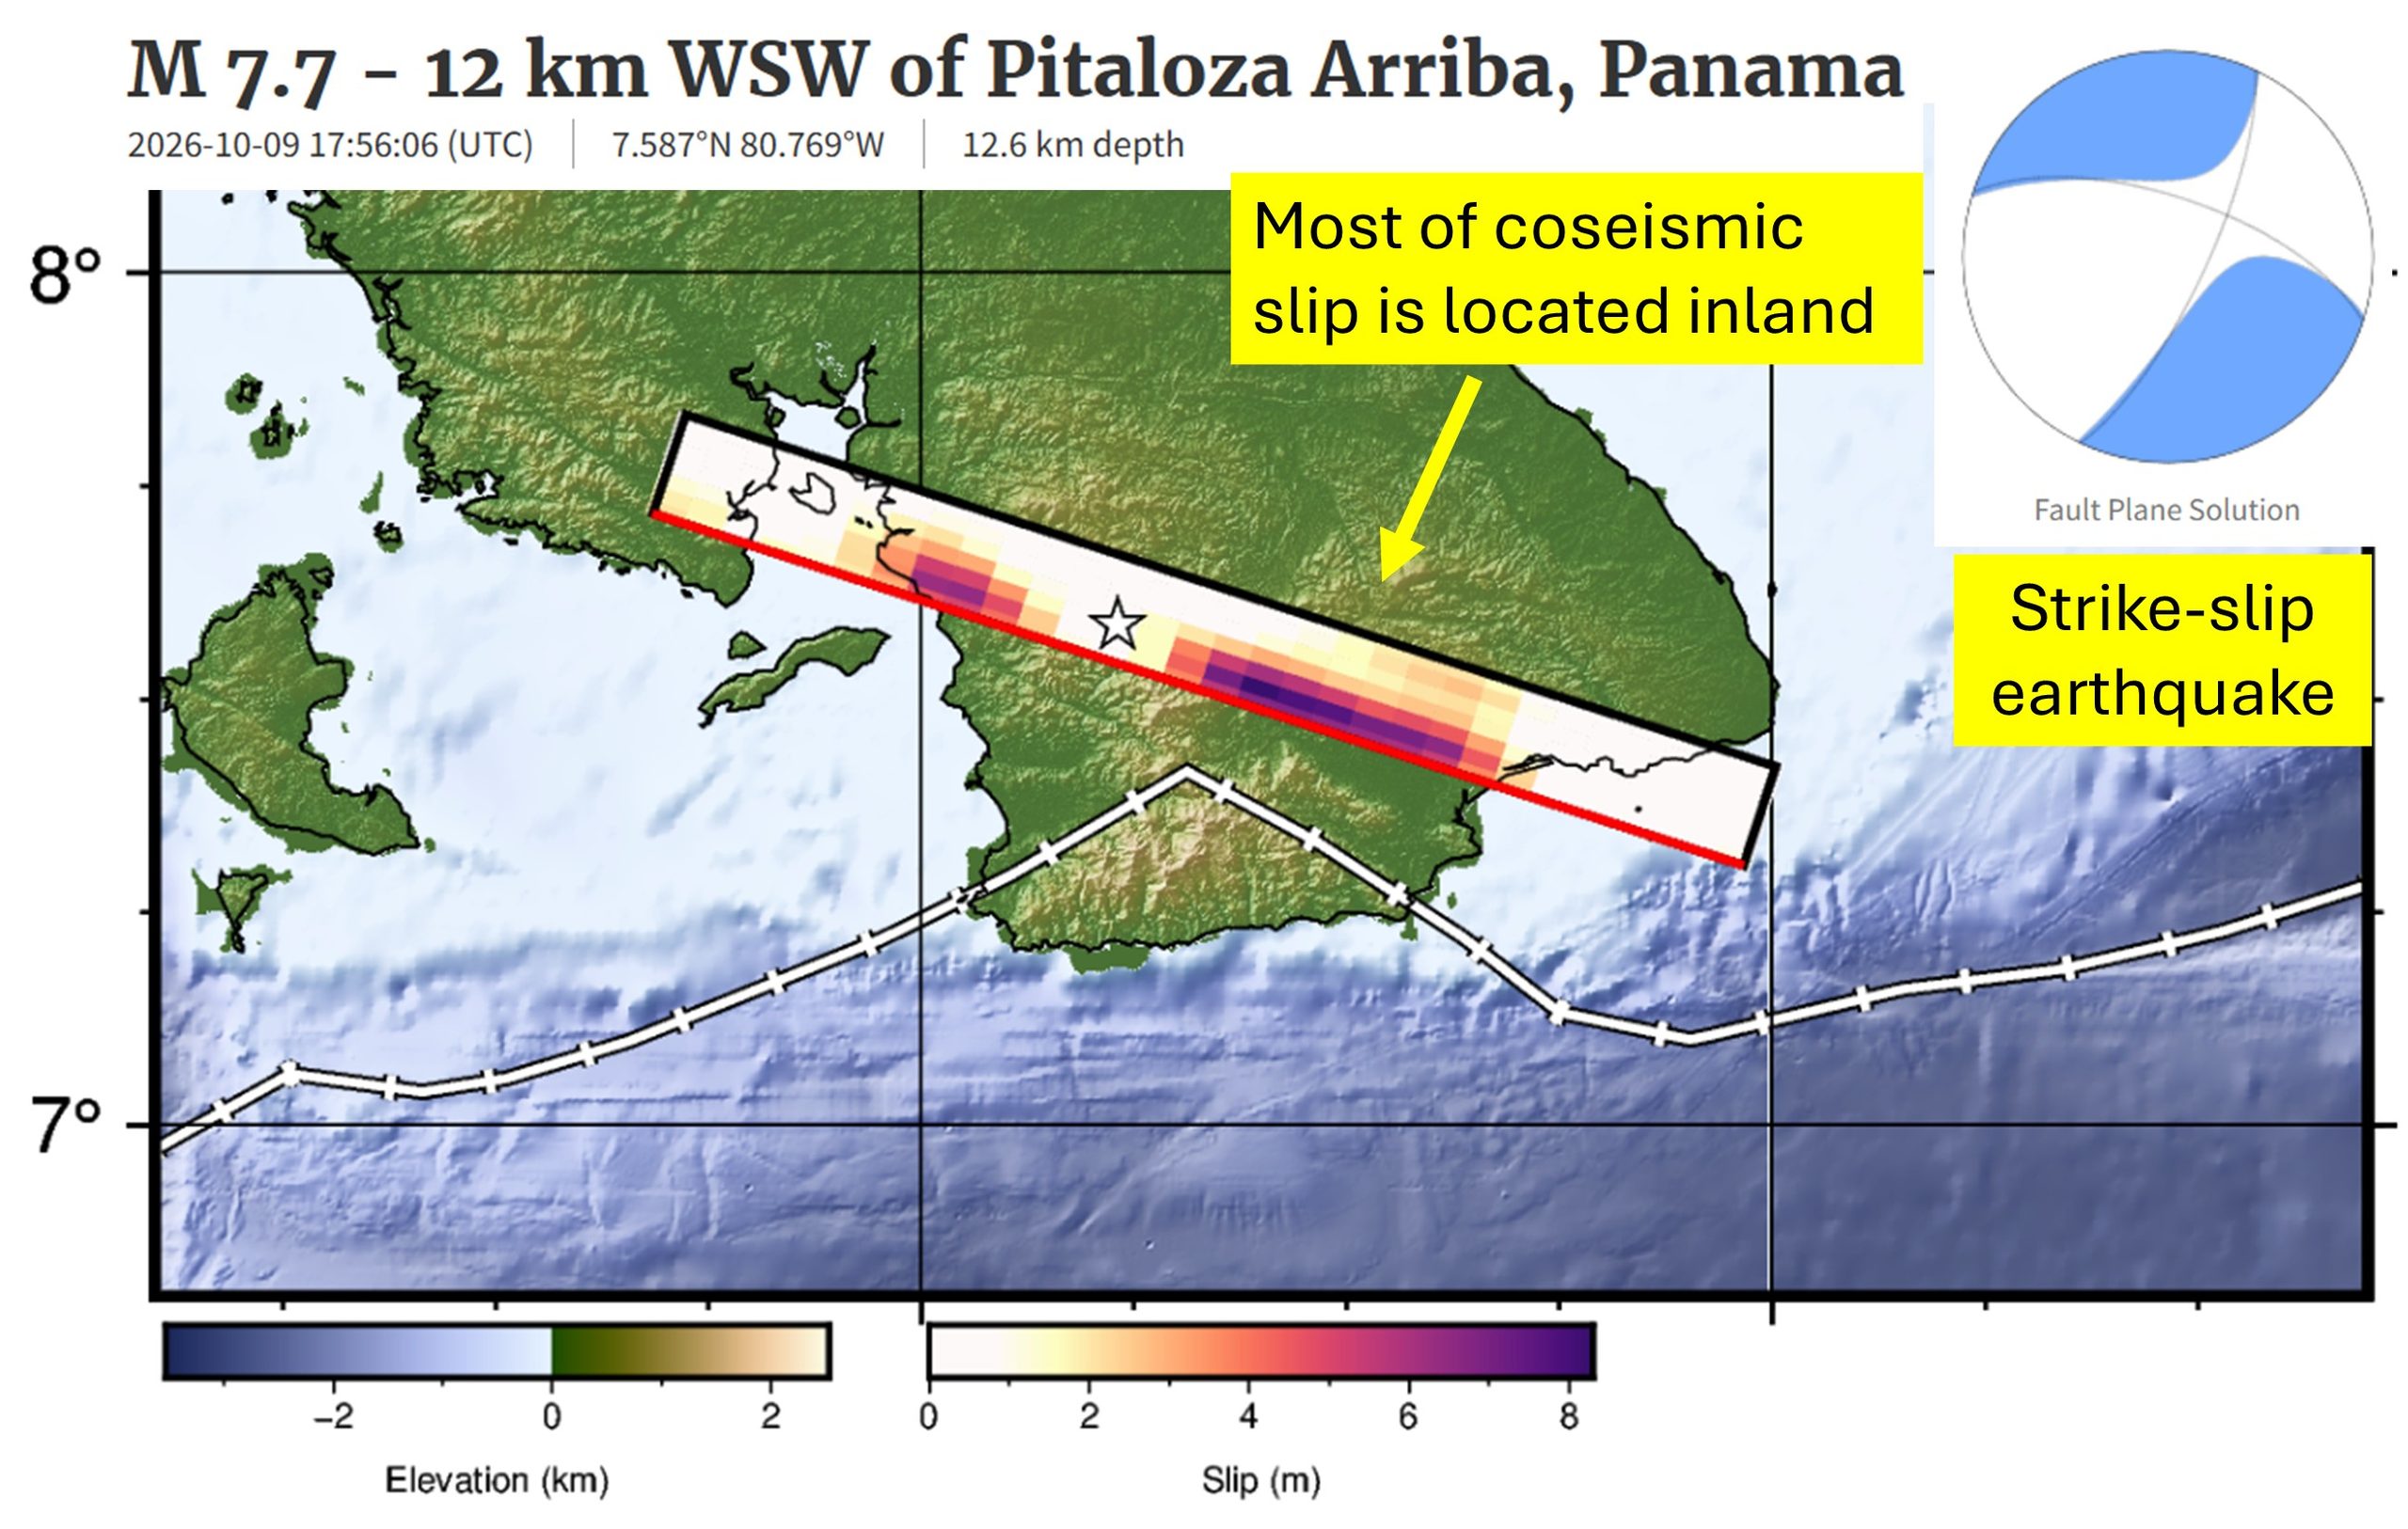
Dr Heidarzadeh’s TV interview with SkyNews on the massive M7.7 Panama earthquake on 9 October 2026
Our ocean is an incredibly vast and mysterious place. And there is no place where that is more evident than the deepest ocean area in the world: the legendary Mariana Trench. Located east of the Philippines, the Mariana Trench lies in the Mariana Archipelago in the western portion of the North Pacific. The greater area of the Mariana Trench Marine National Monument is made up of more than 95,000 square miles of ocean. Beneath these waters lie incredibly complex aggregations of submerged islands and volcanoes … and of course, an astoundingly massive trench.
Dive in with us to have your biggest questions answered about the famed Mariana Trench.
How deep is the Mariana Trench?
The deepest part of the Mariana Trench, known as Challenger Deep, is almost 36,000 feet below the ocean’s surface. For context, Mount Everest is about 29,000 feet above sea level, so the Mariana Trench is about 7,000 feet deeper than Mount Everest is tall. For one more comparison, the RMS Titanic lies at a depth of about 12,500 feet below sea level. The Challenger Deep is in waters nearly three times deeper than this ship’s final resting place.
Due to its enormous size, the Mariana Trench has at times been affectionately nicknamed the Grand Canyon of the ocean. This is certainly a picturesque image, but don’t let the mammoth size of this U.S. national terrestrial park fool you into thinking the Mariana Trench matches its size. The trench’s footprint is estimated to be 120 times larger than the Grand Canyon’s, and to reach the bottom of Challenger Deep, you’d need to descend through almost six Grand Canyons stacked on top of each other before you’d reach the seafloor.
Oh … and did we mention it’s five times wider than it is deep? It’s about 43 miles wide!
What is Challenger Deep, and how long would it take to reach it?
Challenger Deep is the deepest point of the Mariana Trench. Fewer than 30 people have ever journeyed to this area. The trek below the surface is long, dark and time-consuming, and it’s not an expedition considered lightly by scientists and explorers.
The first people to descend into the depths of this area in 1960 were oceanographers Jacques Piccard and Don Walsh, and it took them close to five hours to reach Challenger Deep. Since then, more advanced submersibles have been created, but it still takes two to four hours for modern vessels to reach such depths. For example, explorer and filmmaker James Cameron reached the seafloor in a little more than 2.5 hours in the first documented solo submarine dive to the area, and it took oceanographer Dr. Dawn Wright about four hours in 2022. It is crucial that these submersibles descend slowly and steadily beneath the surface, as the immense water pressure compounds with every mile a submersible descends. Speaking of pressure …
Get Ocean Updates in Your Inbox
Sign up with your email and never miss an update.
What is the water pressure at the bottom of the Mariana Trench?
If you thought the depth of the Mariana Trench was its only jaw-dropping feature, think again. Water pressure is one of the most important factors affecting deep-sea life. In the ocean, pressure increases by one atmosphere for every 33 feet (10 meters) of depth. One atmosphere (a unit of measurement for pressure equivalent to average air pressure at sea level) is equal to about 14.7 pounds per square inch (PSI), which is the approximate standard atmospheric pressure at sea level. If you were to convert atmospheric pressure into weight, one atmosphere is about the weight of a bowling ball. Stay with me, friends.
If a vessel were to dive 2,000 feet below the surface, the pressure would equal that of 60 bowling balls stacked atop every square inch of that submersible. But 60 bowling balls is simply nothing compared to the pressure in the Mariana Trench. The atmospheric pressure at the depths of Challenger Deep is equal to about 16,000 PSI. That pressure is about the same as the weight of an entire full-grown elephant on every square inch of a submersible!
Need a more extreme comparison? If a human were to be placed at the bottom of the Mariana Trench, the pressure would be equal to that of 50 jumbo jets piled on top of a person!
Do any animals live in the Mariana Trench?
The depths of the Mariana Trench come with immense pressure and extreme darkness, but somehow, life finds a way to survive. Organisms that live at an extreme depth, like that of Challenger Deep, have to be highly adapted to low temperatures (typically just above freezing), high pressure and virtually no light at all.
Species found in the depths of the Mariana Trench might look vastly different from animals from other ocean depths because their anatomy has been refined to thrive in harsh conditions. At such great depths, these animals typically depend on chemosynthesis (using nutrient-rich waters being pumped out of hydrothermal vents) or descending detritus (dead matter that has fallen from higher parts of the ocean) for food, such as whale falls. Just a handful of these animals include species of octopuses and squids, sea cucumbers, amphipods, sea jellies, shrimp, sea worms and some wild-looking fish!
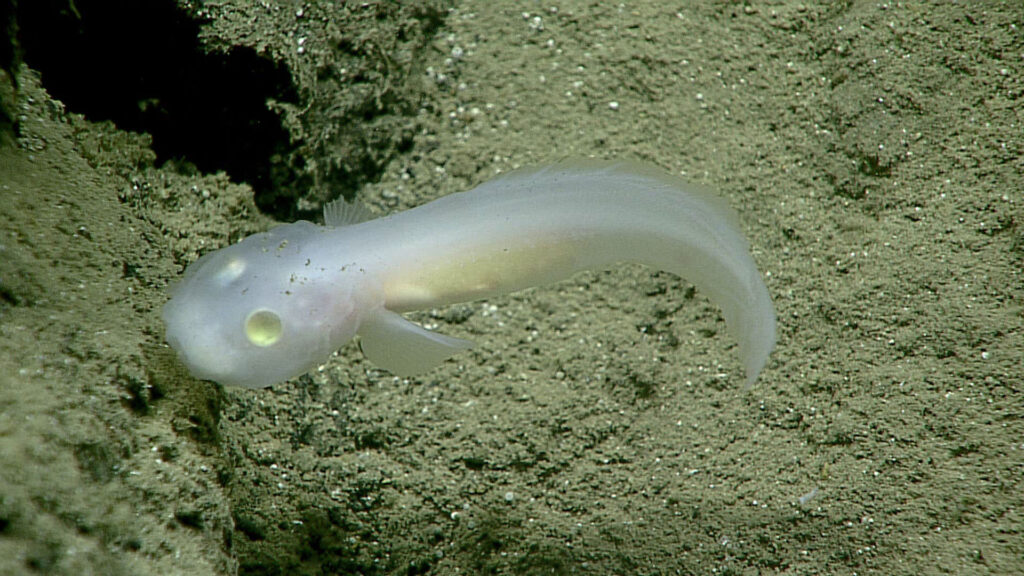
In 2025, more than 7,000 new species were discovered in the Mariana Trench, including the hadal snailfish (Pseudoliparis swirei). This is the deepest-dwelling fish currently known to science. Now, the fish has been dubbed “the Mariana snailfish.”
How was the Mariana Trench formed?
The process by which the Mariana Trench was created is a geologically fascinating one known as subduction. On the Earth’s surface, there are thin plates that cover the planet’s mantle, which is made of molten rock. If two of these plates collide, one pushes down into the Earth’s mantle while the other is pushed over the bottom plate. When this happens, a trench is formed from the drag of the bottom plate. This process can sometimes create incredibly strong earthquakes. The plates that forged the Mariana Trench’s creation are estimated to be up to approximately 180 million years old.
This trench was unknown to scientists until 1875. It was then that a team of explorers on the HMS Challenger measured the depth of the sea by simply lowering a weighted rope into the water. They were baffled when they measured that first portion of the seafloor to be five miles below the surface. And so was born the origin of some of the most daring deep-sea explorations known to mankind to date.
Is the Mariana Trench protected?
The Mariana Trench is in waters off Guam and the Mariana Islands. The region is protected from some human activities under its status as a marine monument. The creation of the Mariana Trench Marine National Monument signified that international, national and local leaders all recognize the importance of protecting this area.
However, just because the region is protected does not mean it’s not vulnerable to modern threats to ocean health. Plastic bags have been spotted in the Mariana Trench during several expeditions, highlighting the far-reaching impact of the marine debris problem. No corner of our ocean is safe from the ever-present threat of plastic pollution. The reality of a changing climate makes the future well-being of wondrous places like the Mariana Trench uncertain. What’s more: More than 70% of the global ocean has yet to be mapped. And what we don’t yet know about, we cannot wisely work to protect.
It’s up to us to work together to defend our ocean, from the sandy shores of our favorite beaches to the deepest, darkest parts of the sea. Together, we can work to protect our ocean as a whole, which ultimately helps protect treasured places like Challenger Deep.
Find out how you can join Ocean Conservancy’s wave of momentum to secure a healthy ocean and a thriving planet, forever and for everyone!
The post The Mysteries of the Mariana Trench appeared first on Ocean Conservancy.
Intro
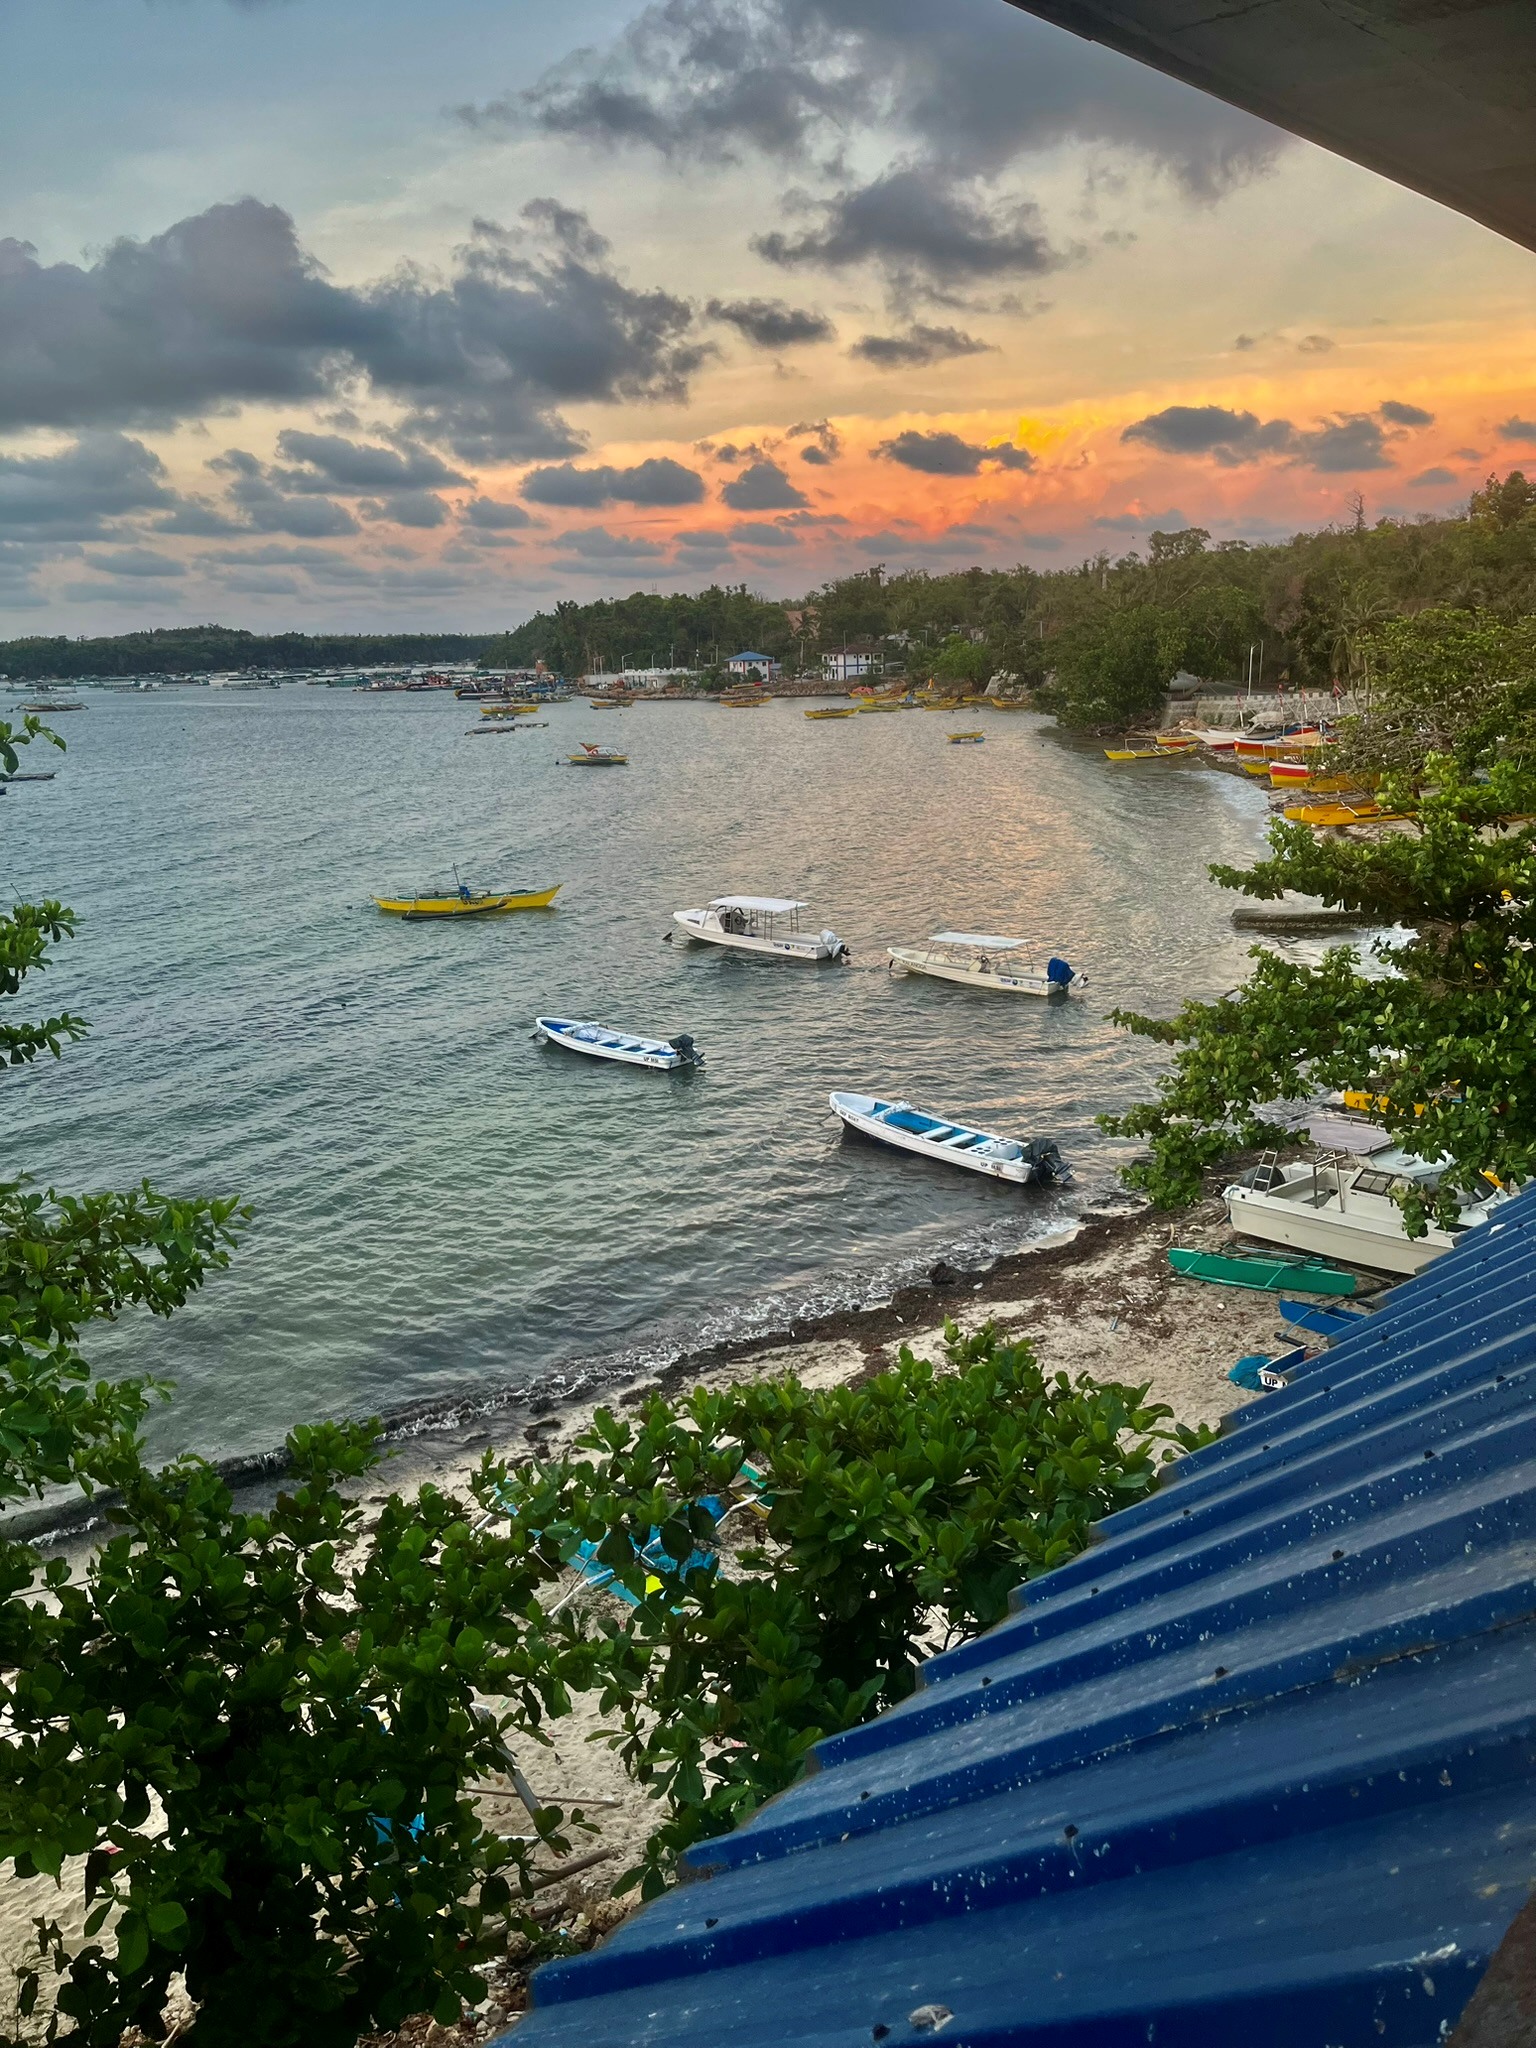
At the western tip of Luzon, which is the biggest island of the Philippines, lies the small coastal town of Bolinao. Tourists seldom find their way here as it takes around seven hours to get here by bus from Manila. Still, you can spot foreigners walking around every now and then, but they really stand out among the Filipinos. A reason for their presence is often that they study or work at the Bolinao Marine Laboratory (BML), which belongs to the University of the Philippines (UP). It is one of the seven research institutions participating in the GAME project 2026. Every year, GAME brings together Master’s students from all over the world to experience different cultures and conduct globally replicated experiments in marine ecology.
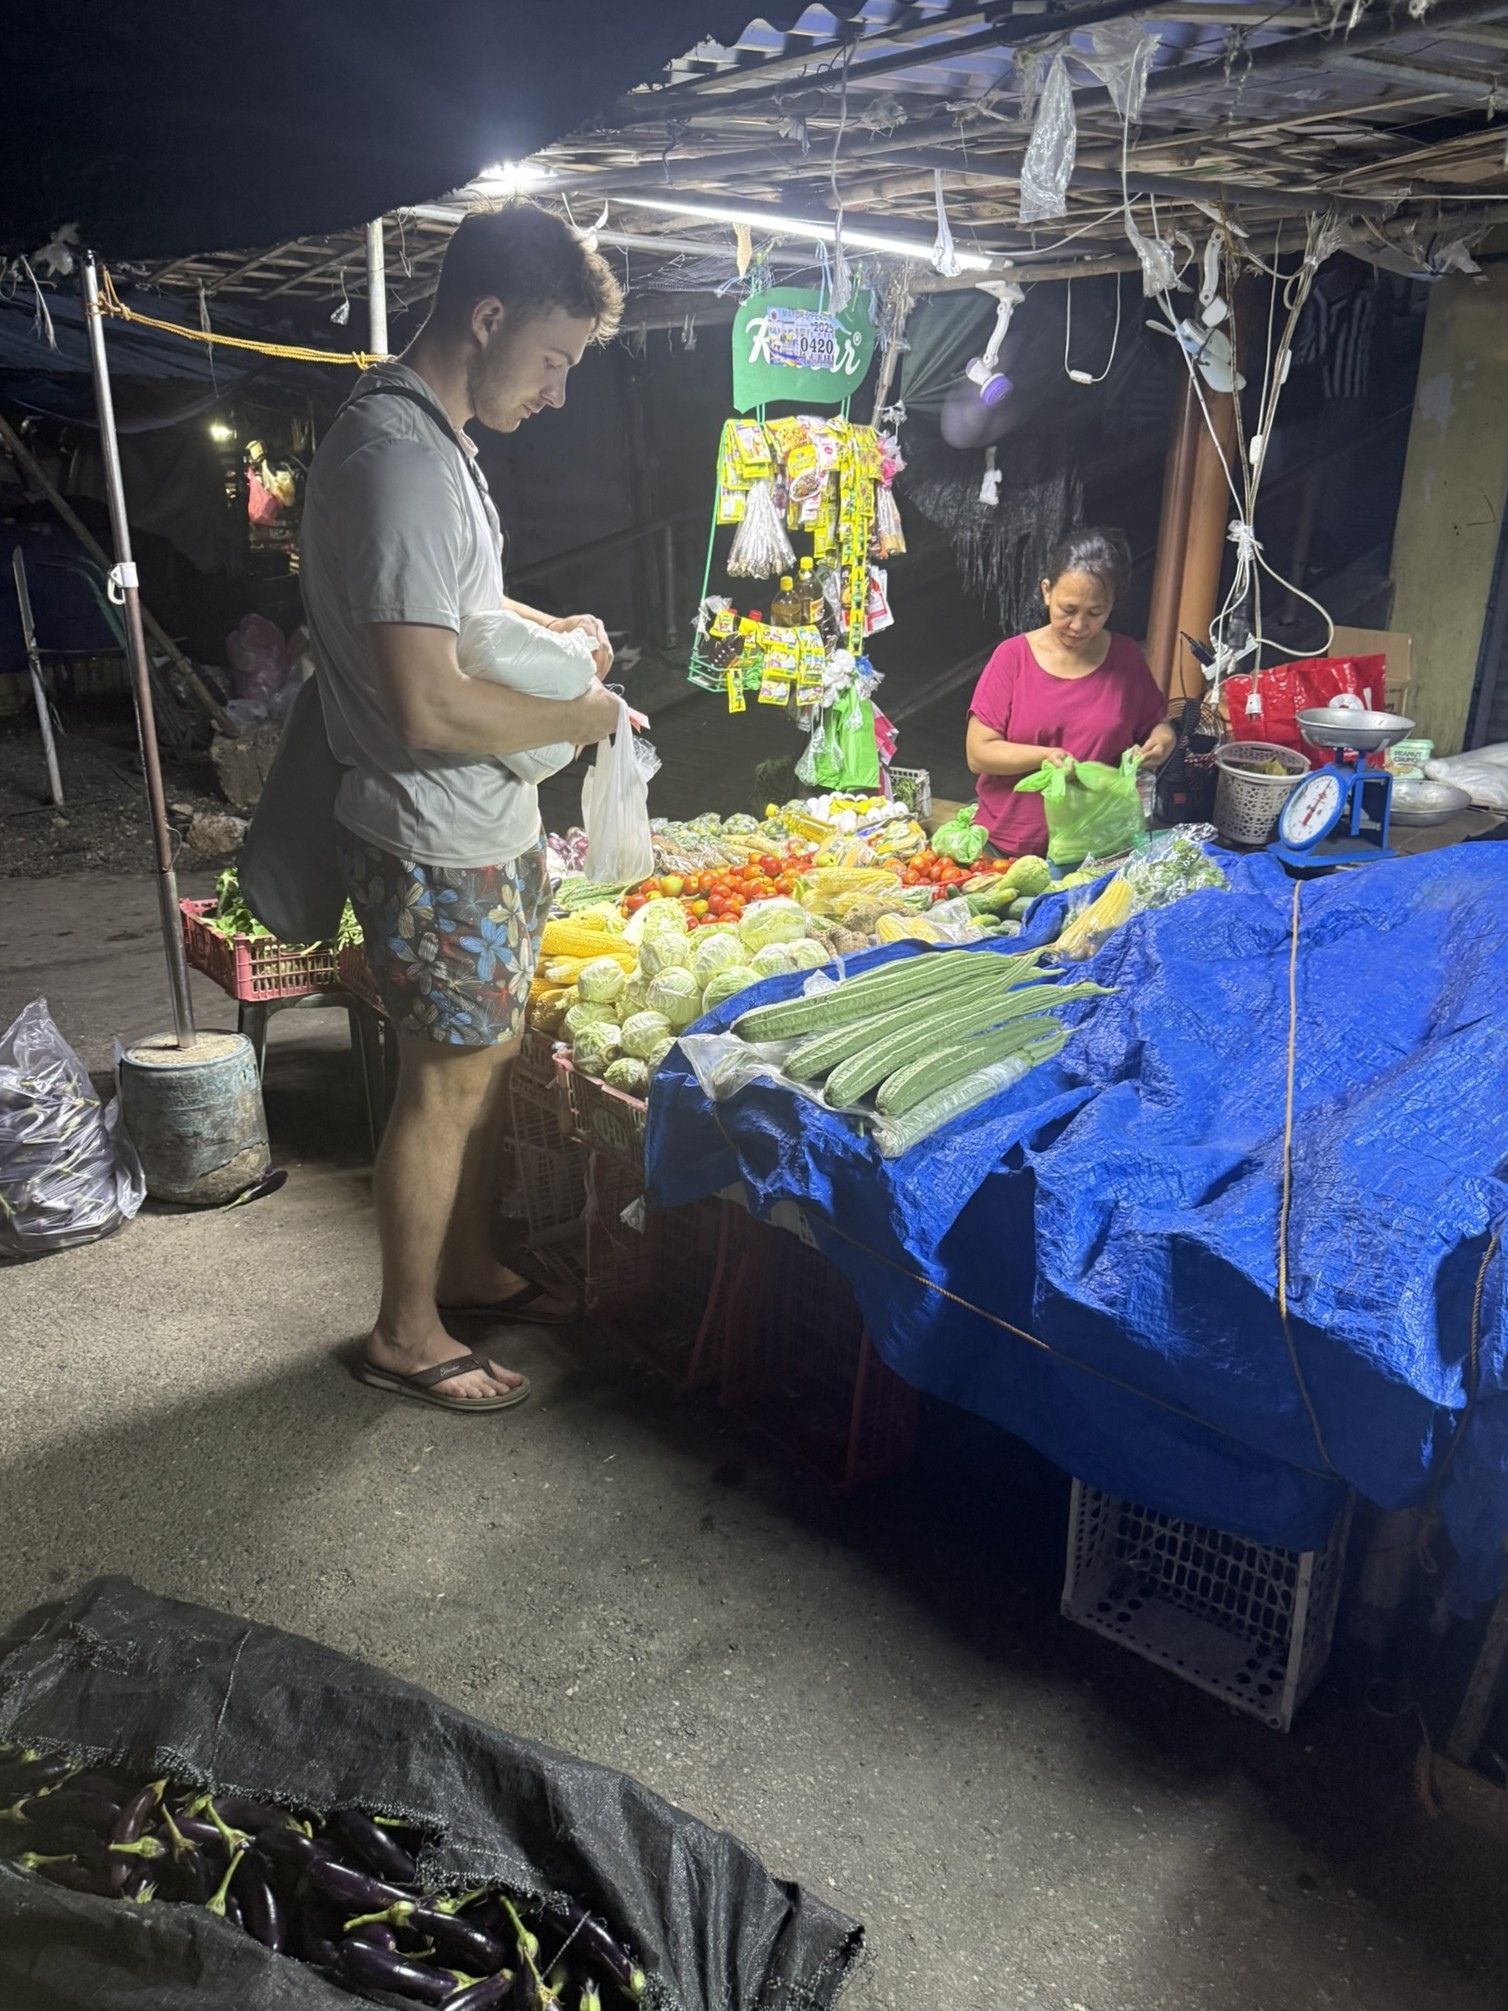
This year’s Team Philippines consists of Jona, a Filipino master student of Marine Biology at the University of the Philippines, and Konstantin, a German student who is enrolled in the Master programme „Ecology and Evolution“ at Freiburg University. As part of GAME 2026, we are currently staying at BML for 6 months to run experiments about the influence of underwater soundscapes on the colonization of marine hardbottoms.
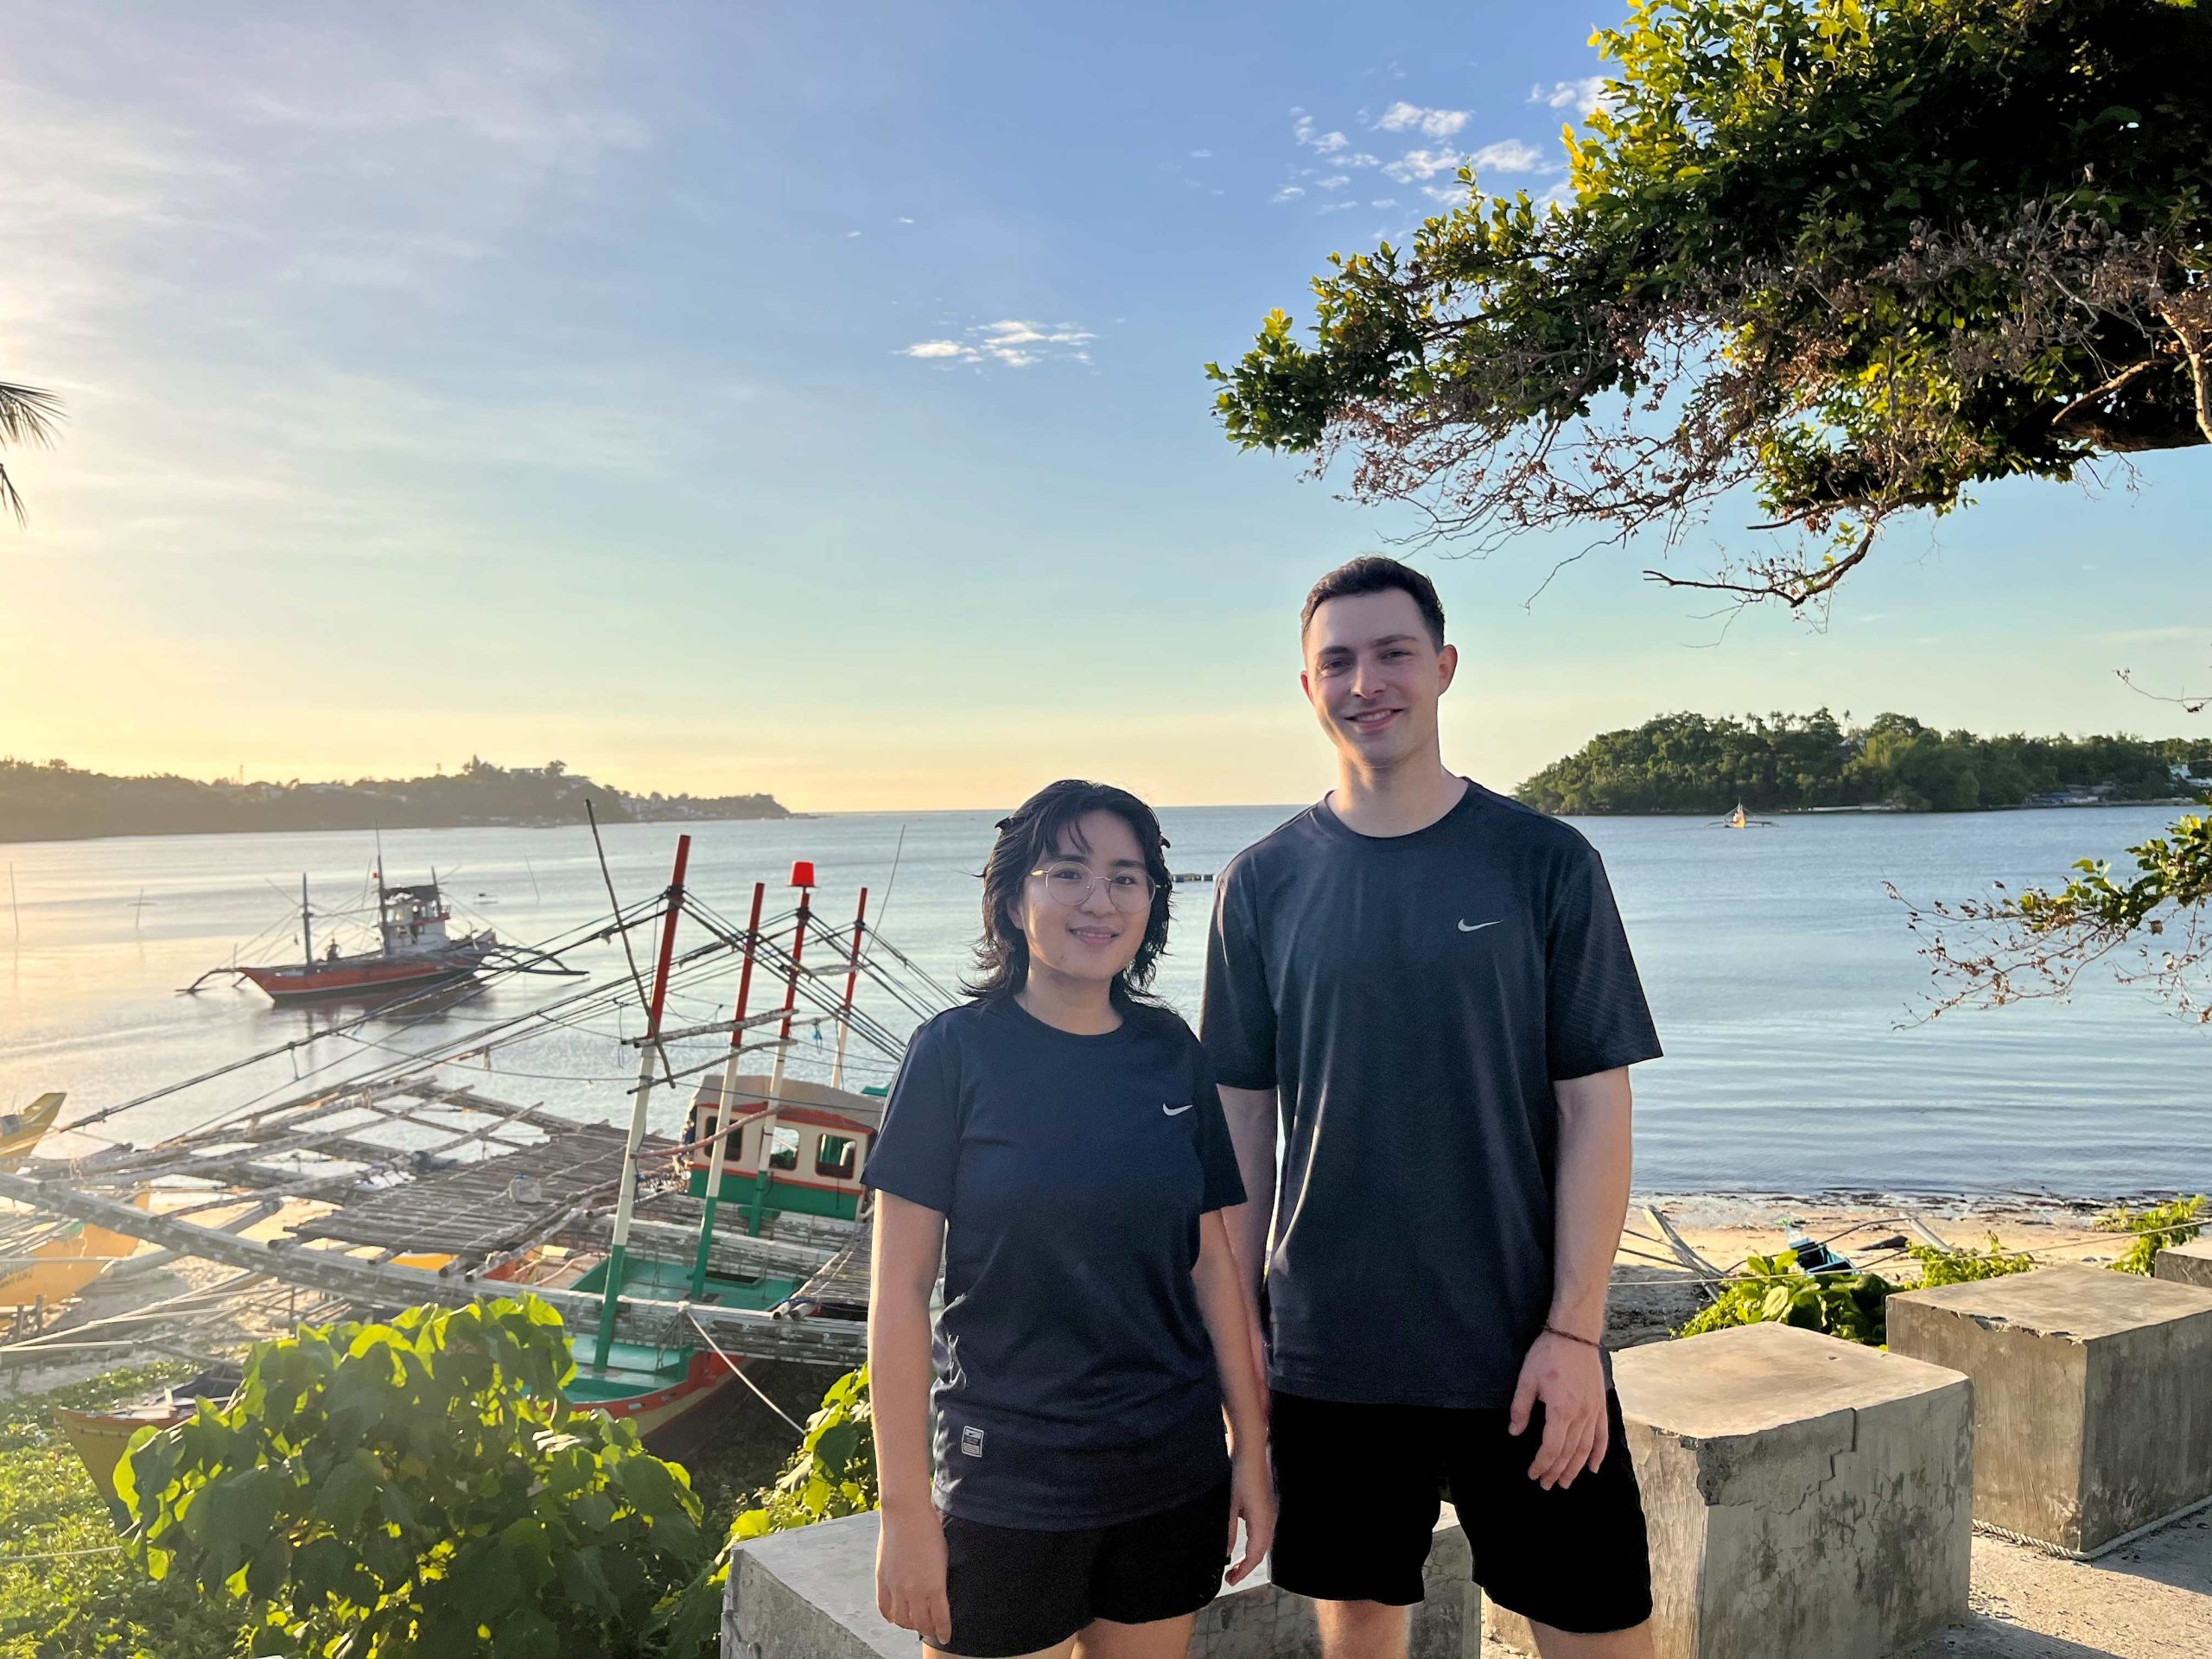
Where are we?
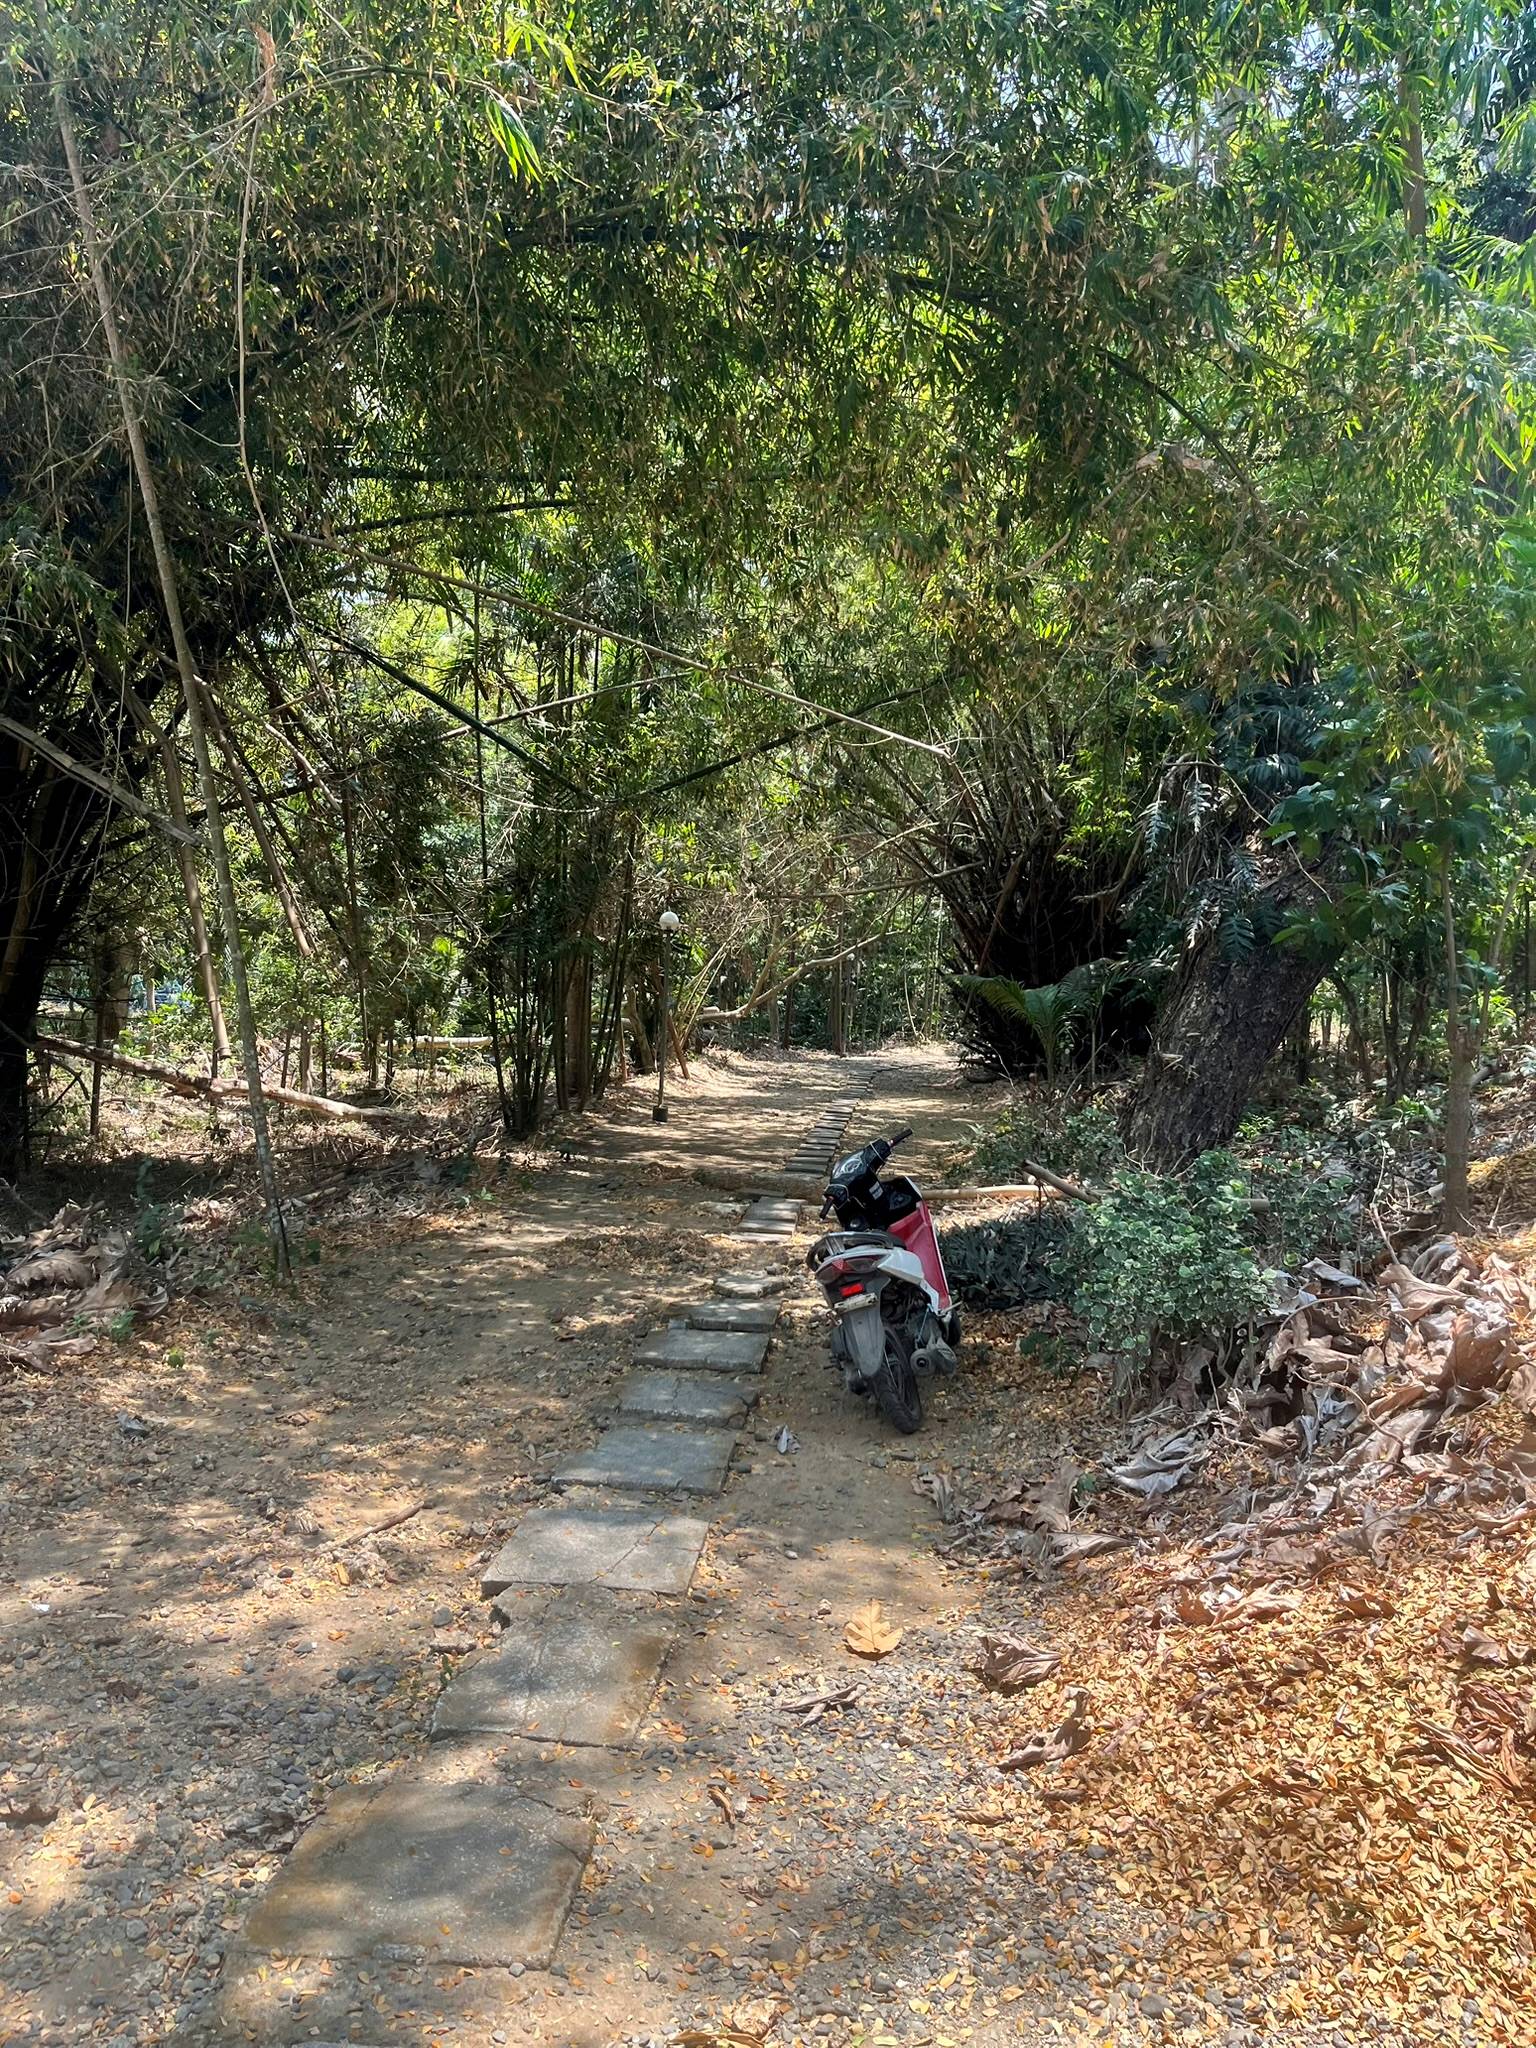
At the BML, we live in a dormitory together with many other students and scientists mostly from the Philippines and a few international interns. At almost any time of the day there is someone in the kitchen to hang out with, eat together, or simply have a chat. It is easy to make friends in this little community. The way to work is just a short walk along a forest path, where we can pick mangos for a snack and spot butterflies, birds, or even wild macaques climbing through the trees. After crossing a street, we reach the institute. But instead of enjoying the cool temperatures of the laboratories, we spend most of our working days outside, doing fieldwork in or near the water.
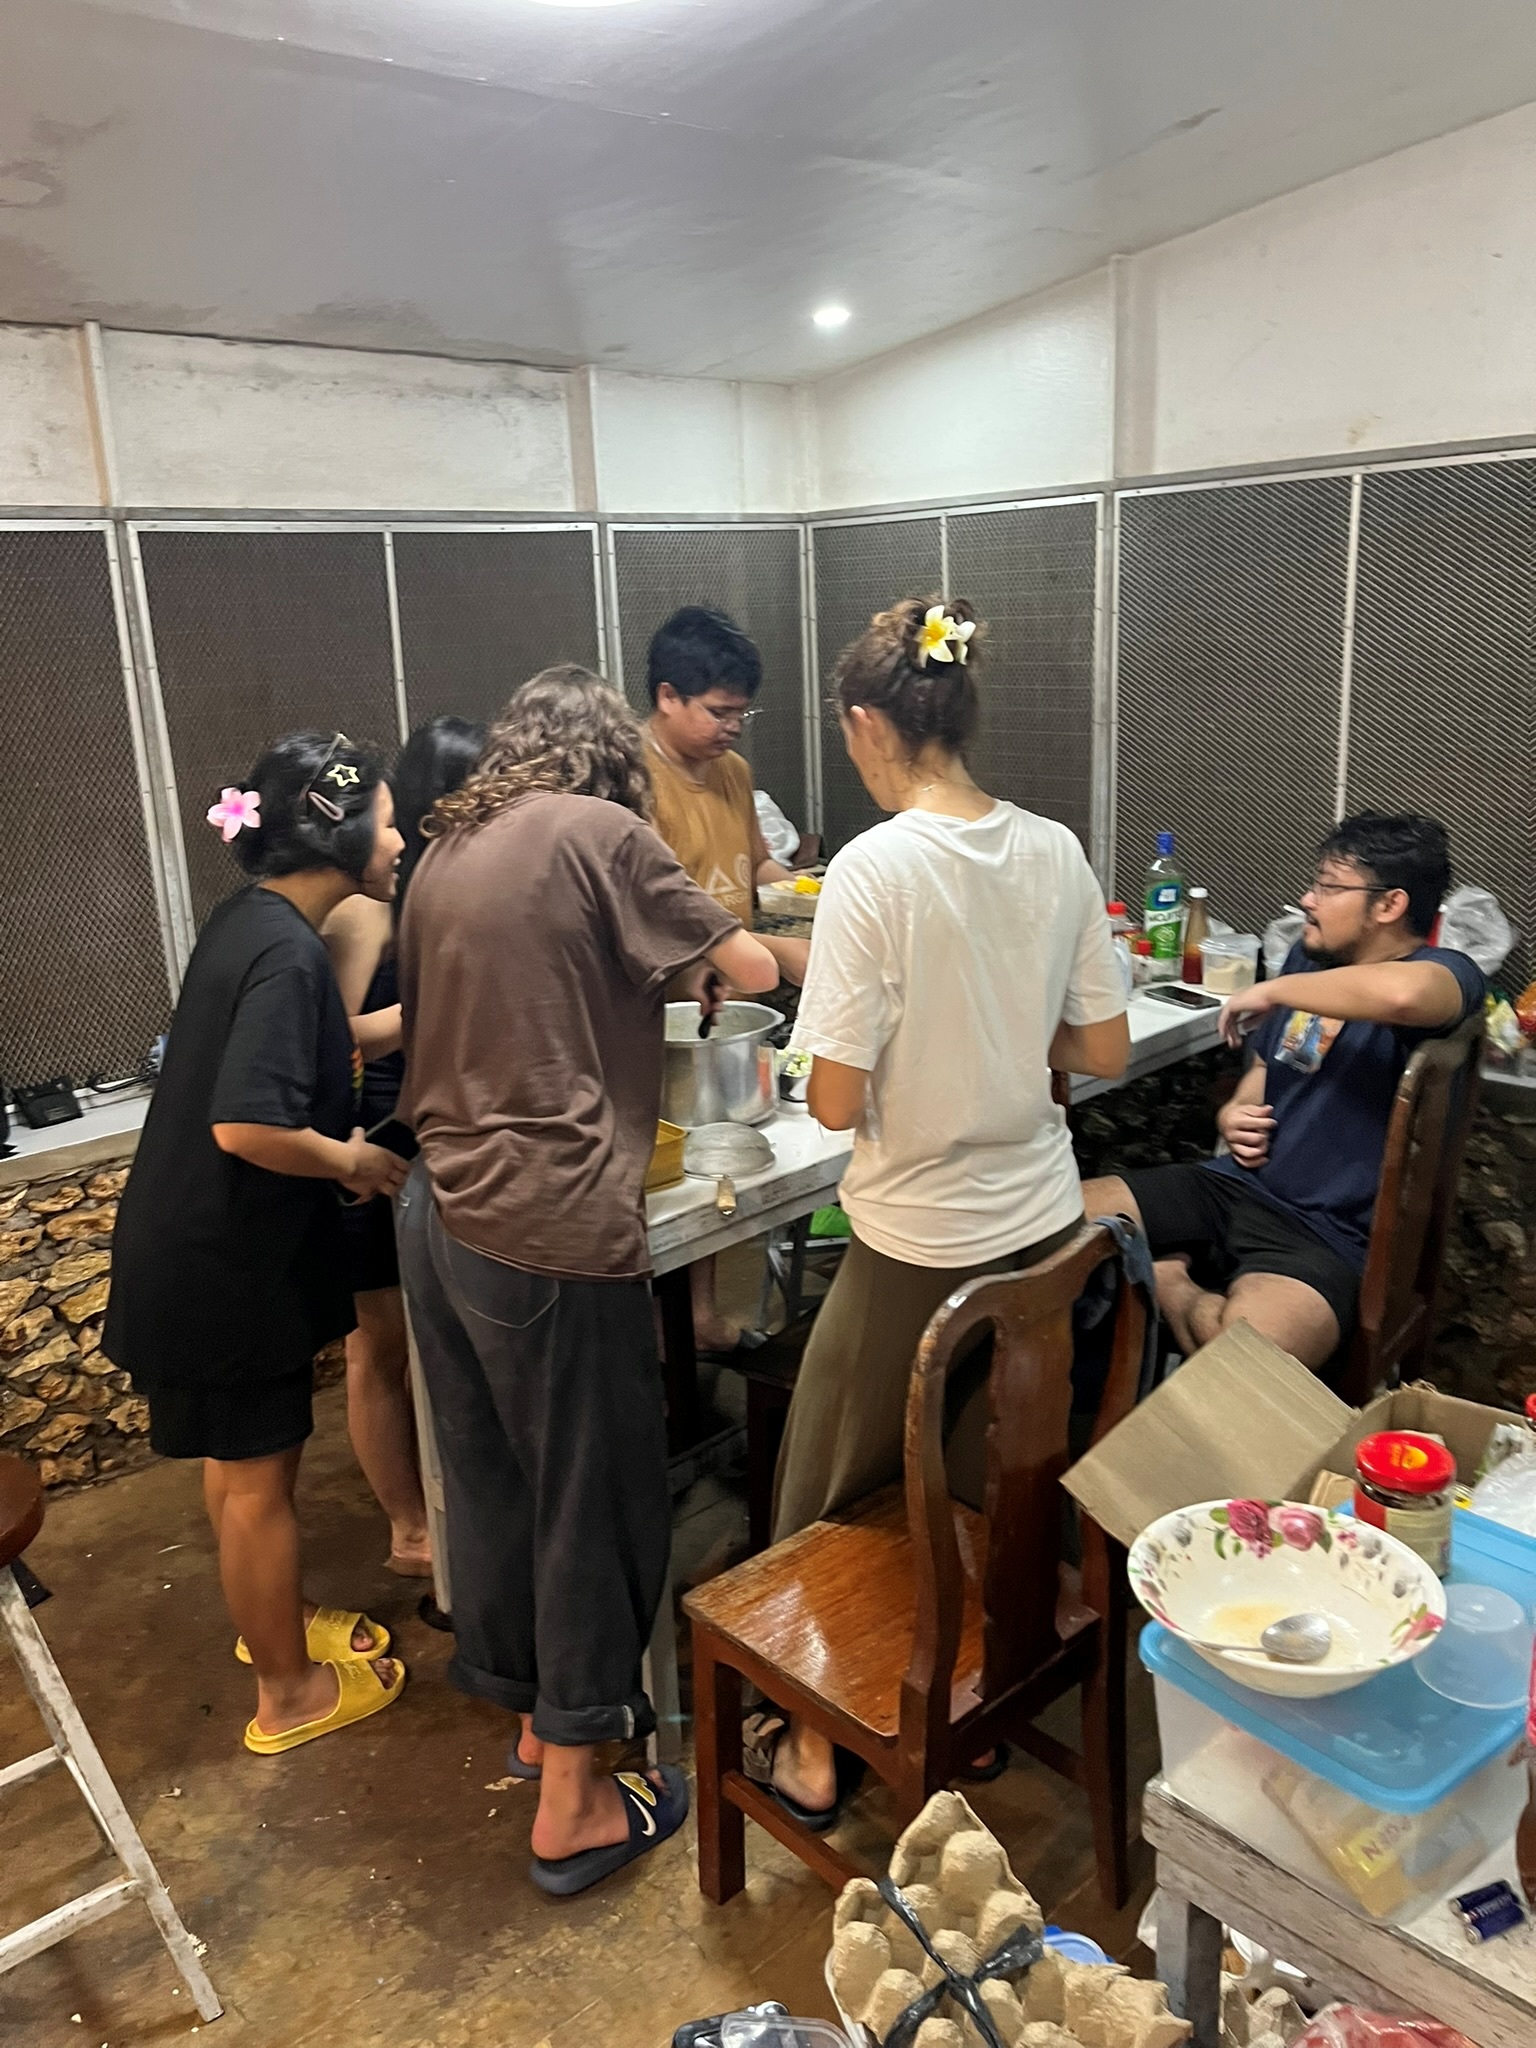
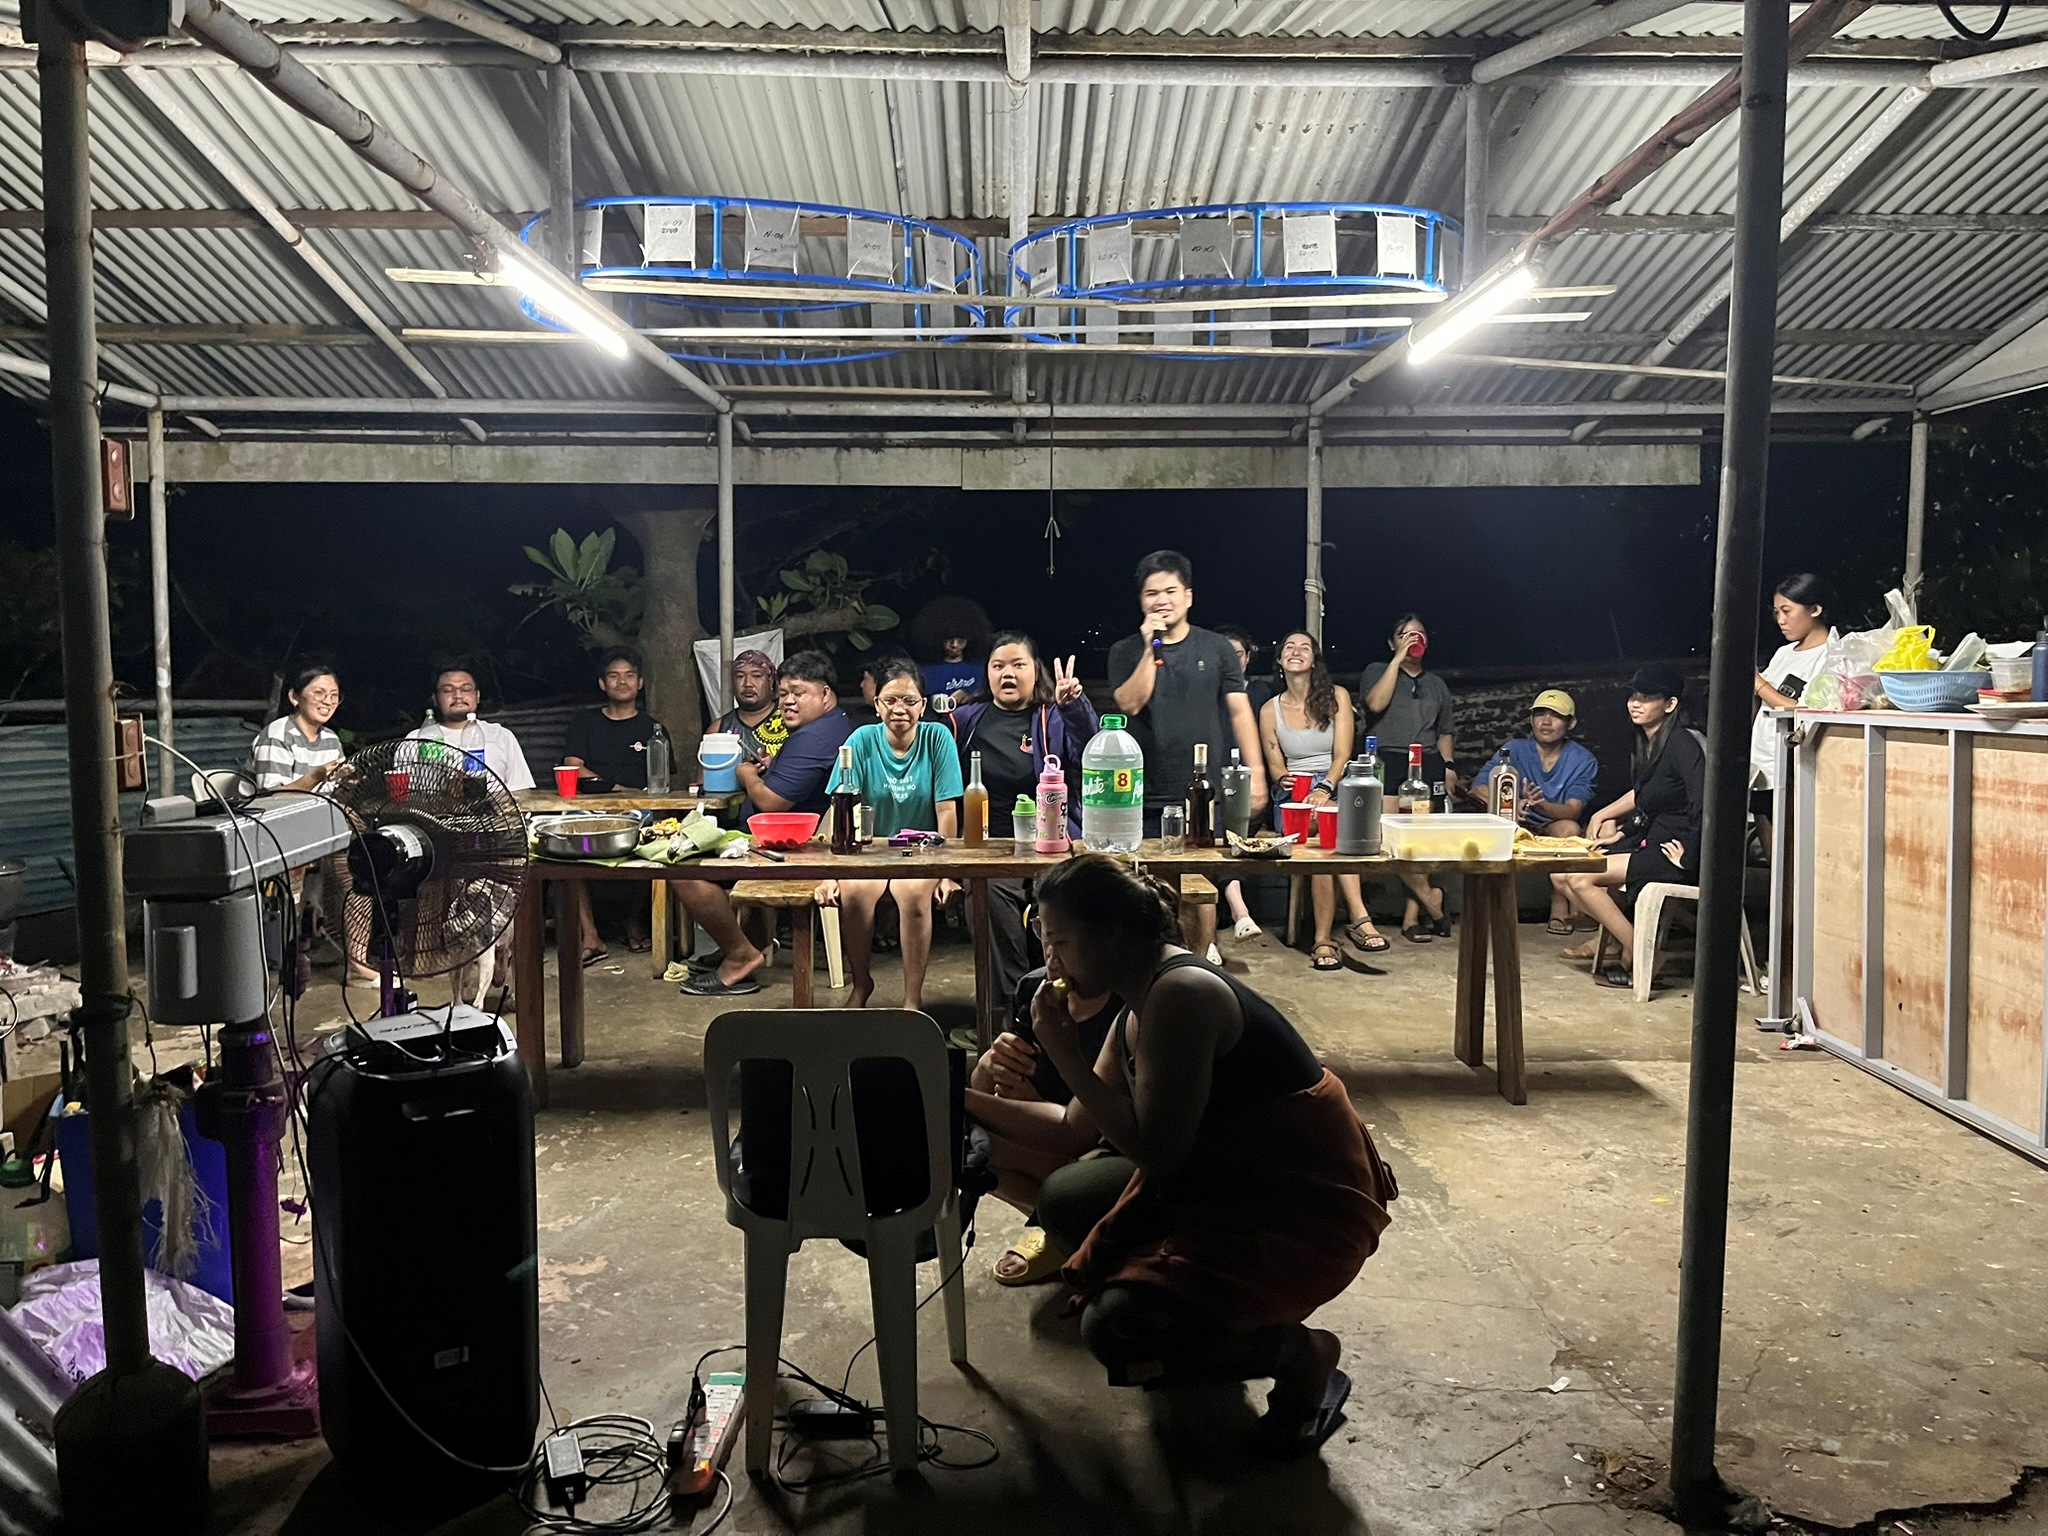
On Fridays, Konstantin experiences real Filipino culture during an almost weekly party at the institute with karaoke and lots of food and drinks. And Jona even brought some German culture to the Philippines by baking German bread for everyone.
What do we do?
Even though Bolinao is a remote place, it can get quite loud. Tricycles and jeepneys pass by, children play basketball in the streets, and karaoke can be heard almost everywhere and at any time. But just a few meters offshore, the soundscape changes. Beneath the surface of the ocean, you enter a world filled with sounds that are not so familiar to humans. When you dive down, alongside the rhythm of your own breathing, you might hear the crackling snaps of shrimp, the grunts of fish, or the rumble of waves rolling overhead. Together, these sounds form a natural underwater symphony which, however, can easily be interrupted by the noise of passing boats.
Marine organisms use sounds to communicate and to gather information about their environment, and there is growing evidence that this also applies to the larvae of sessile invertebrates such as mussels, barnacles and tunicates. During their pelagic life they are presumably able to use sounds for finding their way to suitable habitats, in which the sessile adult life stage can survive and reproduce. But what happens when these natural soundscapes are disturbed by anthropogenic noise? And what is the effect when the soundscape in a degraded reef gets enriched with sounds of a healthy coral reef?
In our experiments, which we just finished a few days ago, we investigated how different underwater soundscapes influence the colonization of hard substrata by the larvae of marine invertebrates. For this, we placed PVC settlement panels in the water and exposed them to playbacks of either boat noise, or amplified recordings from healthy coral reefs. A further group of panels was not exposed to any playbacks. By comparing the communities that establish under these different acoustic conditions, we can determine whether soundscapes affect the settlement of larvae.
Challenges
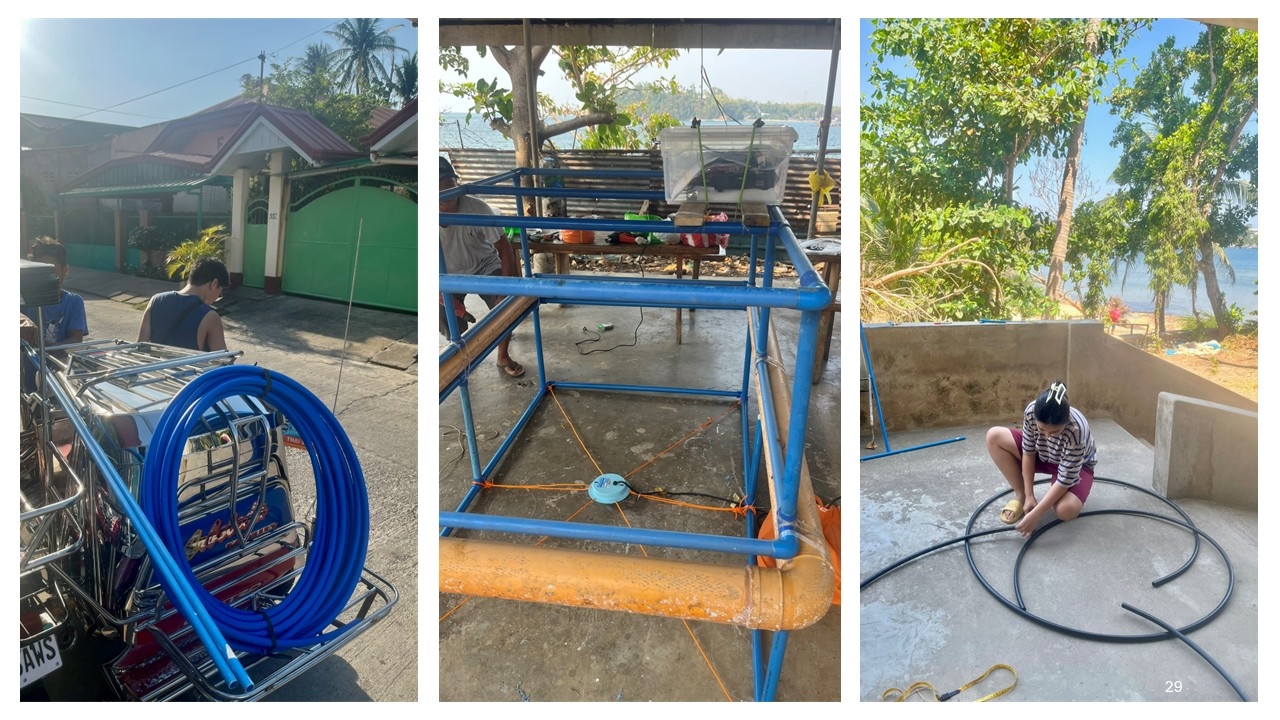
In contrast to the other GAME teams of this year’s project, we don’t have a jetty at BML. So, our first challenge was to build a setup that could carry an MP3 player for the soundscape playbacks, an amplifier, and an underwater speaker, which all need electricity supply, and position it about 30 to 50 meters away from the beach.
We ended up building a floating frame that carries the settlement panels as well as the underwater speaker, and combined it with a waterproof box, which was above the waterline and contained all the sensitive technical equipment. The box was firmly sealed so that it withstood waves and heavy monsoon rains, while its interior remained dry. At the same time, it was protected with a reflective car cover to prevent the technical equipment from overheating, as the box was constantly exposed to the burning tropical sun. To supply the set up with electricity, we – with the help of technicians and divers – rammed long bamboo poles into the seafloor and attached a cable to them that was connected to an electrical outlet on land.
As a consequence of this particular set up,