

Clean-energy growth helped China’s carbon dioxide (CO2) emissions fall by 1% year-on-year in the first half of 2025, extending a declining trend that started in March 2024.
The CO2 output of the nation’s power sector – its dominant source of emissions – fell by 3% in the first half of the year, as growth in solar power alone matched the rise in electricity demand.
The new analysis for Carbon Brief shows that record solar capacity additions are putting China’s CO2 emissions on track to fall across 2025 as a whole.
Other key findings include:
- The growth in clean power generation, some 270 terawatt hours (TWh) excluding hydro, significantly outpaced demand growth of 170TWh in the first half of the year.
- Solar capacity additions set new records due to a rush before a June policy change, with 212 gigawatts (GW) added in the first half of the year.
- This rush means solar is likely to set an annual record for growth in 2025, becoming China’s single-largest source of clean power generation in the process.
- Coal-power capacity could surge by as much as 80-100GW this year, potentially setting a new annual record, even as coal-fired electricity generation declines.
- The use of coal to make synthetic fuels and and chemicals is growing rapidly, climbing 20% in the first half of the year and helping add 3% to China’s CO2 since 2020.
- The coal-chemical industry is planning further expansion, which could add another 2% to China’s CO2 by 2029, making the 2030 deadline for peaking harder to meet.
Even if its emissions fall in 2025 as expected, however, China is bound to miss multiple important climate targets this year.
This includes targets to reduce its carbon intensity – the emissions per unit of GDP – to strictly control coal consumption growth and new coal-power capacity, as well as to increase the share of cleaner electric-arc steelmaking in total steel output.
If policymakers want to make up for these shortfalls, then there will be additional pressure on China’s next “nationally determined contribution” (NDC, its international climate pledge for 2035) and its 15th five-year plan for 2026-30, both due to be finalised in the coming months.
The falling trend in CO2 emissions – and the clean-energy growth that is driving it – could give policymakers greater confidence that more ambitious targets are achievable.
Falling emissions from power, cement and steel
The reduction in emissions in the first half of 2025 was predominantly driven by the power sector, aided by the building materials, steel and heating industries.
Coal use in the power industry fell by 3.4% compared with the same period a year earlier, while gas use increased by 6%, resulting in a 3.2% drop in emissions for the sector overall.
The reduction in CO2 emissions from coal use in the power sector is shown at the bottom of the figure below, along with the small rise due to higher gas-fired electricity generation.
Other changes in CO2 emissions in the first half of 2025, compared with the same period in 2024, are broken down by source and sector in the rest of the figure.
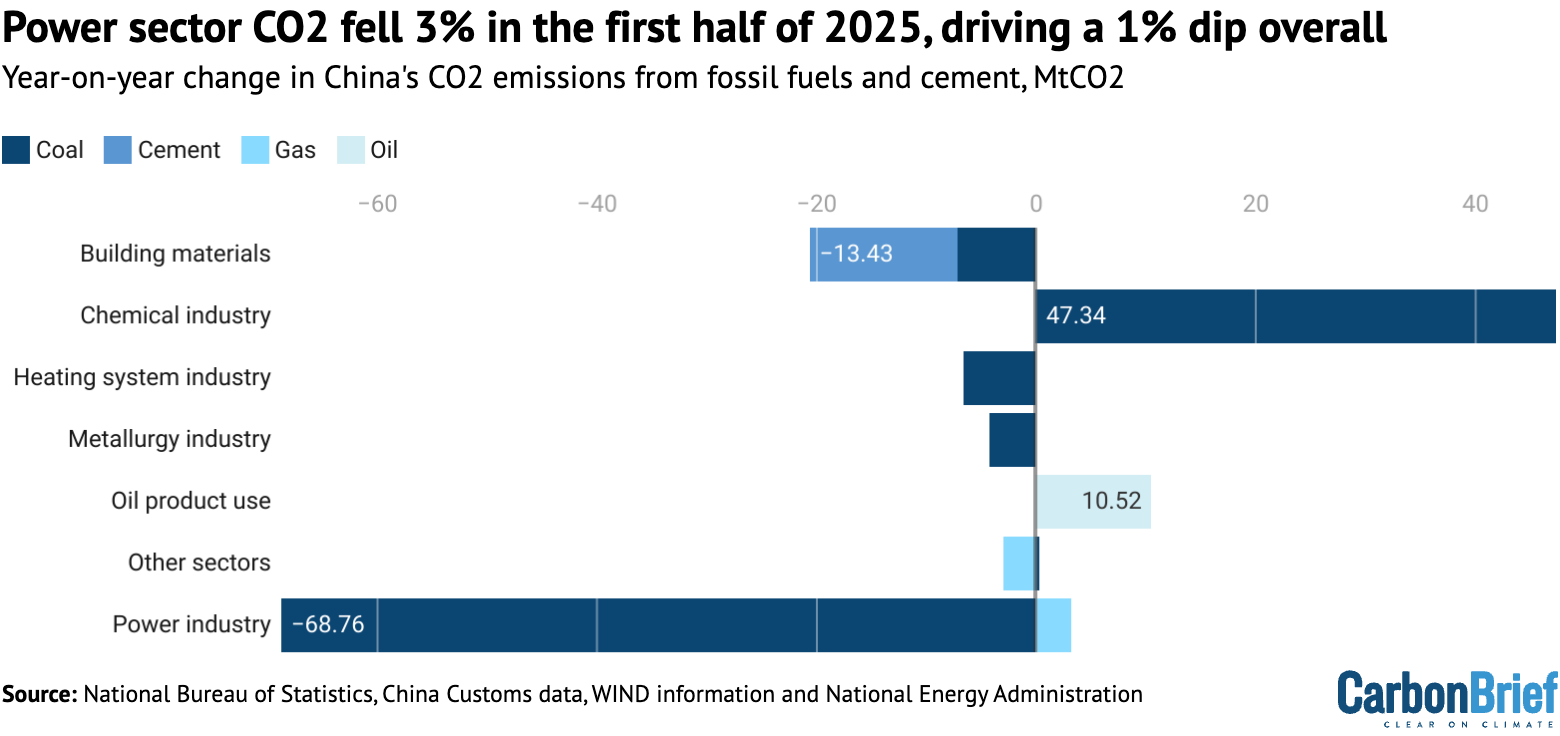
Emissions from the building materials sector fell by 3% and from the metals industry by 1%, with cement falling 4% and steel output 3%. The reason for these reductions is the ongoing contraction in the construction sector, with real estate investment falling 11% and the floor area of new construction starts by 20%. Traditional targets of government infrastructure investment, such as transportation, also showed relatively slow growth.
CO2 reductions resulting from the drop in steel output were limited by a fall in the share of electric arc furnace (EAF) steelmaking, a much less emissions- and energy-intensive process than the coal-based production of primary steel.
The share of electric-arc output in total production fell from 10.2% in 2024 to 9.8% in the first half of 2025, despite a government target of 15% for this year.
Excess coal-based capacity and a lack of incentives for shifting production mean that electric arc steelmakers, rather than coal-based steel mills, tend to absorb reductions in output, as their operating costs are higher and costs of shutting down and starting up production lines are lower.
Shifting to EAF steel is one of the largest emission reduction opportunities in China over the next decade, according to an analysis by the Centre for Research on Energy and Clean Air.
Elsewhere, consumption of oil products increased by 1%. However, this growth did not come from transport fuel demand. The production of petrol, diesel and jet fuel all continued to fall, with electric vehicles eating into road-fuel demand. Instead, growth was driven by demand for naphtha from petrochemicals producers, including newly commissioned plants.
Gas use outside the power sector – mainly heating – dropped by 1%, after a fall in the first quarter due to mild winter temperatures and a smaller increase in the second quarter.
Solar boom covers power demand growth
The first half of 2025 saw a new record for the growth of clean power generation excluding hydro, made up of solar, wind, nuclear and biomass.
Clean power generation from solar, wind and nuclear power grew by 270 terawatt hours (TWh), substantially exceeding the 170TWh (3.7%) increase in electricity consumption. Hydropower generation fell by 3% (16TWh), moderating the fall in fossil fuel-fired power generation.
The rise in power generation from solar panels, on its own, covered all of the growth in electricity demand, increasing by 170TWh – equivalent to the national power output of Mexico or Turkey over the same period. Wind power output grew by 80TWh and nuclear by 20TWh.
As a result, the share of low-carbon sources reached 40% of the nation’s electricity generation overall in the first half of the year, up from 36% in the same period of 2024.
The figure below shows how clean-energy sources excluding hydro (columns) have started matching the recent increases in China’s electricity demand (solid line), as well as the average amount of growth in recent years (dashed line).

Strikingly, the record growth of solar and continued expansion of wind mean that both sources of electricity generation overtook hydropower for the first time in the first half of 2025, as shown in the figure below. Despite steady growth, nuclear power is a relatively distant fourth, at less than half of the power generation from each of the other three major non-fossil technologies.

The growth in solar power generation was driven by record capacity growth. China added 212GW of new solar capacity in the first half of the year, double the amount installed in the first half of 2024, which itself had been a new record.
For comparison, the world’s second-largest nation for solar capacity – the US – had only installed 178GW, in total, by the end of 2024, while third-ranked India had 98GW.
Some 93GW of new solar capacity was added to China’s grid in May alone, as the rush to install before a change in pricing policy culminated. This rate of installations translates to approximately 100 solar panels installed every second of the month.
The acceleration was due to a change in the policy on tariffs paid to new wind and solar generators, which started in June. Previously, new plants were guaranteed to receive the benchmark price for coal-fired power output in each province, for each unit of electricity they generate. Under the new policy, new generators have to secure contracts directly with electricity buyers, causing uncertainty and likely putting downward pressure on revenue.
The resulting surge in new capacity means that solar is poised to overtake wind this year – and hydro this year or next – to become the largest source of clean power generation in China.
This is despite solar capacity additions slowing down in June and projections diverging widely on how much growth to expect for the remainder of 2025 and into 2026, under the new policy.
The consensus among forecasters has been one of a sharp slowdown in installations.
After the new pricing policy was announced, the China Electricity Council (CEC) and China Photovoltaic Industry Association (CPIA) projected 210GW and 215-235GW for 2025 as a whole, respectively, implying plummeting additions in the second half of the year. In contrast, the State Grid Energy Research Institute expects 380GW to be added to the grid this year.
After data for May installations became available, the CEC upgraded its forecast for the whole year to 310GW and the CPIA to 270-300GW, implying that 60-100GW would be added in the second half of the year. This would still be a sharp deceleration compared with the second half of 2024, when 173GW was added.
For wind, the State Grid researchers expect 140GW and CEC 110GW, while 51GW was added in the first half of the year. Both numbers indicate larger capacity additions in the second half of 2025 and an increase for the full year compared with 2024.
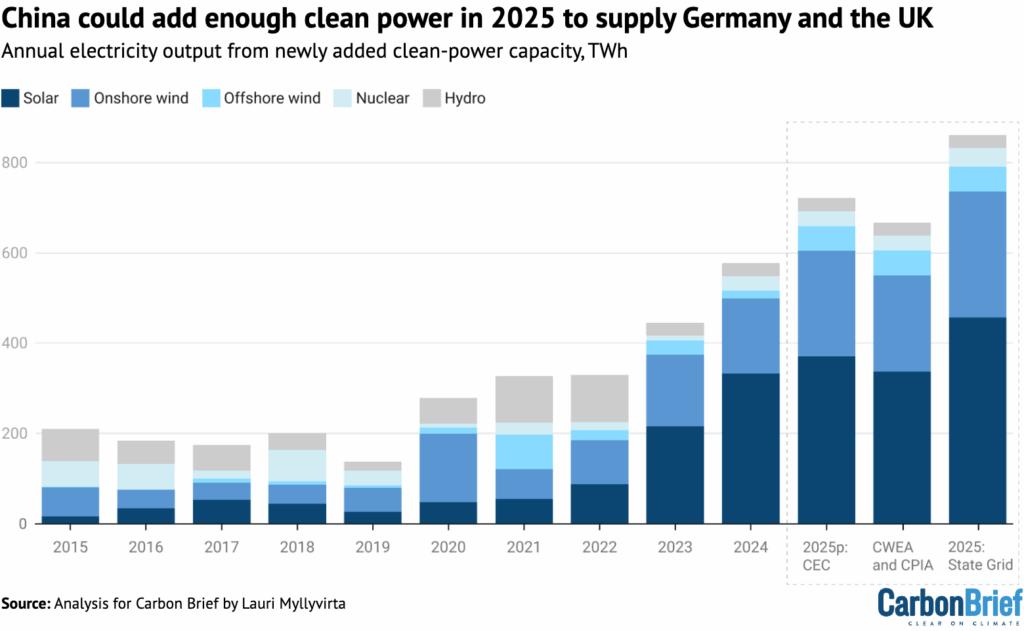
The State Grid should have detailed knowledge of projects seeking to connect to the electricity grid, so its projections carry extra weight compared with others. If its expectations for wind and solar growth are realised, this would result in around 850TWh of annual clean power generation being added to the grid in 2025, as shown in the figure below.
This new clean power capacity would be more than enough to meet the entire electricity demand of Brazil (760TWh), or Germany and the UK combined (817TWh).
With the State Grid also projecting demand to grow by 400-640TWh (4.0-6.5%), clean-energy growth should push down CO2 from China’s power sector this year – and well into next year.
China’s top economic planner, the National Development and Reform Commission (NDRC), is also taking steps to spur demand for contracts with solar and wind producers.
A new policy – published in July – requires for the first time that steel, cement and polysilicon factories, as well as some new data centres, meet a certain percentage of their demand using renewable electricity.
Previously, such requirements were only applied to provinces, power distribution companies and the aluminum industry. Their mandated renewable energy shares have also now increased.
These changes boost demand for contracts with renewable electricity suppliers, just as new solar and wind plants are having to secure contracts directly with buyers, under their new pricing policy.
The increase in demand for renewable power resulting from these measures broadly matches the low end of the growth projected in solar and wind this year. The renewable quotas therefore offer a backstop of support for the continued growth of clean power, which will be required to meet China’s wider climate and energy targets.
The increase in solar power generation from rising installations could be even larger, but is being limited by issues around grid management and capacity.
The share of potential solar power output that was not utilised rose to 5.7% in the first half of 2025, from 3.2% a year earlier. While technical issues such as uncompleted grid connections could play a role amid the boom, this also implies a significant increase in curtailment.
The average utilisation rate of solar panels fell by 12% in the first quarter of this year, compared with the 2020–2023 average, according to China Electricity Council data accessed through Wind Information. This is a much larger reduction than indicated by the reported curtailment rates. The flipside of this dip in utilisation is that improvements to grid operation and infrastructure will unlock even more generation from existing solar capacity.
Coal power capacity is expected to surge this year, even as demand for power generation from coal contracts. The State Grid predicts 127GW of thermal power added. Some of this will be gas, but based on non-coal thermal power additions expected by the CEC, around 90-100GW is coal, while the CEC projects 80GW of coal power added.
Data from Global Energy Monitor shows 93-109GW of coal-power projects under construction that could be completed this year, assuming a 2.5 to 3-year lead time from issuance of permits to grid connection. The largest amount of coal-fired capacity China has ever connected to the grid in one year is 63GW in 2008, so 2025 seems likely to set a new record by a large margin.
A former senior official at one of China’s largest power firms stated in an interview in June 2025 that companies are building coal power capacity due to central government pressure.
There is little enthusiasm to invest and the target to expand coal-power capacity to 1,360GW in this five-year plan period, covering 2021-2025, is unlikely to be met. Operating coal-power capacity was 1,210GW at the end of June, up from 1,080GW at the end of 2020.
The influx of coal-fired capacity will result in falling utilisation and profitability.
However, oversupply of coal power could also weaken demand for contracts with solar and wind producers, undermining clean-energy growth. This makes measures that offer a backstop of demand for clean power, such as the sector quotas, all the more significant.
Coal chemicals shooting up
The only major sector that saw growth in emissions in the first half of the year was the chemicals sector. Coal use in the sector, both as a fuel and a feedstock, increased by a dramatic 20% year-on-year, on top of a 10% increase in 2024.
Oil use in the chemicals sector increased as well, as reflected in a 9% increase in total consumption of naptha – a key petrochemicals feedstock – estimated from OPEC data.
The growth is driven by the coal-to-chemicals industry, which turns coal into synthetic liquid and gaseous fuels, as well as petrochemical products. This is a sector that China has developed aggressively, to reduce reliance on imported oil and gas, as well as to promote the exploitation of coal resources in the country’s far west – particularly Xinjiang – where coal and coal power exports to the rest of China are limited by transportation capacity and costs.
The sector consumed approximately 390m tonnes of coal in 2024, resulting in an estimated 690m tonnes CO2 emissions (MtCO2), making it responsible for 6% of China’s fossil CO2 emissions and 9% of the country’s coal use in 2024.
Coal use and emissions increased 10% from 2023 while total coal conversion capacity increased only 5%, implying that the utilisation of existing capacity increased as well.
The coal-to-chemicals industry used 155m tonnes of standard coal in 2020 and CO2 emissions were estimated at 320MtCO2. The coal-to-chemicals industry therefore added around 3% to China’s total CO2 emissions from 2020 to 2024, making it one of the sectors responsible for the recent acceleration in the country’s CO2 emissions growth and its shortfall against targets to control increases in CO2 emissions and coal use.
Output from the sector reportedly replaced 100m tonnes of oil equivalent (Mtoe) of oil and gas in 2024, which implies 250-280MtCO2 emissions avoided from oil and gas use, depending on how the avoided demand breaks down between oil and gas.
The net effect of the industry on CO2 emissions was therefore an increase of around 410-440MtCO2, or 4% of China’s total CO2, highlighting that coal-based chemical production is much more carbon-intensive than its already carbon-intensive oil- and gas-based equivalent.
The sector’s growth in coal use and emissions reflects drastically improved profitability in most segments in recent years. Its profitability depends heavily on the oil price, so the sharp increase in oil prices from the 2015-2020 level in 2021-24 supported output growth, whereas the recent fall in oil prices could temper it.
The chemical industry association still expects the sector to expand capacity for another decade, until 2035, even under China’s CO2 peaking target.
Analysis by Tianfeng Securities touts the years 2025-2030 as the “peak period” for investment in coal to chemicals, claiming that potential annual investment over the next five years could reach three times the 2021-23 level and that half of this potential investment is in Xinjiang province.
Sinolink Securities projects that an average of at least 37m tonnes of coal conversion capacity will be added in the coal-to-chemicals industry each year from 2025 to 2029, with coal-to-oil-and-gas and coal-to-methanol dominating these capacity additions.
This would mean a 40% increase in the industry’s capacity from 2024 to 2029, with the potential to add over 250MtCO2 per year of emissions, increasing total CO2 emissions by over 2%.
The figure below illustrates this potential increase, which would continue recent trends.

If this further expansion takes place – and assuming new chemicals plants are used at the same rate as the existing fleet is being used today – then it would complicate China’s carbon peaking target and make the CO2 intensity target for 2030 even more challenging to meet.
However, this is not the first time that the industry has been predicted to boom. In 2014, the China Coal Association issued a prediction that the coal-to-chemicals industry would be using 750Mt of coal per year by 2020, converting to about 540Mt of “standard” coal.
In reality, less than a third of this demand was realised – in large part due to low oil prices – and the sector was still only using half of this amount by the end of 2024.
New targets on the horizon
Given the major increase in solar capacity in the first half, as well as expected additions of wind and nuclear throughout the year, China is on track for a fall in emissions in 2025.
This would continue a declining trend that began in early 2024 and leaves open the possibility that China’s emissions could have peaked already, years ahead of its “before 2030” target.
The recent slide in China’s total CO2 emissions is shown in the figure below, with the shallow decline illustrating the potential that this trend could be reversed.
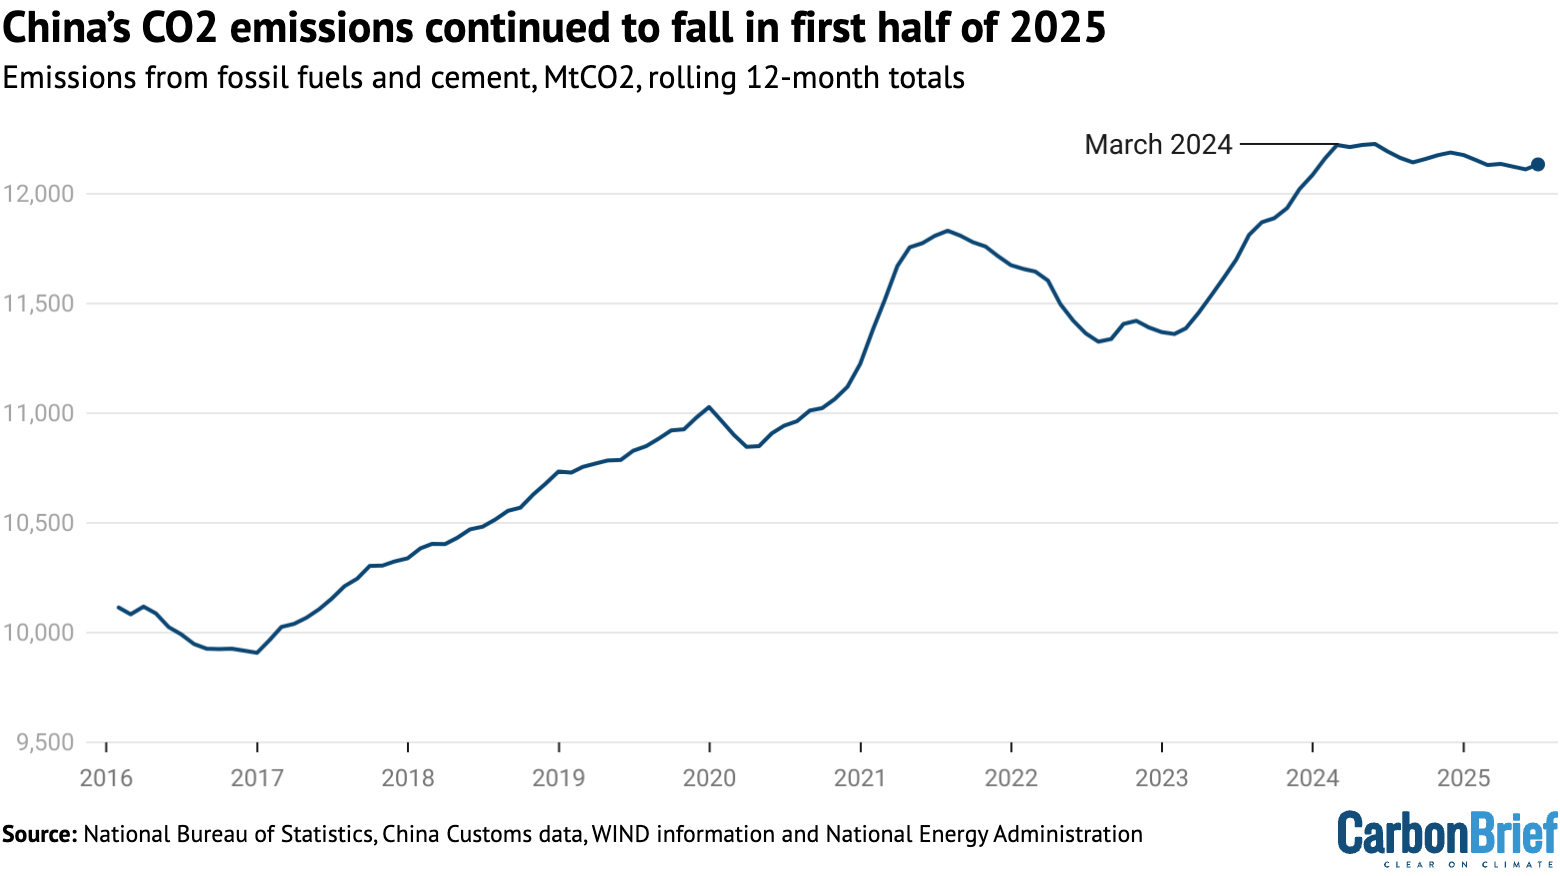
Even if China’s emissions fall by a few percent this year, however, this is unlikely to be sufficient to meet the carbon intensity target for 2025 in the current five-year plan. Still, it would make the country’s 2030 carbon intensity commitment under the Paris Agreement easier to meet.
A continuing fall in emissions, extending the fall that began in early 2024, could also affect target-setting for the next five-year plan – which is being prepared for release in early 2026 – by showing that China could peak and reduce its emissions well ahead of the 2030 deadline.
Yet, despite rapid progress in 2024 and 2025, China is bound to miss multiple emissions-related targets in the 2021-2025 period, due to rapid CO2 rises during and after the Covid pandemic.
These targets include improvements in carbon intensity, “strict” controls of the growth in coal consumption and new coal-fired power plants, as well as the share of cleaner electric arc steelmaking in total steel output.
If China’s policymakers want to make up the shortfall against these 2025 targets and get on track for their 2030 goals, then they would need to set out higher ambitions in the 15th five-year plan, covering 2026-2030. For example, this could include reducing the carbon intensity of China’s economy by more than 20% over the next five years.
China’s new pledge (NDC) under the Paris Agreement, with targets for 2035, is due to be published in the next few months and will provide important indications of their intentions.
The new pricing policy for wind and solar has also increased the importance of target-setting, by making “contracts for difference” available for the amount of capacity needed to meet the central government’s clean-energy targets. An ambitious clean-energy target for 2035 would be a significant new backstop for clean-energy growth, with both climate and economic relevance.
Another major question is how the government will react to the influx of coal-fired capacity, even as power generation from coal recedes. It could either move to close down older coal plants – or to limit clean-energy additions.
With respect to coal power plants, the key point remains, however, that as long as clean power generation keeps growing faster than electricity demand, then increases in coal and gas fired capacity will result in falling utilisation, rather than increased CO2 emissions.
About the data
Data for the analysis was compiled from the National Bureau of Statistics of China, National Energy Administration of China, China Electricity Council and China Customs official data releases, and from WIND Information, an industry data provider.
Wind and solar output, and thermal power breakdown by fuel, was calculated by multiplying power generating capacity at the end of each month by monthly utilisation, using data reported by China Electricity Council through Wind Financial Terminal.
Total generation from thermal power and generation from hydropower and nuclear power was taken from National Bureau of Statistics monthly releases.
Monthly utilisation data was not available for biomass, so the annual average of 52% for 2023 was applied. Power sector coal consumption was estimated based on power generation from coal and the average heat rate of coal-fired power plants during each month, to avoid the issue with official coal consumption numbers affecting recent data.
CO2 emissions estimates are based on National Bureau of Statistics default calorific values of fuels and emissions factors from China’s latest national greenhouse gas emissions inventory, for the year 2021. Cement CO2 emissions factor is based on annual estimates up to 2024.
For oil consumption, apparent consumption is calculated from refinery throughput, with net exports of oil products subtracted.

The post Analysis: Record solar growth keeps China’s CO2 falling in first half of 2025 appeared first on Carbon Brief.
Analysis: Record solar growth keeps China’s CO2 falling in first half of 2025

Three countries have been named by the Paris Agreement’s compliance committee for failing to submit a nationally determined contribution (NDC) and repeatedly snubbing offers of help with their climate plans.
After months of internal debate over whether to identify serial non-responders, the Paris Agreement’s Implementation and Compliance Committee (PAICC) named the three countries which have failed to engage with it over their NDCs on Friday.
It named Democratic Republic of Congo, Senegal and North Korea in a footnote of its annual report, adding that it decided to name them “with a view to facilitating engagement”, adding that representatives of the three nations had been invited to its meeting in early 2027 “with the purpose of identifying any challenges and constraints”.
“The Committee noted the importance of Parties engaging with the Committee in a timely manner, while noting that some delays may be due to the national capabilities and circumstances of the Parties”, the report said.