Emissions from land-use change – including deforestation, loss of peatland and forest degradation – have been falling over the course of the 21st century.
The latest Global Carbon Budget report, formally published in May in the journal Earth System Science Data, notes a “statistically significant decrease” in land-use change emissions since the late 1990s.
The 21st-century decline in land-use emissions has accelerated in recent years, with the report highlighting a “steep drop” after 2015.
Writing for Carbon Brief in November 2025, climate scientists Dr Zeke Hausfather and Prof Pierre Friedlingstein noted that land-use emissions in 2025 had decreased by “around 32% compared to their average in the 2000s”.
Via six charts, Carbon Brief explores how – and why – land-use emissions have fallen over the past quarter of a century as fossil-fuel emissions have continued to climb.
How have land-use emissions changed?
Deforestation, forest degradation, loss of peatlands and harvesting trees for wood all release carbon into the atmosphere.
Collectively, these emissions are known as land-use, land-use change and forestry (LULUCF) emissions, referred to here as land-use emissions.
Each year, global land-use emission trends are analysed in the Global Carbon Budget report. The report, produced by dozens of scientists, documents how human-caused greenhouse gas emissions are changing over time.
Key findings from the annual report are released each year in the autumn, before being published formally in an academic journal the following year following a peer-review process.
(For more on the findings of the 2025 report, read Carbon Brief’s summary.)
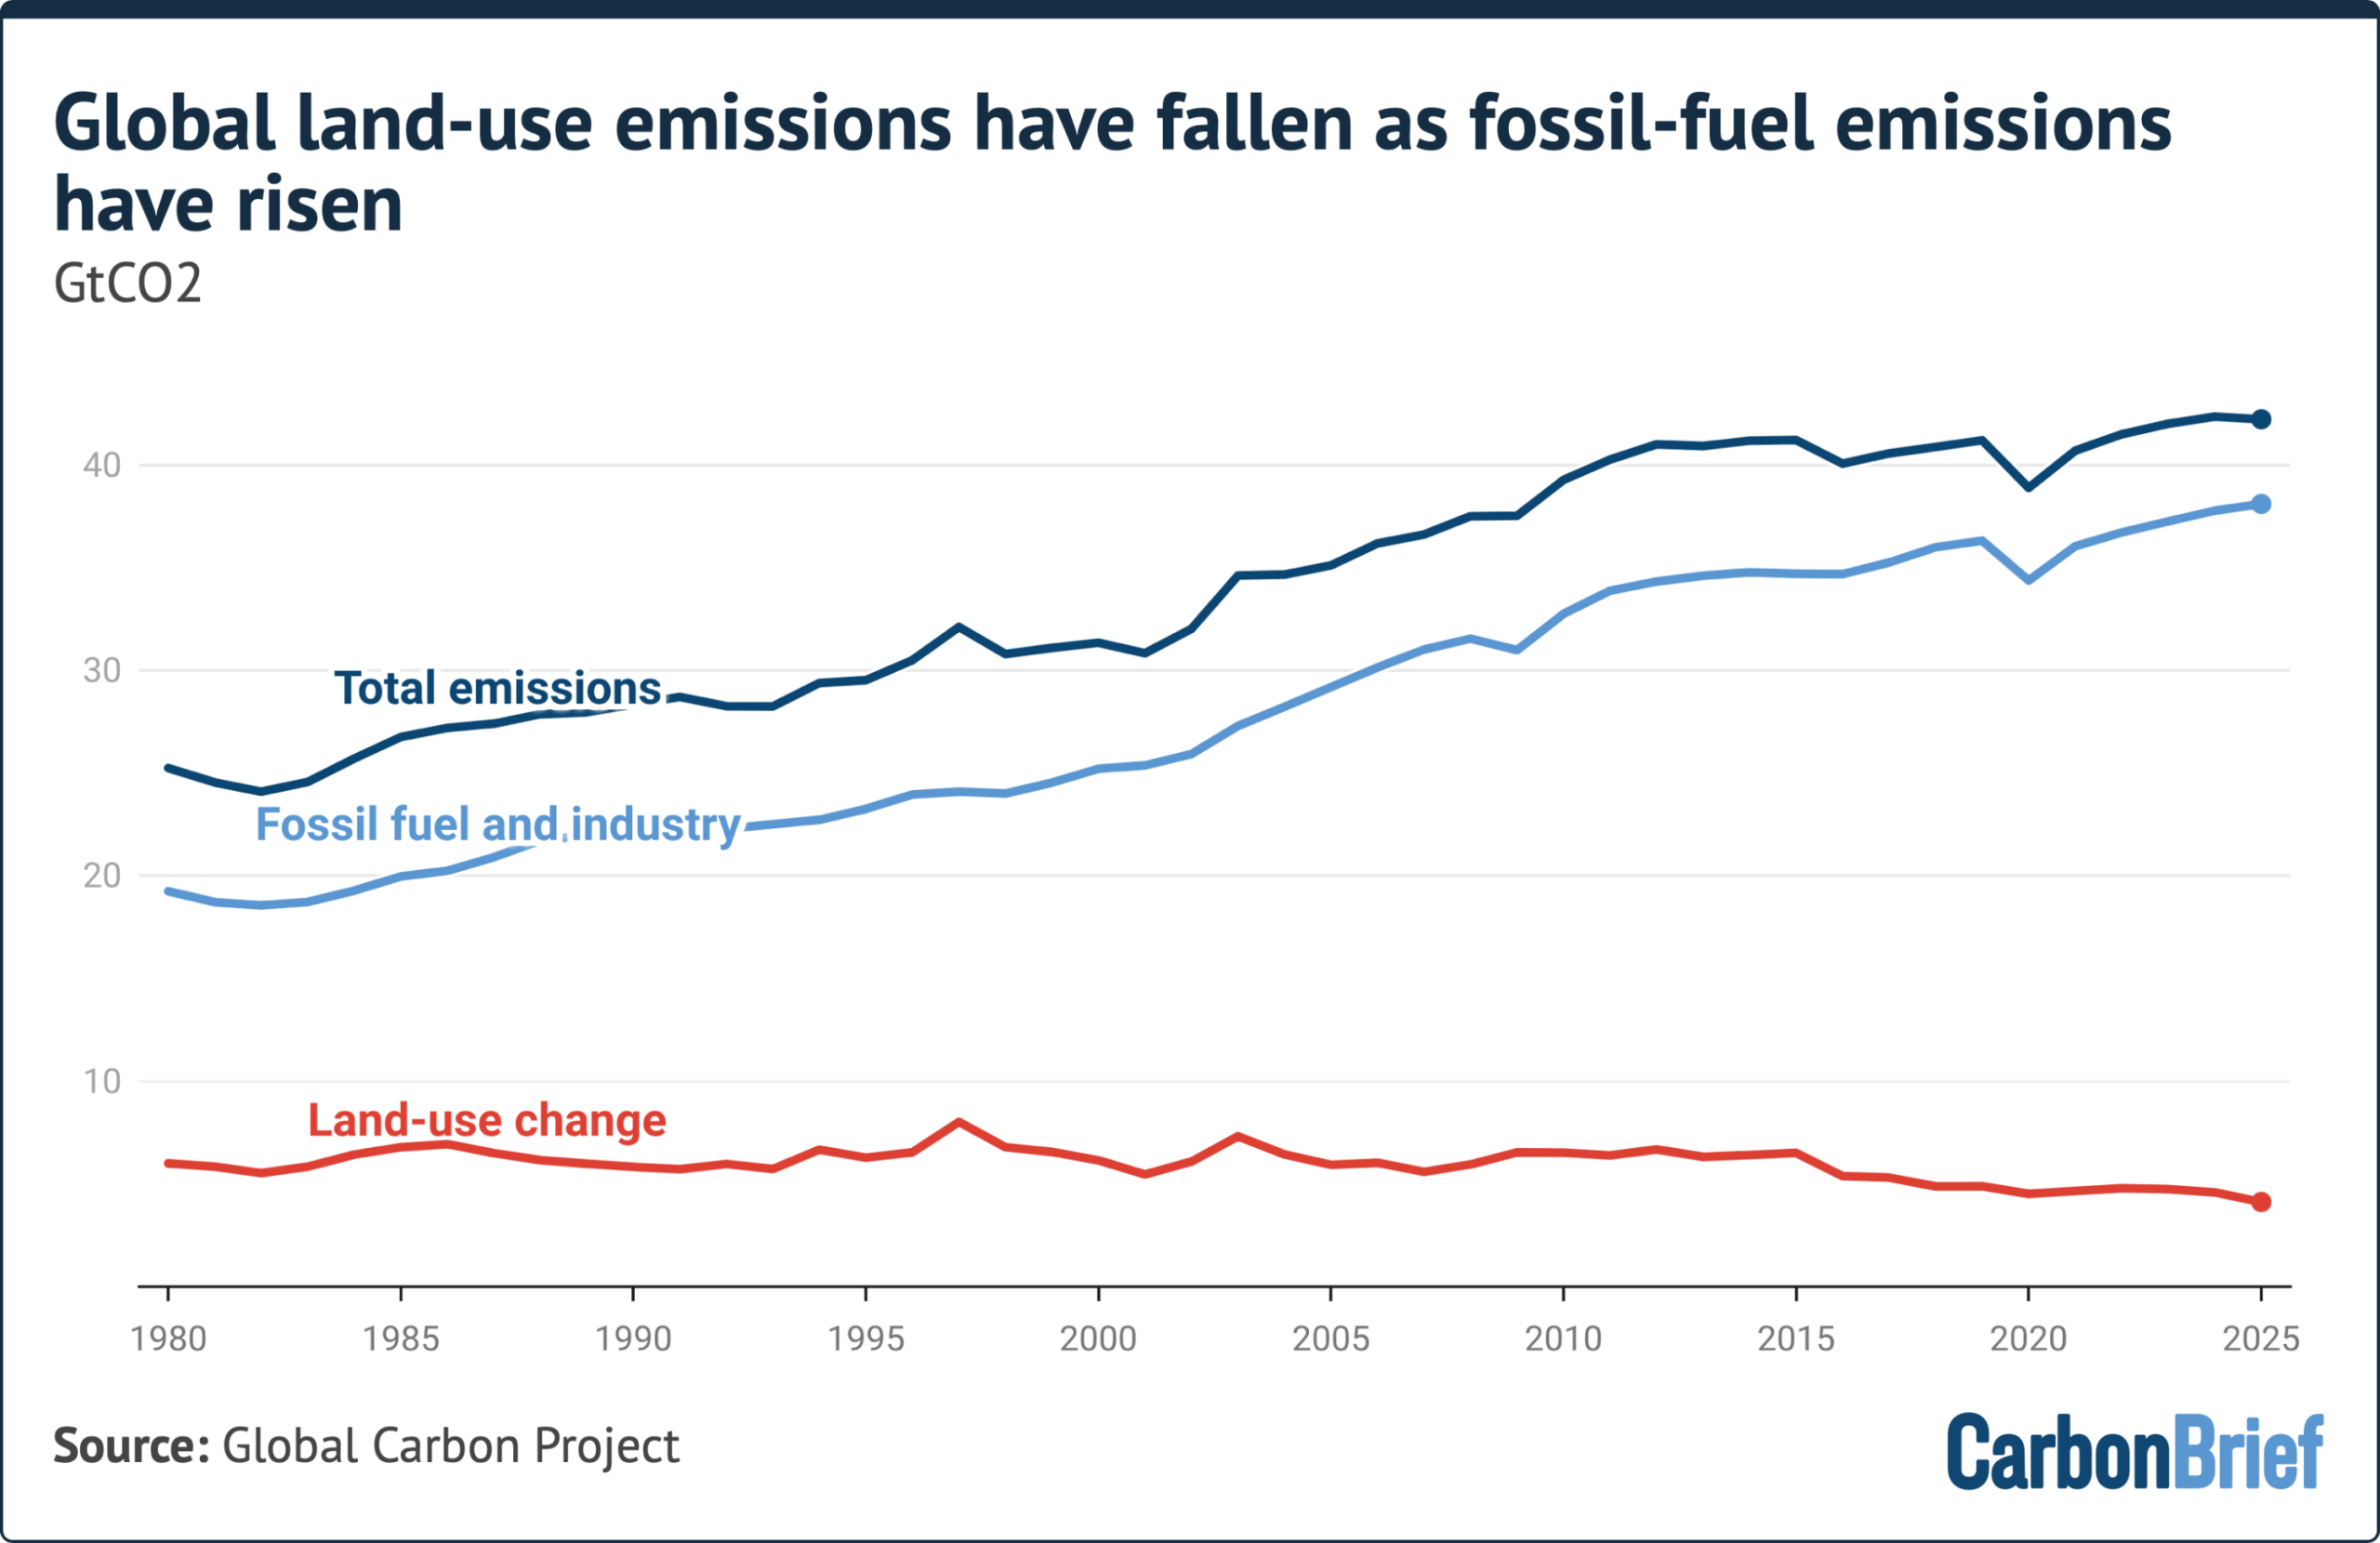
The latest edition of the Global Carbon Budget report notes that, in the four decades to 1999, net CO2 emissions from land-use change remained “relatively constant”, sitting at around 6.6bn tonnes of carbon dioxide (GtCO2) per year.
However, since the late 1990s, global land-use emissions have been falling.
The 2025 report estimates that land-use emissions over 2015-24 averaged at 5GtCO2 a year. This is around 23% lower than the average over 1995-2004 and 19% lower than 2005-14, it says.
In contrast, global emissions from fossil fuels and cement have increased every decade since 1959, rising from an average of 11GtCO2 in the 1960s to 35.9GtCO2 over 2015-24, it says.
“Preliminary data” included in the report suggests that land-use emissions in 2025 clocked in lower than their 2014-25 average, at 4.1GtCO2, as fossil-fuel and cement emissions reached a new high of 38.1GtCO2.
(For more on how land-use emissions are calculated, see: Why are estimates of land-use emissions uncertain?)
The chart below shows how land-use emissions have been falling in the 21st century and have helped to temper the overall rise of human-caused emissions.
Why have land-use emissions fallen?
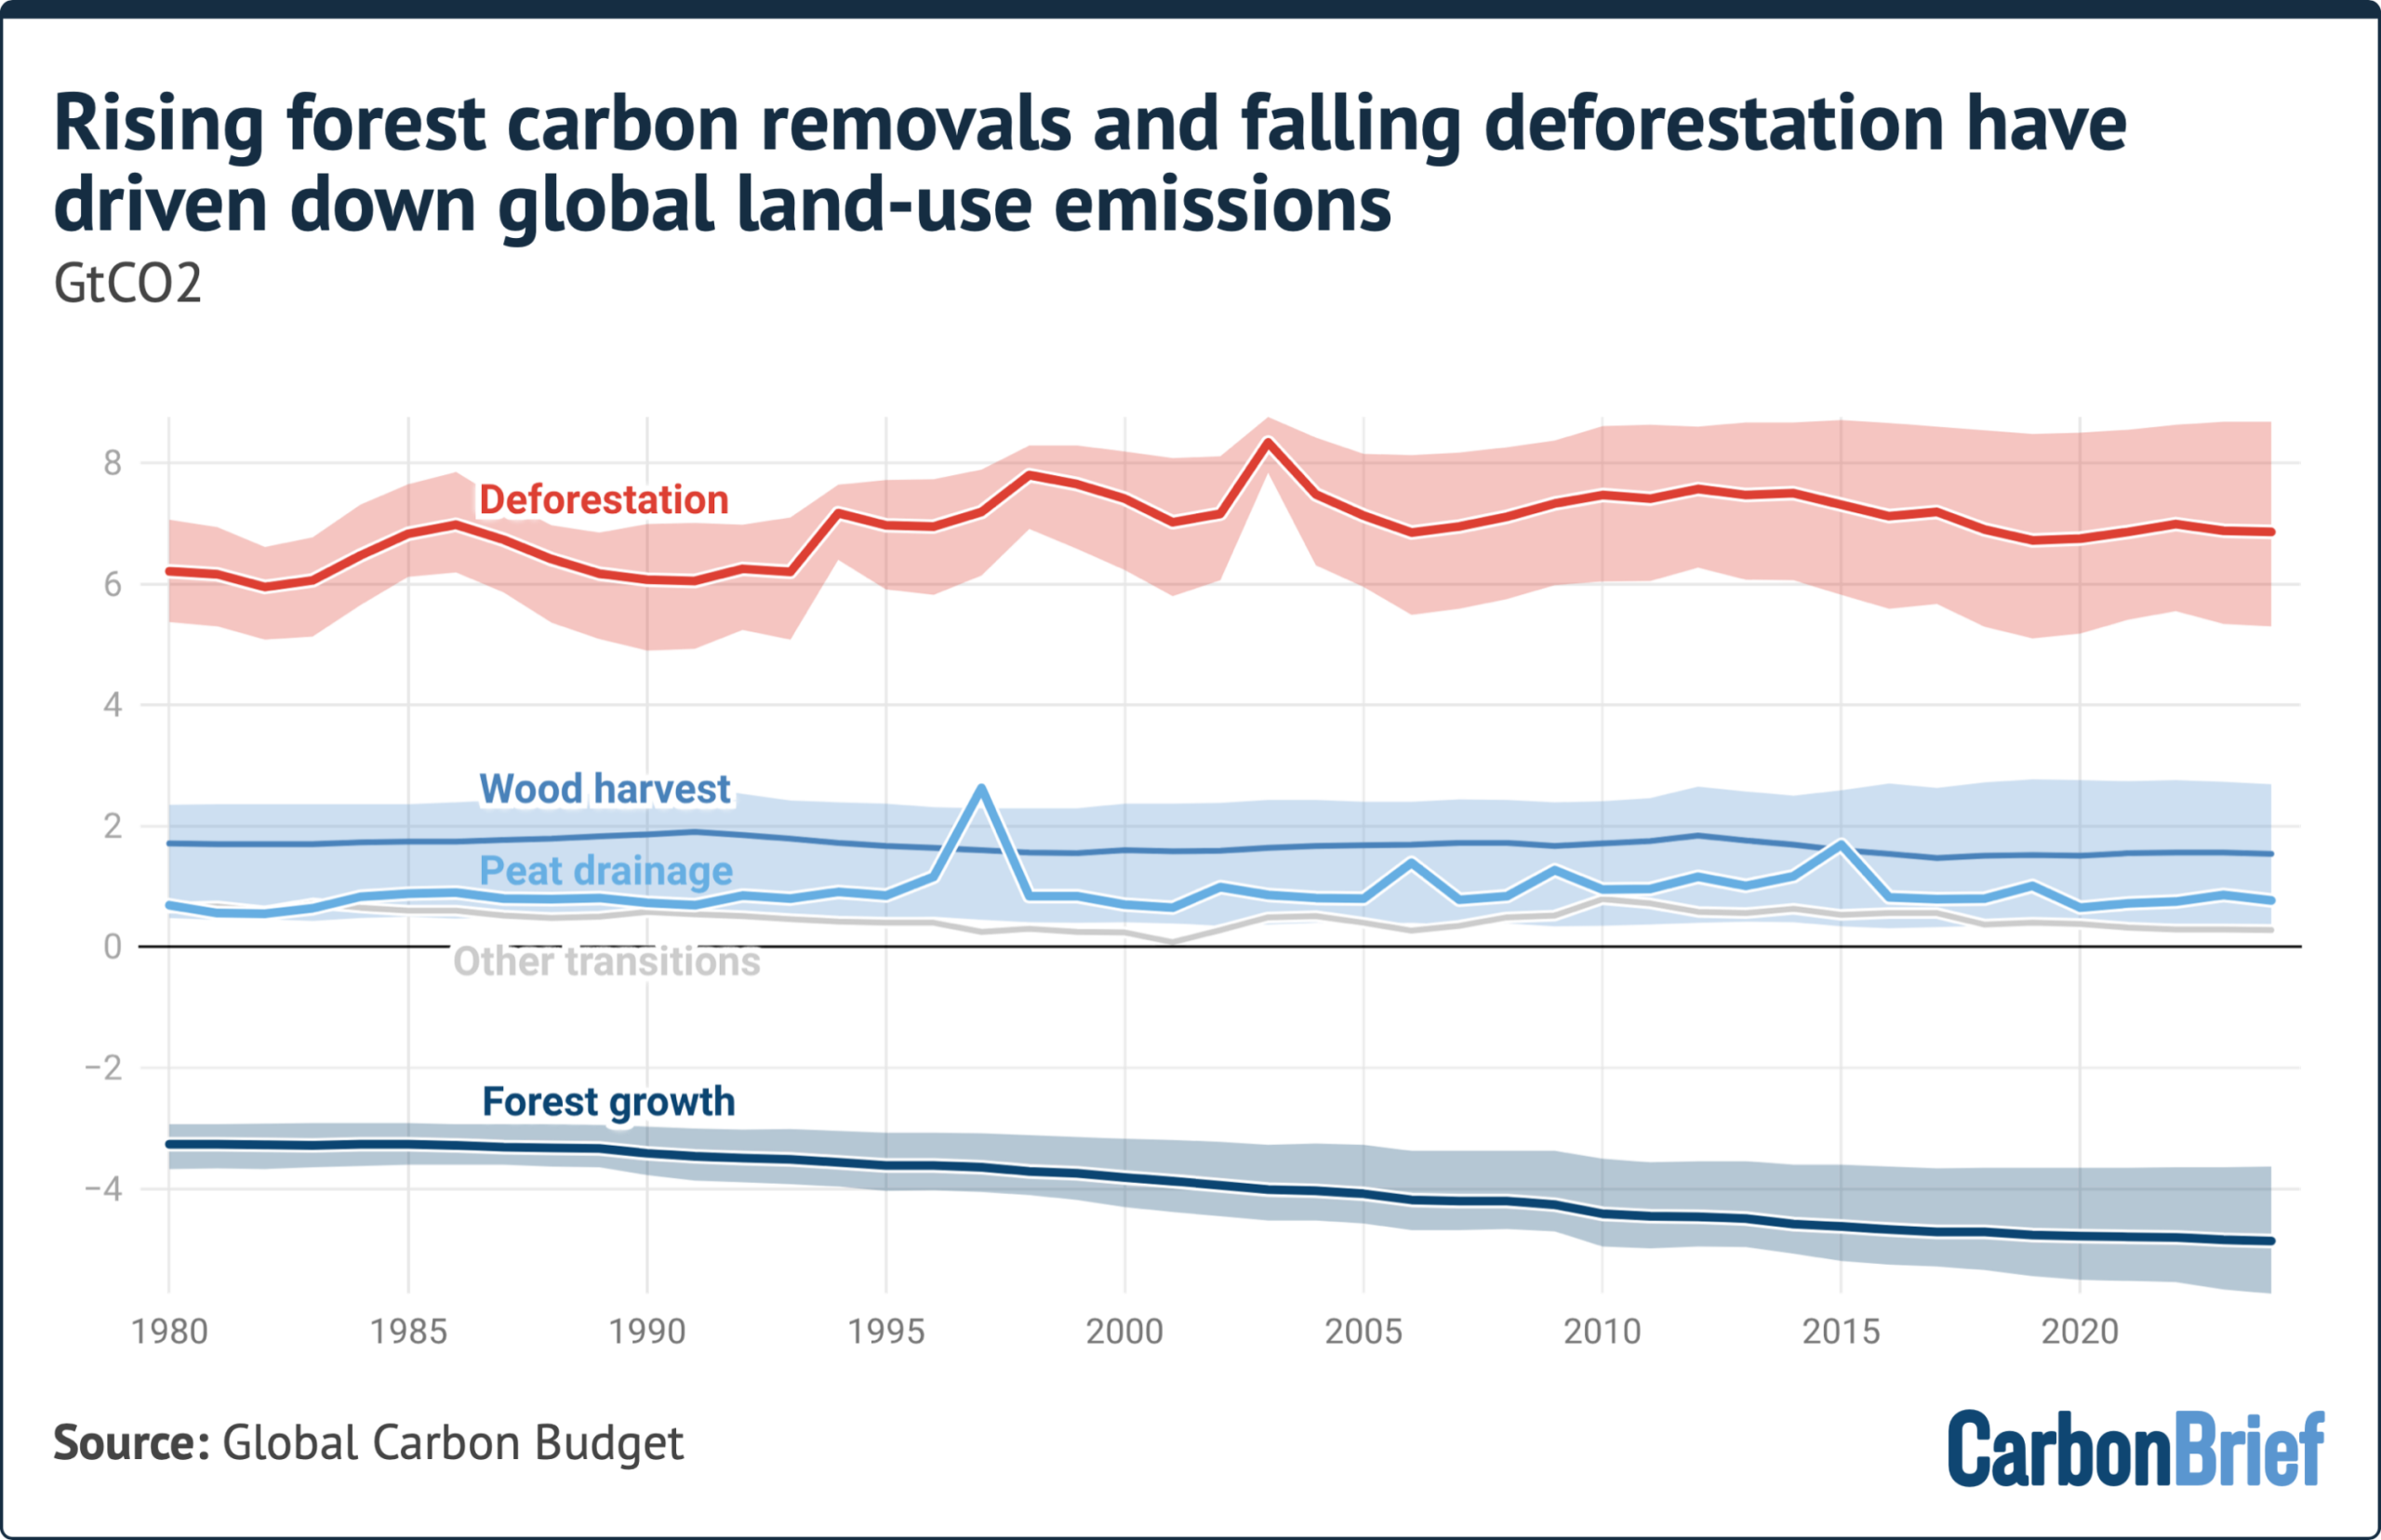
The Global Carbon Budget attributes falling land-use emissions since the late 1990s to decreasing emissions from deforestation, in particular “permanent deforestation”.
Permanent deforestation refers to the complete removal of trees for the conversion of forest to another land use, such as agriculture, mining or the construction of towns and cities. This sets it apart from other forms of deforestation, such as logging and rotational farming, where the canopy is removed on a more temporary basis.
The Global Carbon Budget also points to “increasing [CO2] removals” from forest regrowth as a reason for falling land-use emissions since the turn of the century.
(For more on the countries and policies that have driven these changes, see: Which countries are behind falling land-use emissions? and: Which countries are leading on forest regrowth?)
Looking at more recent trends, the report attributes a “steep drop” in land-use emissions in the decade since 2015 to the “combined effect” of a “peak” in peat fire emissions in 2015, as well as a “long-term decline” in deforestation emissions in many countries over 2010-20.
The chart below shows how deforestation and forest growth have been responsible for the bulk of change to land-use emissions over the 21st century.
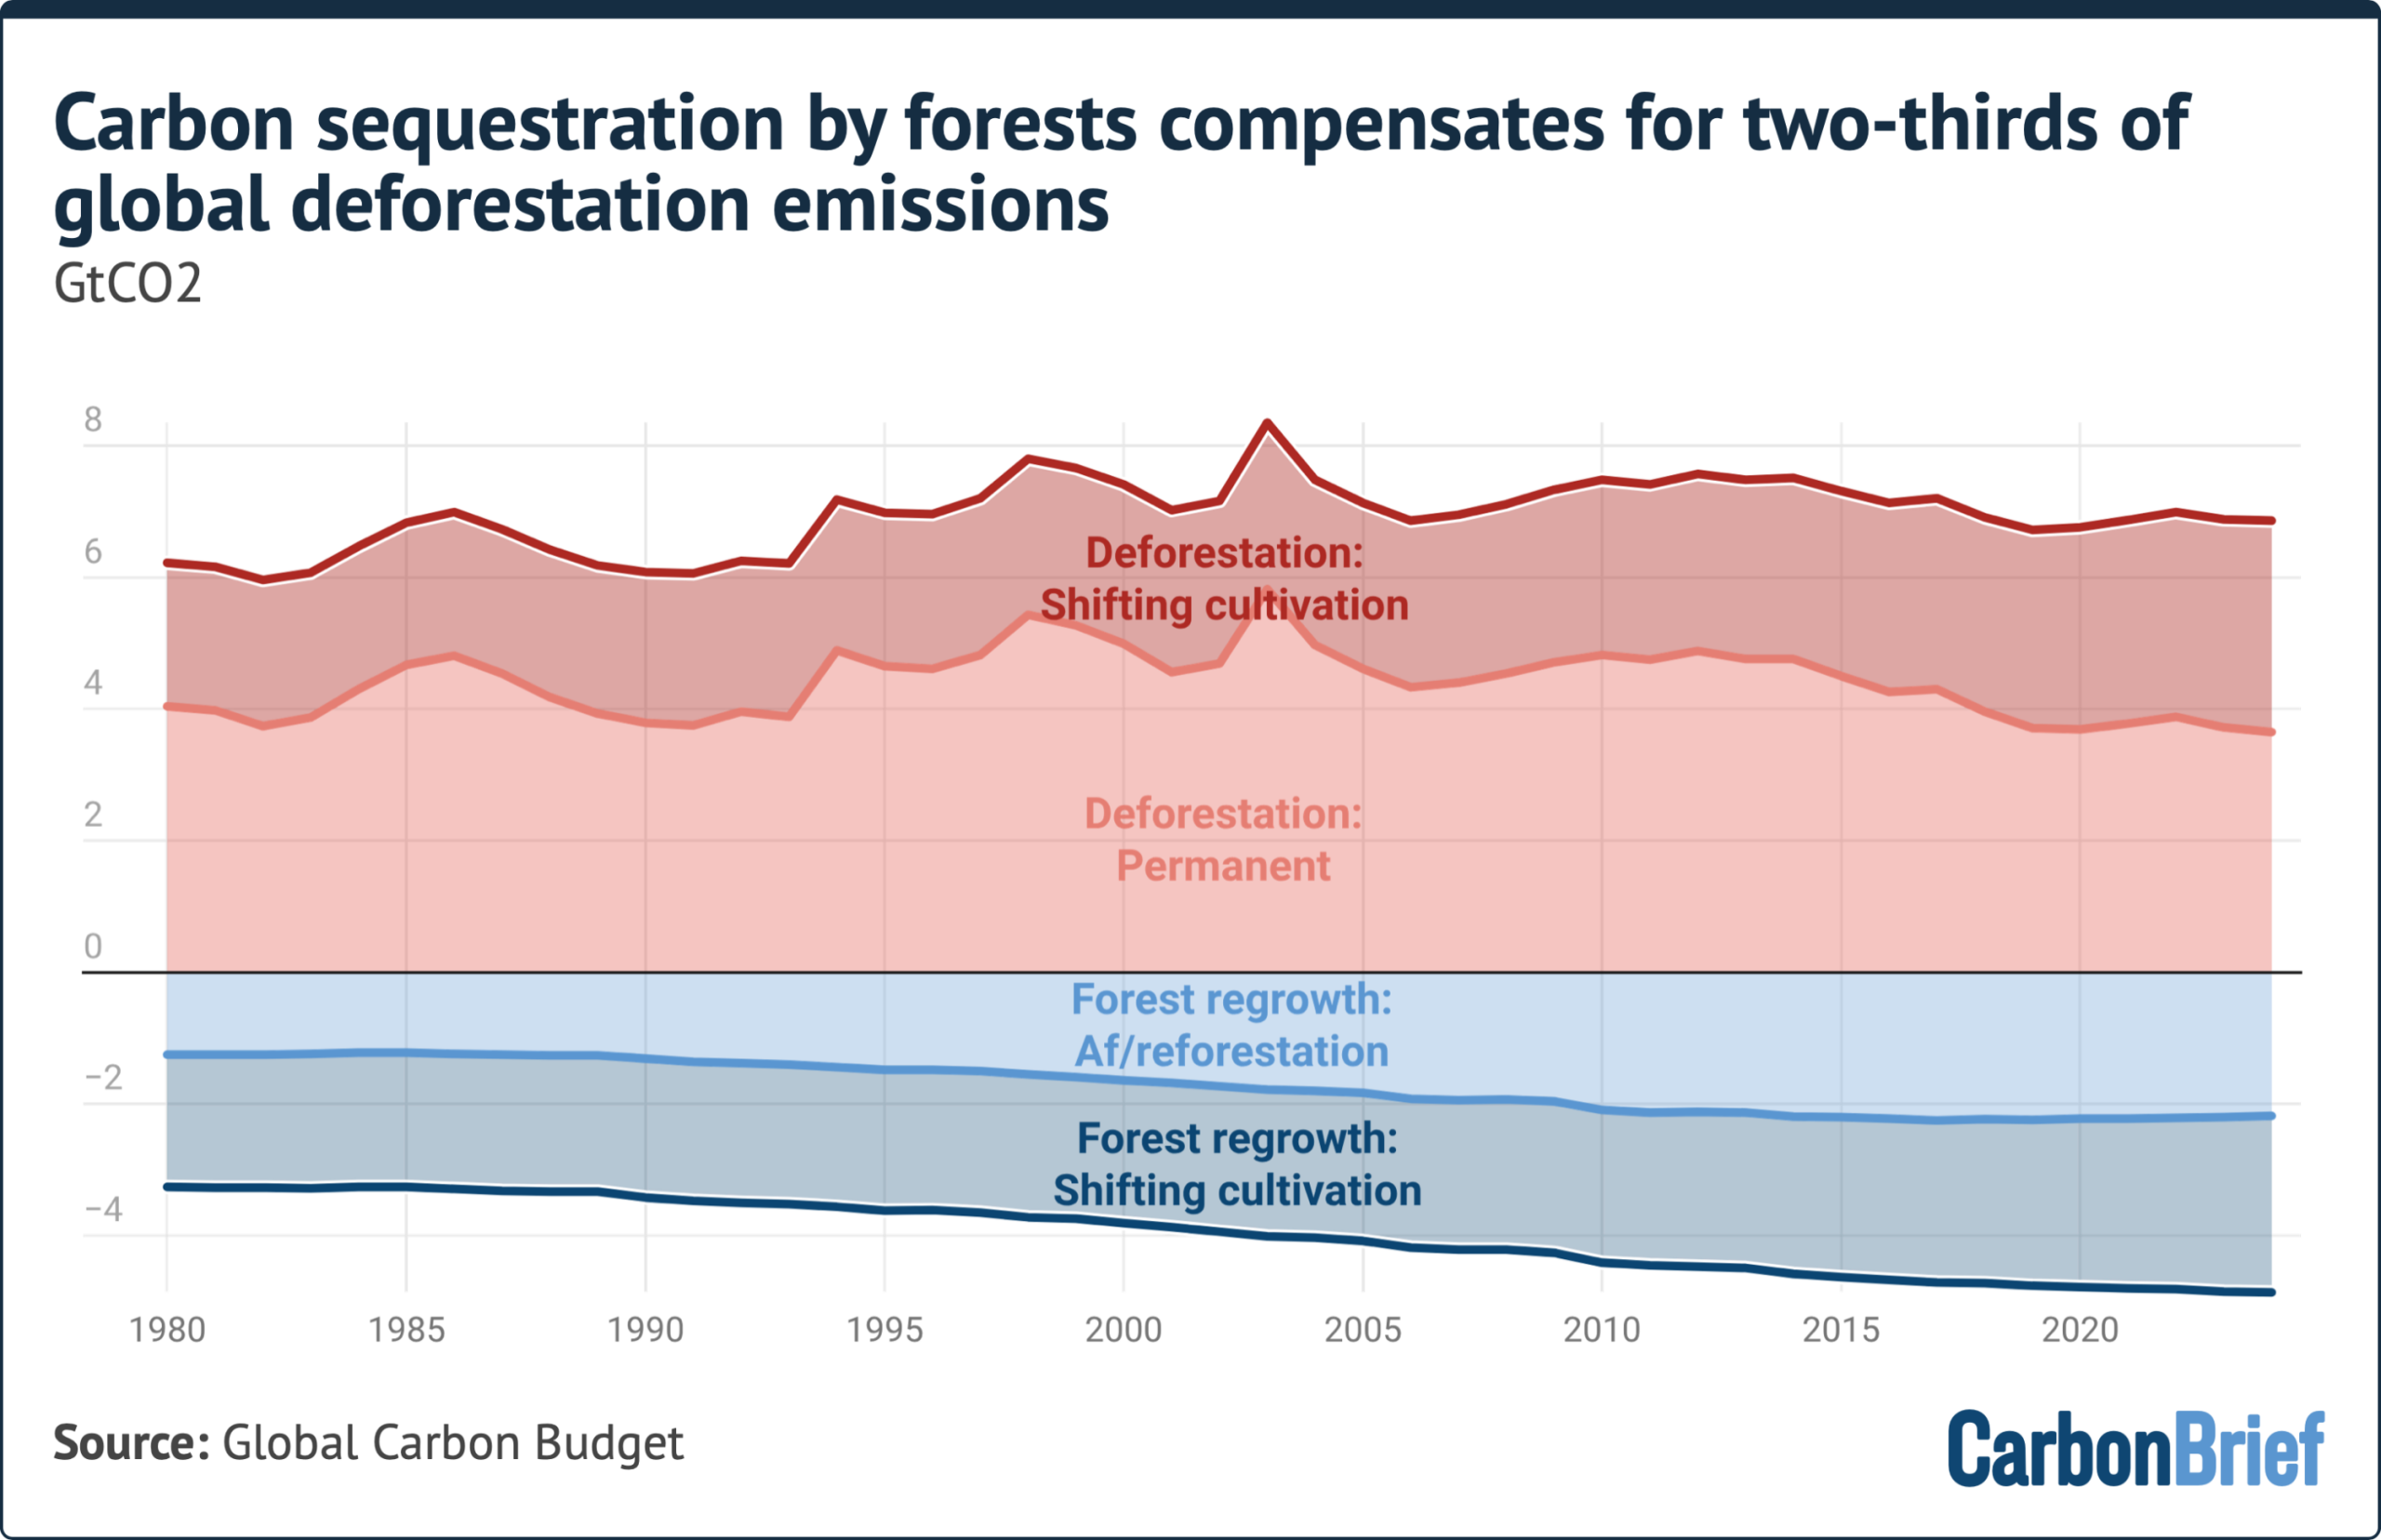
Over 2015-24, the sequestration of CO2 through reforestation and afforestation efforts offset two-thirds of deforestation emissions, according to the Global Carbon Budget report.
Specifically, it notes that deforestation was responsible for an average of 6.96GtCO2 of emissions each year over 2015-24. Forest growth, on the other hand, removed 4.76GtCO2 a year.
Just under half – 2.2GtCO2 – of carbon removals over 2015-24 was from afforestation and reforestation efforts and the remaining 2.56GtCO2 were driven by forest regrowth from shifting cultivation cycles, it says.
Forest regrowth from shifting cultivation refers to the recovery of a forest after a plot has been farmed for a short period and then abandoned.
This is shown in the chart below below, which shows how carbon removals from forest regrowth have offset emissions from deforestation.
In the near-term, the Global Carbon Budget attributes its projection of a drop in land-use emissions between 2024 and 2025 to the “end of El Niño conditions”.
(The naturally occurring weather phenomenon typically leads to the drying out of peatlands in the tropics and causes more planned deforestation fires to burn out of control.)
Prof Pierre Friedlingstein, director of the Global Carbon Budget office and a professor at the University of Exeter, tells Carbon Brief there is “no indication” of what might happen in the future, but adds that land-use emissions trends over the 21st century are “going in the right direction”. He says:
“If you are optimistic, you hope the trend will not reverse and start increasing again. But we don’t know for sure. The assumption, given current land policies across the world, is that deforestation should continue to decline.”
Which countries are behind falling land-use emissions?
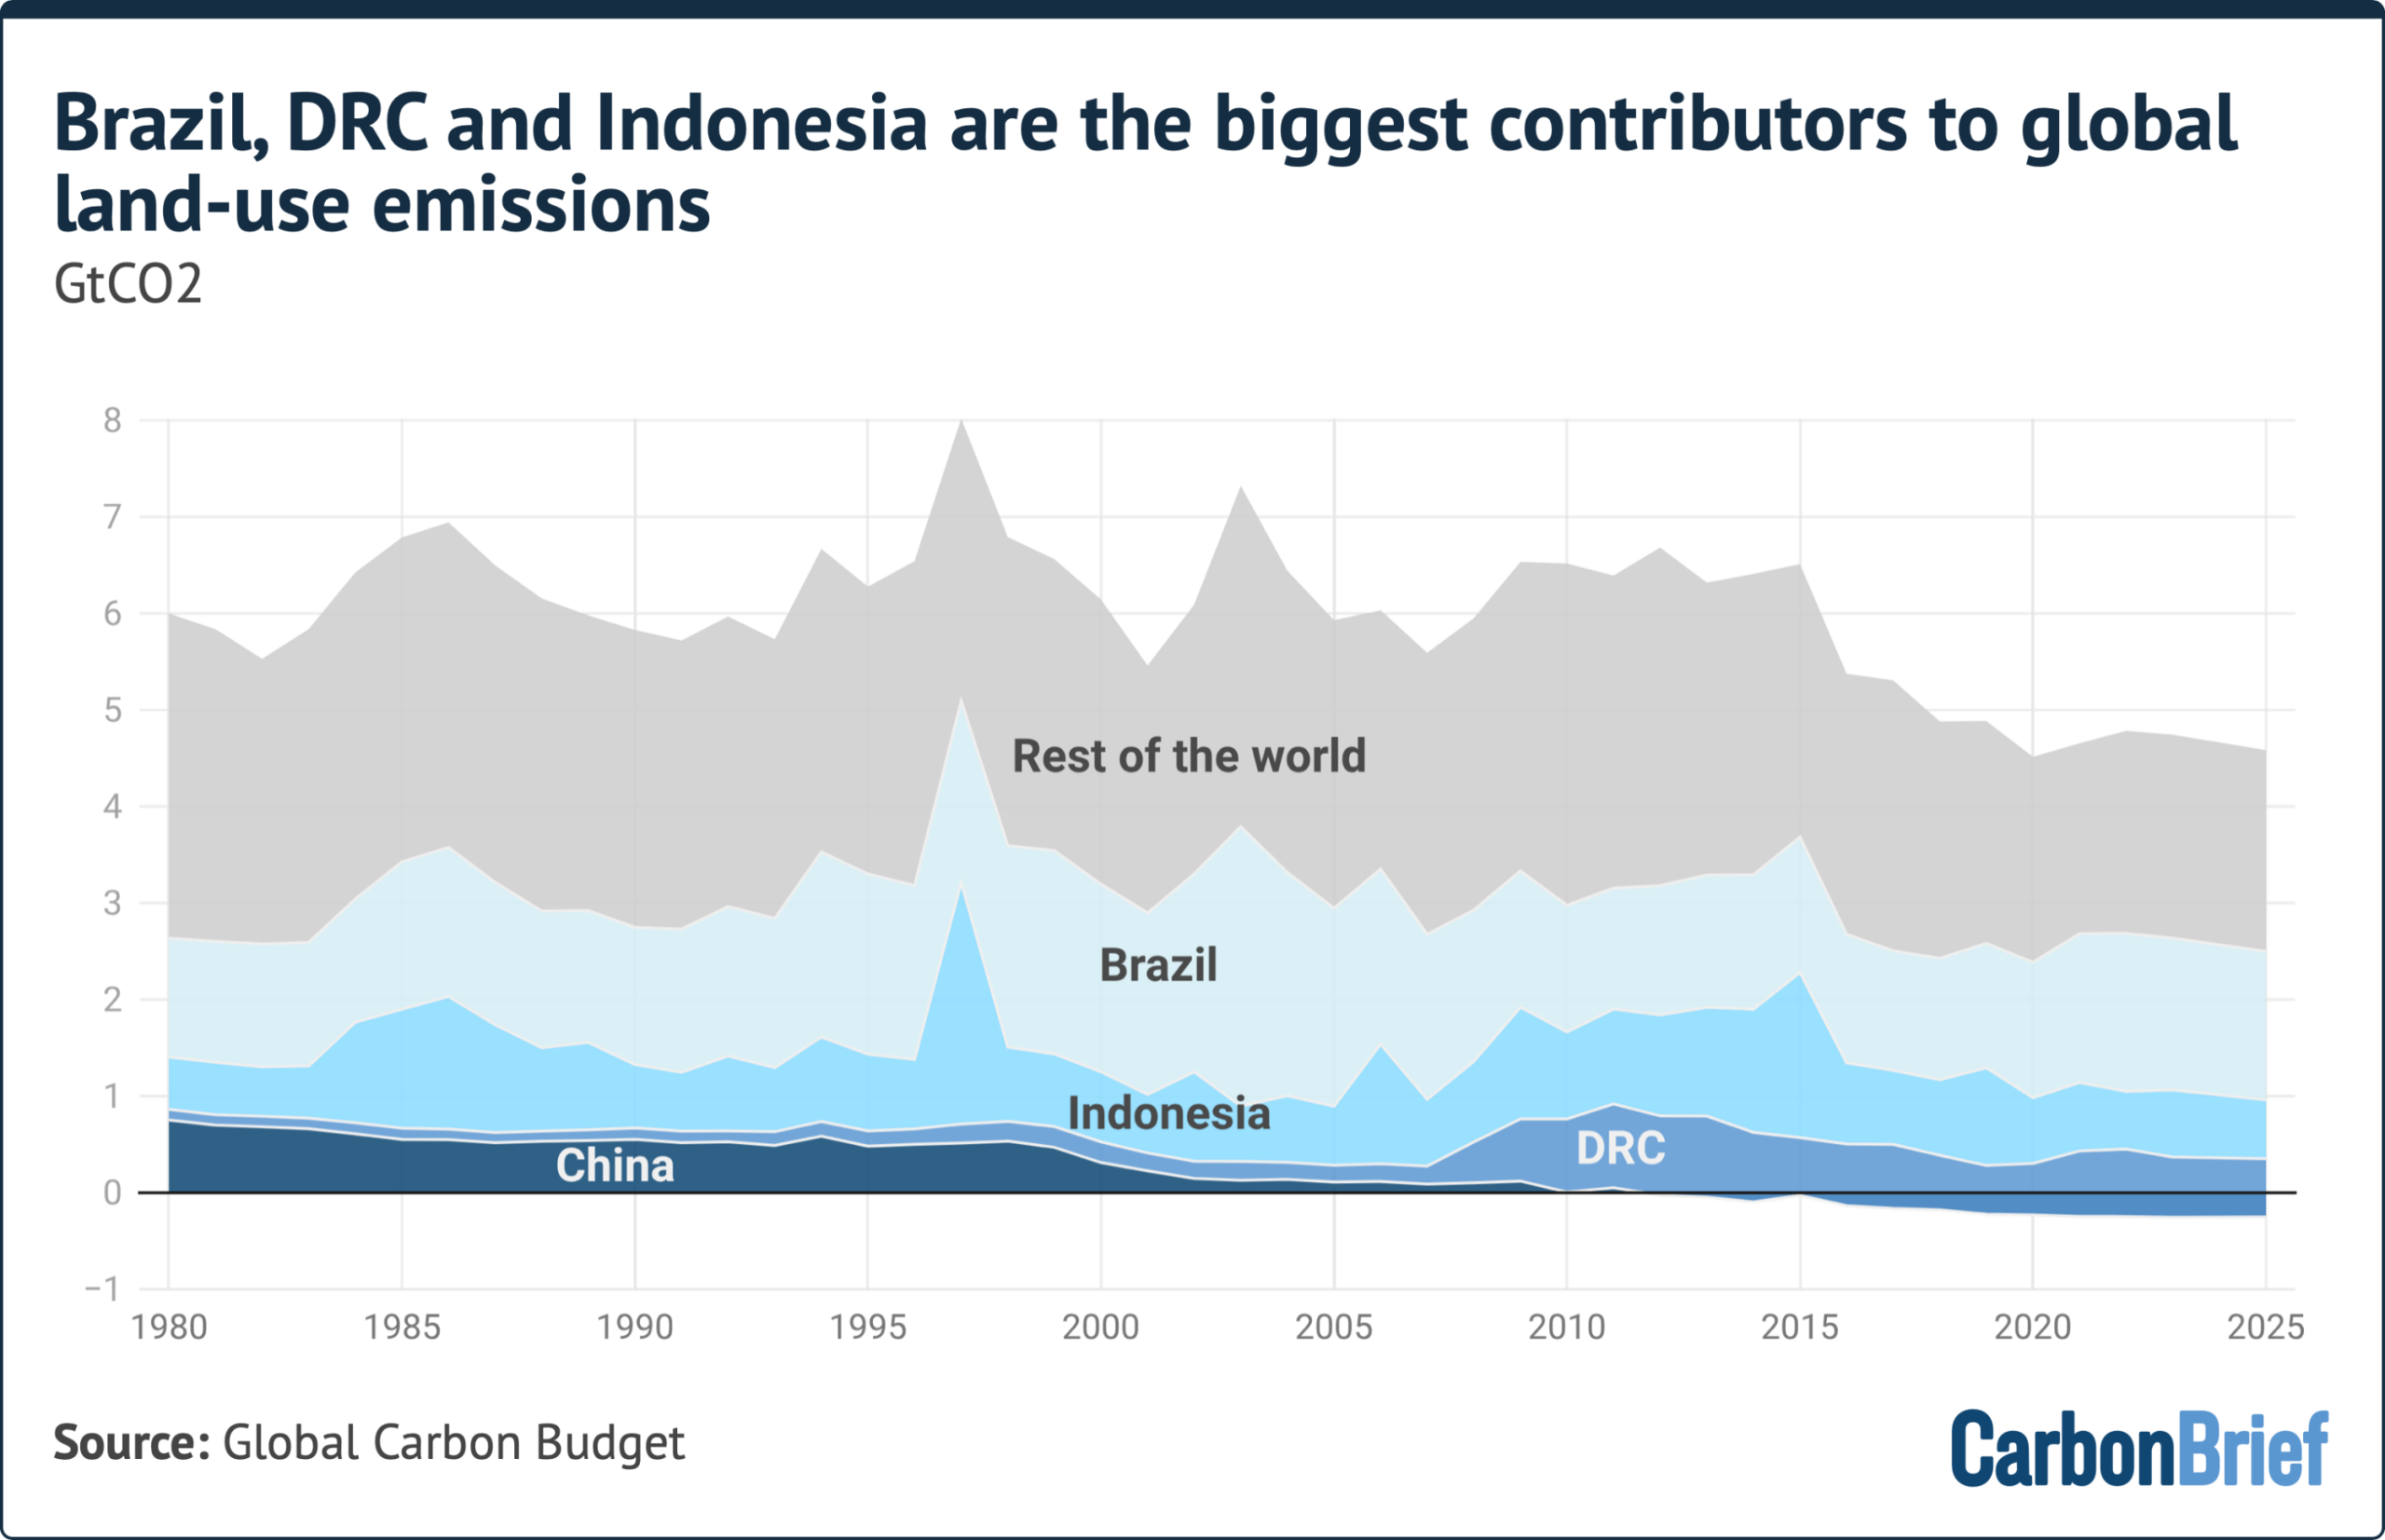
The countries that contributed the most to land-use emissions over 2015-24 were Brazil, the Democratic Republic of the Congo (DRC) and Indonesia, according to the Global Carbon Budget.
It notes that these three countries together contributed more than half – 57% – of global land-use emissions.
Over the first quarter of the 21st century, falling land-use emissions in Brazil and Indonesia have combined with increased afforestation and reforestation in China to drive down overall land-use emissions, according to the Global Carbon Budget.
This is illustrated in the chart below, which shows how China’s land-use emissions have dropped below zero, as Brazil and Indonesia’s emissions have declined.
Friedlingstein says that the decline in land-use emissions since the 2000s has been “primarily driven by a decline in deforestation in Brazil”.
He tells Carbon Brief that tree clearance in the South American country rose in the 1990s then started to fall after a peak in the 2000s:
“There was a bit of up and down – mainly due to politics and who was in charge in Brazil – [whether the president] was [Luiz Inácio] Lula [da Silva] or [Jair] Bolsonaro. But the long-term trend in Brazil is a decline in deforestation due to forest protection policies.”
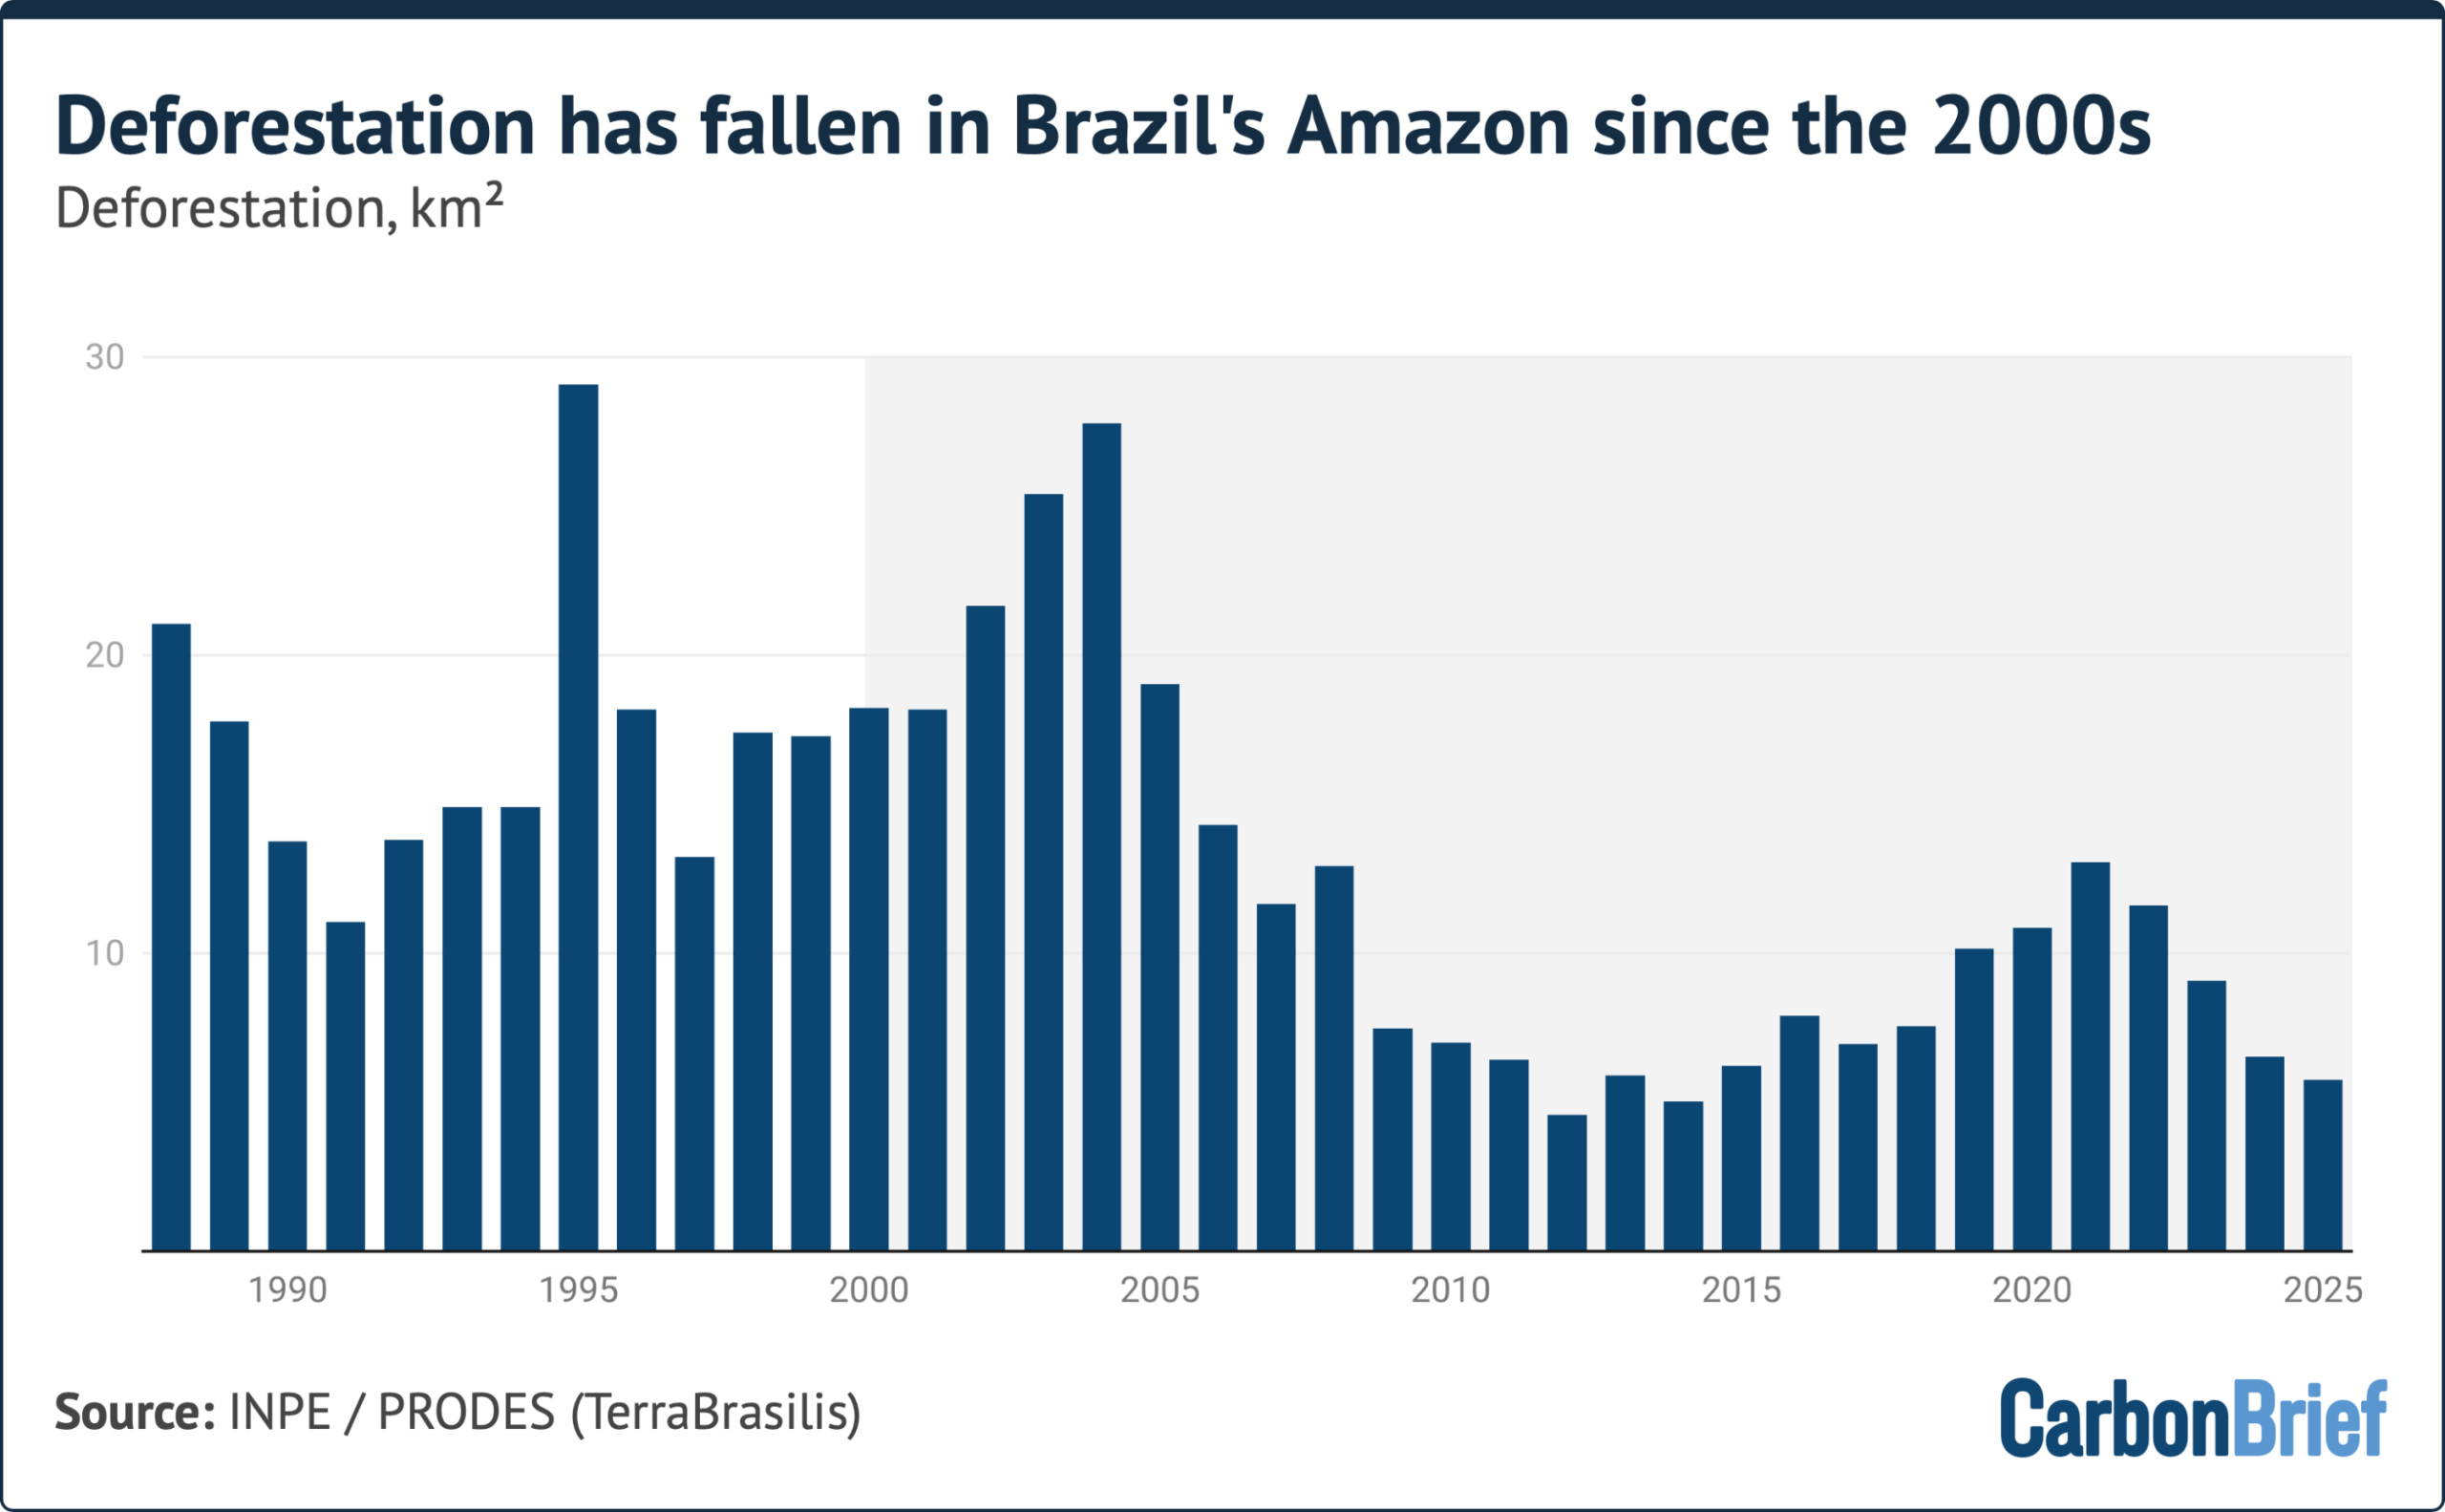
These policies included a 2004 “action plan” for the prevention and control of deforestation in the Amazon, a 2006 soy moratorium, which banned the purchasing and financing of soya produced in deforested areas of the Amazon, as well as the expansion of protected areas across Brazil during the second half of the 2000s.
Prof Julia Pongratz, a professor of physical geography and land-use systems at the University of Munich and contributor to the Global Carbon Budget, says Brazil is the “single most important contributor to the early-2000s global land-use change emissions peak and subsequent decline”.
She says that the largest contributor to an “acceleration” in the decline of global land-use emissions in the past decade has been Indonesia, which she notes has “rewetted more peatland area since 2017 alone than Europe in its entire history”.
Around the world, peatlands are exploited and damaged by humans for a range of purposes, including converting the land for agriculture and peat extraction for horticulture and fuel. Peatland wetting refers to the process of restoring water levels in drained peatlands in order to return them to their natural, waterlogged conditions, which allows for peat formation and carbon storage.
Another reason for Indonesia’s downward trend in land-use emissions is that there have been fewer spikes in emissions caused by fires related to human land-use activities over the last decade, says Pongratz.
Emissions from ecosystem fires are not always counted towards national and regional land-use emissions budgets, which estimate the sum of human-caused emissions. Deforestation fires and those related to peatland drainage are included, whereas fires caused by droughts and heatwaves are not.
Pongratz says it is “hard to separate natural and land-use drivers completely”, given that deforestation and peatland fires often “get out of control and cause spikes in emissions” during dry El Niño conditions.
(For more on uncertainties in land-use emissions data, see: Why are estimates of land-use emissions uncertain?)
Pongratz notes that international trade regulations that have helped to drive down land-use emissions in Brazil and Indonesia have had a lesser effect in the DRC, where the root drivers of deforestation are different:
“Emissions in the DRC have increased, then stayed high in the last two decades. This is partly related to population growth and expanding smallholder and subsistence farming.
“The picture is different in Brazil and Indonesia, which are much more driven by export; international regulations aiming at curbing deforestation thus have larger effects in these countries.”
Which countries are leading on forest regrowth?
Reforestation and afforestation schemes that draw down carbon from the atmosphere have helped to reduce the overall emissions from land-use change over the course of the 21st century.
As noted above, the 2025 Global Carbon Budget report highlights how the removal of carbon from forests offset two-thirds of deforestation emissions over 2015-24.
The report says that China, the EU and US account for the highest levels of carbon sequestration from reforestation and afforestation, collectively drawing 1.1GtCO2 per year over the 2015-24 period.
This, it says, is “partly related to expanding forest area as a consequence of the forest transition in the 19th and 20th centuries and subsequent regrowth of forest”.
The chart below, which draws from the latest edition of the “state of carbon dioxide removal” report, shows how carbon uptake by forests has increased over the last 20 years in a number of countries, most notably in China.
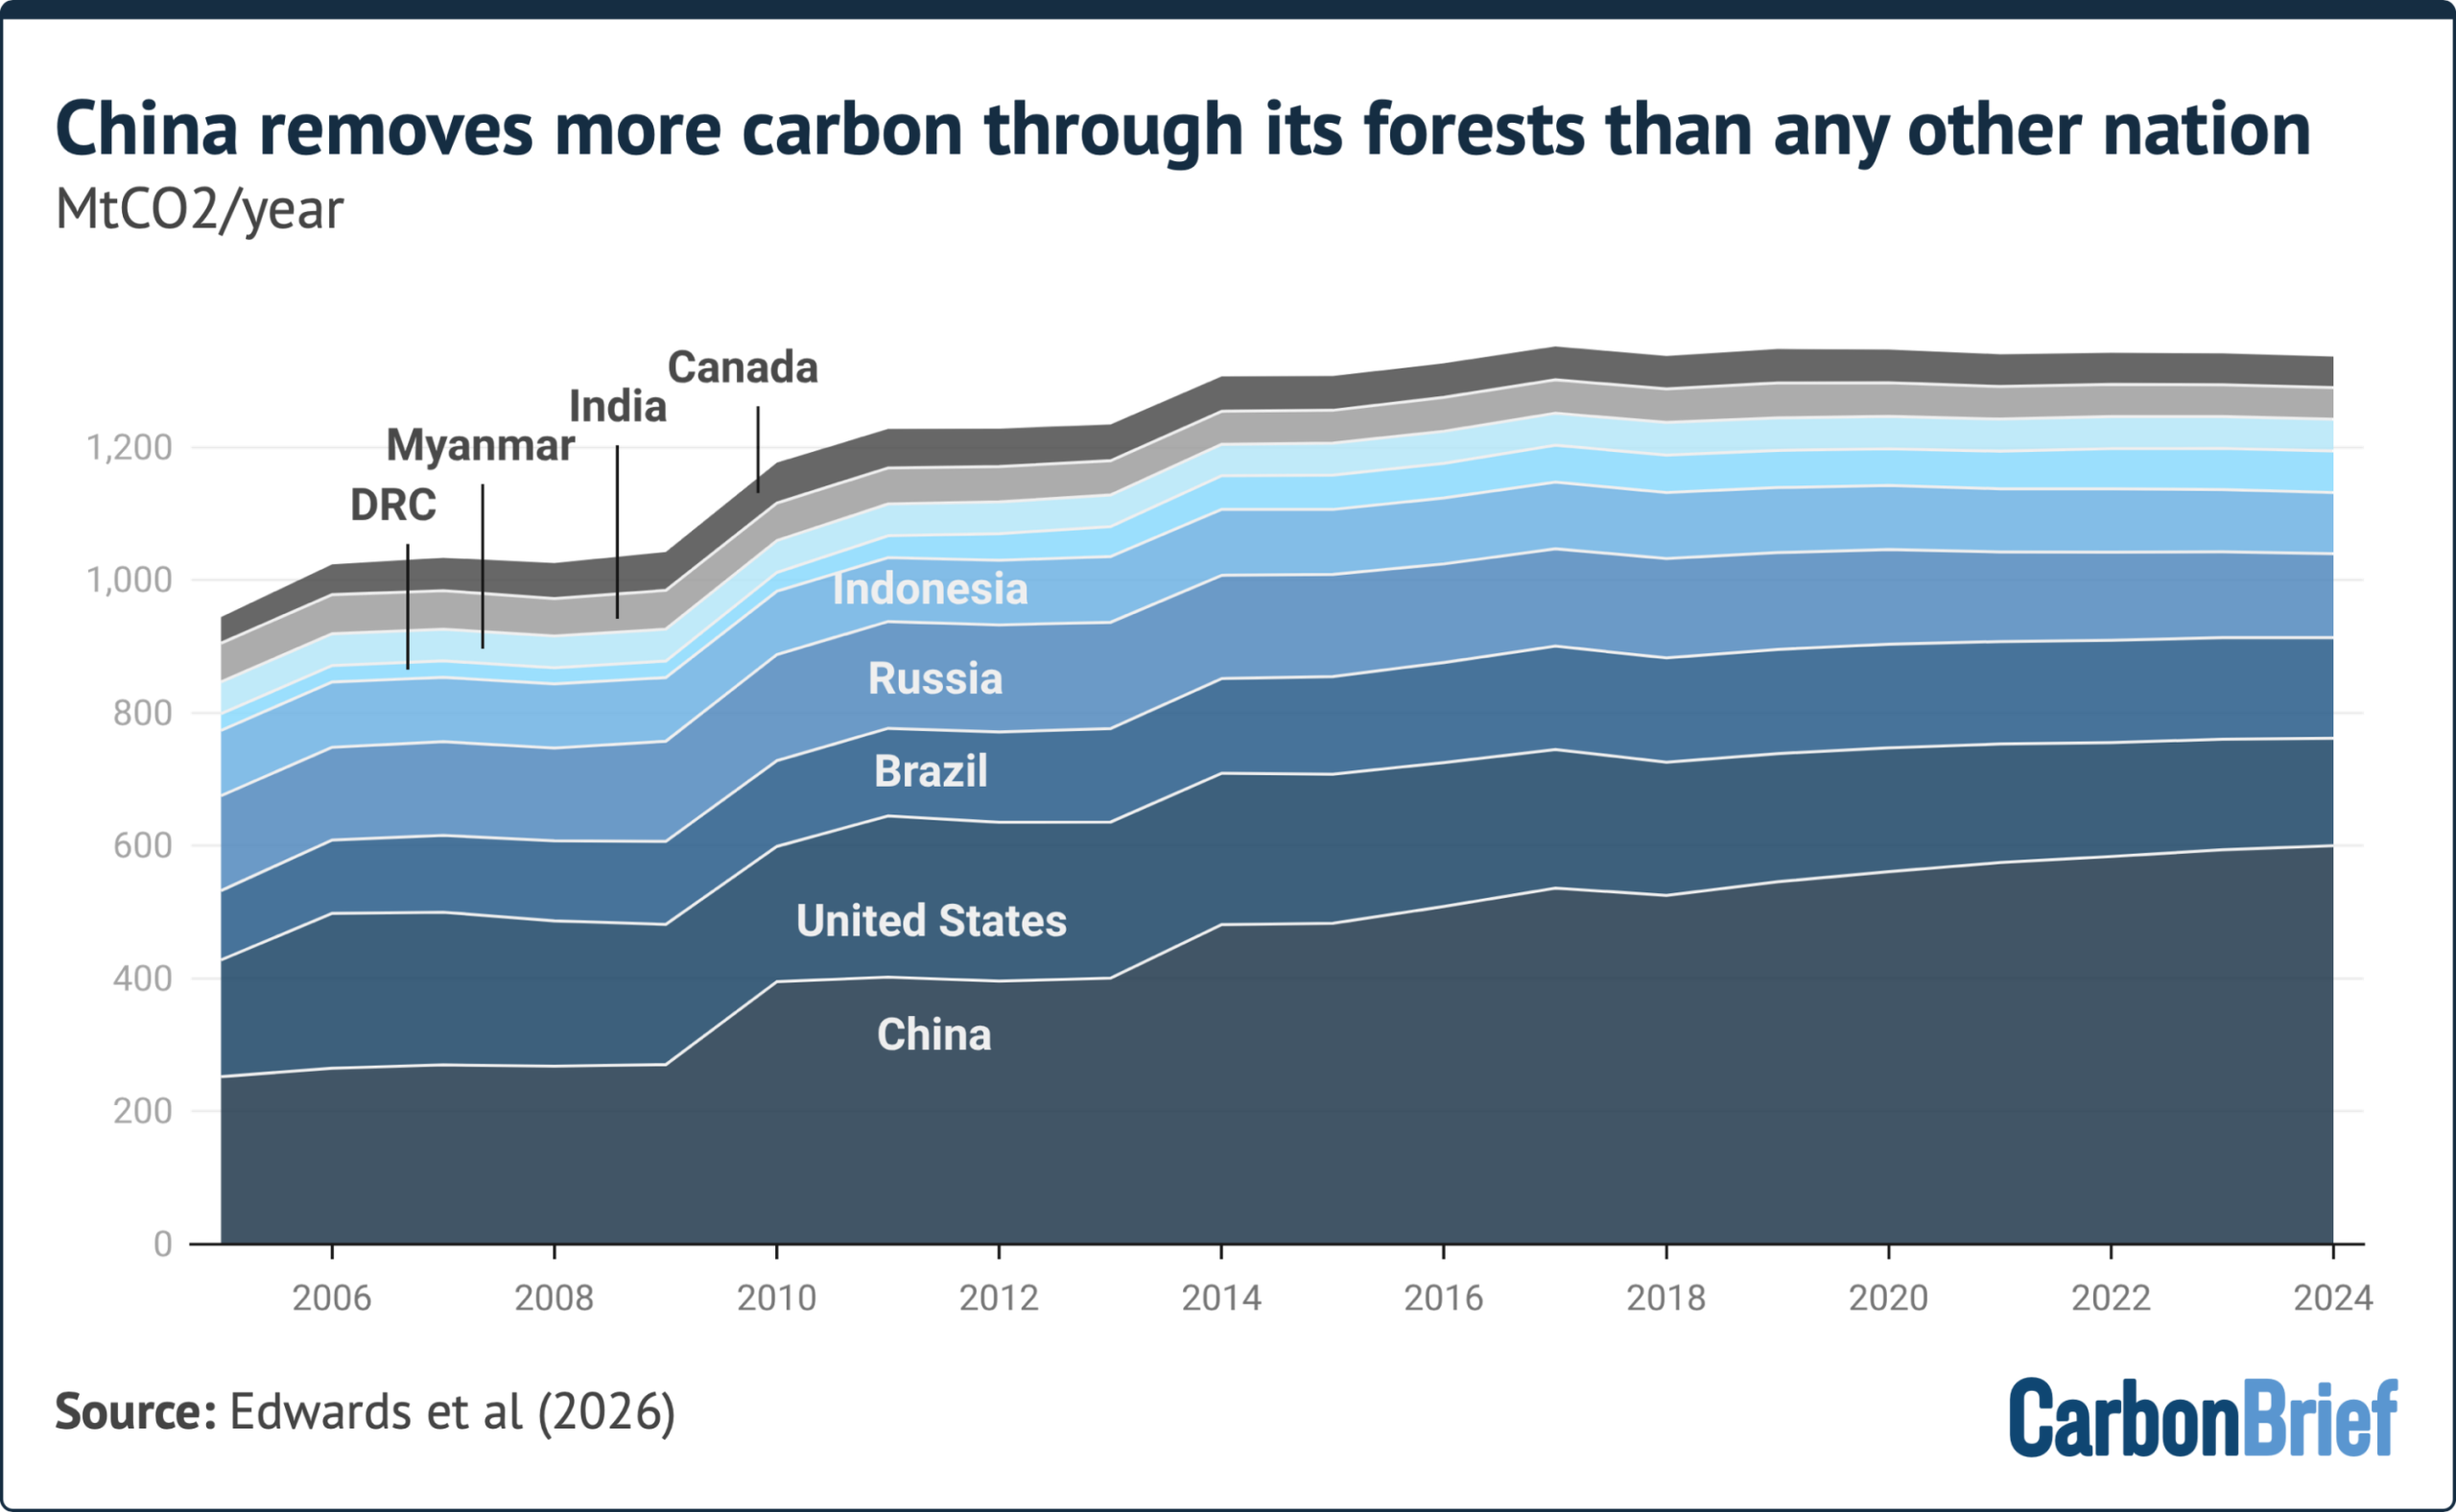
by country, 2005-24. Data from 3rd “state of carbon dioxide removal” report (2026). Chart by Carbon Brief.
In China, a raft of reforestation and improved land management policies were introduced in the 1990s which have led to the rehabilitation of tens of millions of hectares of forests. Research has shown the schemes have significantly increased the country’s uptake of carbon and switched its land from a carbon source to a carbon sink.
The Global Carbon Budget highlights that substantial carbon removal from reforestation and afforestation occurred in other regions, such as Brazil, Russia and Indonesia. However, in these regions, emissions from deforestation and other land-use changes “dominate”, it says.
Why are estimates of land-use emissions uncertain?
Tallying the world’s emission from land-use change is complex.
The Global Carbon Budget estimates an uncertainty range of 2.6GtCO2 per year for its average annual global land-use emissions figure for 2015-24 – more than half the overall figure of 5GtCO2.
To calculate overall land-use emissions for the annual Global Carbon Budget report, researchers create an average from three land-use models: BLUE, OSCAR and LUCE.
These models combine satellite and statistical information on land cover and land-use changes from global and regional datasets.
Pongratz, who is involved in the LUCE model, explains that scientists can measure the exchange of CO2 between land and atmosphere, but are not able to determine whether CO2 is being released or sequestered from a managed area as a result of human activities or other climate or environmental factors. She continues:
“For this, you need to turn to modelling, where you can isolate drivers – and, again, models are uncertain and the land-use input imperfect. This is why we use all available model estimates – three at the moment.”
The Global Carbon Budget highlights that its three different models treat different components of the land-use emissions “budget” differently.
While models agree “relatively well” about emissions from permanent deforestation, they take different approaches in their approach to shifting cultivation patterns, which increases both emissions and removals, as well as wood harvesting, it says.
Moreover, it notes that land-use emissions and removals occur on different timelines. While carbon removals generated by forest growth and soil recovery are “slow”, there is an “instantaneous component” to emissions from deforestation, it says.
(For more on the challenges in analysing changes to the global carbon cycle, see Carbon Brief’s recent in-depth interview with Prof Philippe Ciais, one of the world’s leading experts on land-use emissions.)
The Global Carbon Budget notes that its confidence in its 2025 projection for overall land-use emissions remains “low” given that the figure is based on deforestation, degradation and peat fire emissions, which are “only a proxy” for land-use change.
The report notes that 2023 is the final year in which it calculates land-use emissions directly from land-use statistics across all three bookkeeping models. For more recent years, full statistics are not yet available across the models and scientists instead turn to short-term proxies.
related
Factcheck: No, Europe is not having its ‘quietest’ year for wildfires

World falling short on 22 of 23 nature targets for 2030, says draft UN report

Analysis: 84% of nations miss deadline to identify ‘nature-harming’ subsidies by 2025

COP30: Could Brazil’s ‘Tropical Forest Forever’ fund help tackle climate change?
The post Why land-use emissions have fallen by a third this century – in six charts appeared first on Carbon Brief.
Why land-use emissions have fallen by a third this century – in six charts
Climate Change
Palestine: Israel’s bombing has left Gaza vulnerable to climate change
Israel’s bombardment of Gaza during the conflict that broke out in October 2023 has wrecked progress towards adapting the enclave to climate change and left two million Gazans vulnerable to heatwaves, drought and disease, the Palestinian Authority (PA) said in a new climate plan submitted to the United Nations.
Palestine’s third nationally determined contribution (NDC), uploaded to the UN climate body’s website this week, says that while “the aggression on the Gaza Strip did not make the climate worse”, “it removed the housing, water and sanitation systems, health facilities, energy networks, roads and livelihoods through which people absorb a climate they were already struggling with.”
The 91-page document lists the types of infrastructure it says Israel has destroyed and notes how the destruction will worsen the impacts of climate change. It says the bombing of hospitals and rising hunger have make it harder for Gazans to cope with the health impacts of climate-driven heatwaves and waterborne diseases.
The destruction of water tanks, boreholes and desalination plants, meanwhile, have left Gazans struggling with the effects of water shortages and drought, while mass unemployment reduces people’s ability to afford climate-driven price rises. The erasure of most of the Strip’s homes makes it more difficult for people to avoid the sun’s increasing heat, the NDC said.
Many Gazans are now living in the ruins of collapsed buildings or in makeshift shelters and tents that offer little or no protection from high temperatures.
Palestine’s previous goals to cut emissions and adapt to climate change in Gaza, expressed in its last NDC five years ago, were based on a pre-war baseline that “no longer describes anything that exists”, the NDC says. Progress made since 2021 has now been destroyed, it adds.
Green reconstruction of Gaza
Instead of continuing to aim for these adaptation and emissions-reduction goals, the PA is now calling for the green reconstruction of Gaza. It says buildings should be constructed again in an energy-efficient manner with solar panels and served with modern water, waste and transport systems.
While the PA, controlled by the Fatah political party, continues to claim legitimate control of Gaza, the strip was effectively governed by Fatah’s rival Hamas between 2007 and the recent war. Control is now split between Israel and the political wing of Islamist militant group Hamas, after a US-backed ceasefire took effect in October 2025, although a UN-backed committee plans to take over.
The United Nations, European Union and World Bank have jointly estimated that Gaza needs $71.4 billion of investment in the next two years to recover and build back. This process should be Palestinian-led, they said in April.
But US President Donald Trump has said the US should “take over” and “own” Gaza and redevelop it as the “Riviera of the Middle East”. Israel’s right-wing prime minister Benjamin Netanyahu has said that Israel should control the territory with civil administration managed by Palestinians favourable to Israel.
With occupation, targets conditional
In the other part of Palestine, the West Bank, the Palestinian Authority carries out some government functions, but ultimate control rests with Israel, which has occupied the West Bank since 1967.
Because Israel controls planning in most of the West Bank, the NDC argues that the PA cannot pursue all the climate projects it wants. In addition, Israel restricts the movement of PA officials, making data collection difficult, and controls the West Bank’s electricity supply meaning that the PA cannot control whether it comes from dirty or clean sources of energy.
Given this situation, the NDC says that all of Palestine’s new climate targets are conditional but it will aim to reduce emissions 12.8% below a business-as-usual baseline by 2035 and 17.1% by 2040. If the Israeli occupation ends and Palestine regains full sovereignty over its land and resources, it will aim for reductions of 15.1% and 19.1% by 2035 and 2040 respectively under an “independence pathway”.
That could allow, for example, for greater electrification and reducing emissions per unit of growth, the document said.
To achieve the 2035 emissions-reduction target and adapt to the impacts of climate change, the PA says it needs $8.6 billion in total. This funding would be spent on measures like encouraging solar farms and rooftop solar and scaling up solar water heating to cover four-fifths of households. To complement the planned increase in solar power, the authority wants to modernise the electricity grid and install battery storage.
In the transport sector, it aims to promote the uptake of electric vehicles, develop bus rapid transit corridors and scrap old polluting trucks and buses. In Gaza in particular, it wants to deploy 66 electric buses when the conflict ends.

To adapt to climate-driven drought, the NDC includes initiatives to reuse wastewater through treatment plants, build desalination plants in Gaza to remove salt from seawater, and promote irrigation for farmers.
The new climate plan was prepared by Palestine’s Environment Quality Authority, with support from the United Nations Development Programme and the governments of Britain and Spain.
The United Nations recognised Palestine’s statehood in 2012 and it joined the UN’s climate convention and signed the Paris climate agreement – which requires countries to submit more ambitious NDCs every five years – in 2016.
The Israeli foreign ministry did not respond to a request for comment. But in late 2024, then Israeli climate envoy Gideon Behar told Climate Home News that the war and the resulting environmental destruction in Gaza was the fault of Hamas.
The post Palestine: Israel’s bombing has left Gaza vulnerable to climate change appeared first on Climate Home News.
Palestine: Israel’s bombing has left Gaza vulnerable to climate change
Climate Change
Analysis: UK solar power hits record high over summer 2026
Solar power generation in the UK reached a new record over the summer of 2026, as temperatures across the nation soared, according to new analysis by Carbon Brief.
Collectively over June, July and August, solar farms and rooftops generated 8.8 terawatt-hours (TWh) of electricity in the UK*, as shown in the chart below.

Speaking to Carbon Brief, Chris Hewett, chief executive of trade association Solar Energy UK welcomed the new record, adding that it was driven by “clear skies and continued growth in deployment”.
This surge in generation took place amid the hottest summer on record in the UK, with five heatwaves between May and August.
Summer 2026 was the sixth sunniest on record, with more than 620 hours of sunshine, according to the Met Office. England and Wales – which experienced the most extreme heat – saw their second-sunniest summers on record.
June 2026 was the hottest June in England since records began in 1884, according to Met Office data, while Wales and the UK as a whole experienced their second-warmest June.
It was the driest July for England and Wales since records began in 1836, with some parts of London seeing no rain at all in the month, while Wisley in Surrey had no rain for 62 days.
In England, temperatures peaked at 38.1C at Kew Gardens in London on 13 August.
According to the Met Office, this summer’s record mean temperature was made 130 times more likely by climate change.
Amid these hot and sunny months, solar power generation increased 23% from the same period in 2025. This is double the level of solar generation over the summer of 2021, according to Carbon Brief analysis.
While solar panels can be affected by periods of extreme heat, the longer hours of daylight and higher levels of irradiation over the summer more than offset any efficiency losses.
June, July and August all saw solar set new monthly records for solar generation – July saw the highest solar generation in a calendar month ever, with 3.3TWh meeting 15% of overall electricity demand for the month.
As of the end of August, the total UK solar generation in 2026 stood at 17TWh – 13% higher than the same point in 2025.
The number of solar farms and rooftop installations has grown substantially in recent years, helping to boost generation. Domestic rooftop solar accounts for around 29% of total capacity.
In 2025, the UK’s solar capacity reached 21 gigawatts (GW) by the third quarter of the year, according to UK government figures. This is a jump of 3GW, or 18%, year-on-year, as Carbon Brief reported in January.
(Capacity is the maximum output possible from an electricity generation, whereas generation is what was produced over a certain time period, such as a day, month or year.)
According to the University of Sheffield, the installed solar capacity is now nearly 24GW.
This includes nearly 172,000 solar installations that have been fitted across the UK since the start of 2026, according to recent government figures. In July alone, more than 19,800 rooftop solar panels were installed – the equivalent of one installation every two minutes.
In total, nearly 1.7m households in the UK now have solar panels installed.
Over 26 heatwave days this summer – periods of at least three days when temperatures exceed the Met Office’s county-level heatwave temperature threshold – UK households with rooftop solar panels avoided an estimated £86.7m in electricity costs, according to analysis by Utility Bidder.
Talking about the surge in solar generation this summer, Hewett says:
“[It] not only kept bills down for people with solar and batteries in their homes, but helped keep overall power prices much lower than they would have been if Britain had been relying on more gas generation during the day”.
Despite the record generation, no new half-hourly solar power output record was set in the summer of 2026. This still stands at 15.2 megawatts (MW) on 23 April 2026.
* This article refers to the UK throughout, but strictly relates to the island of Great Britain, made up of England, Scotland and Wales. Northern Ireland is part of the separate, all-Ireland electricity system.
related
Factcheck: 10 flaws in the Conservative report on ‘cheap power’
Q&A: What is ‘long-duration energy storage’ – and why does the UK need it?
Q&A: What does China’s 15th ‘five-year plan’ for renewables mean for climate change?
Analysis: Wind and solar power overtake fossil fuels in Germany for first time ever
The post Analysis: UK solar power hits record high over summer 2026 appeared first on Carbon Brief.
Climate Change
How this summer’s heat and drought impacted crops in Europe – in six charts
Farmers around Europe are dealing with the aftermath of a summer of extreme heat, drought and wildfires that were exacerbated by climate change.
Human-caused climate change is increasing the severity and likelihood of many extreme weather events around the world, which is increasing volatility for food producers.
This summer resulted in, for example, shrunken potatoes in the Netherlands, reduced carrot harvests in France, dried-up rice fields in Italy and scorched olive groves in parts of the Mediterranean region.
Global food prices are currently at their highest level since early 2023 due to “heatwaves and energy price dynamics”, according to the UN Food and Agriculture Organization.
Other factors such as blocked fertiliser supplies in the Strait of Hormuz and high fuel costs have also played a role in this year’s agricultural outputs.
In the six charts below, Carbon Brief provides a snapshot of the impact this summer’s extremes are considered to have had on crop production and yields across Europe.
1. Most EU countries expect to see declines in cereal production this year
2. Most countries are recording reduced crop yields
3. Around €2bn worth of cereal losses after June heatwave
4. UK yields of wheat, barley and oats are all due to drop in 2026
5. Maize production in France is due to hit a four-decade low
1. Most EU countries expect to see declines in cereal production this year

France, in particular, will see heavy losses in the amount of cereals – such as wheat, barley and oats – it produces this year, according to European Commission data.
French cereal production is expected to drop by almost 8 megatonnes (Mt) in 2026, compared to 2025.
The chart above shows that most European countries, aside from Bulgaria, will also see production losses this year.
Germany is due to see the second-largest losses in production, dropping by almost 4Mt compared to 2025.
Prof Til Feike, a cropping systems expert at the Julius Kühn-Institut, says many areas in Germany and Austria, as with other parts of Europe, have been “hit hard by a long-lasting dry period in combination with record-high heatwaves”.
This has resulted in dry grassland for animals and lower yields of maize, which is a “key fodder crop” for livestock. He tells Carbon Brief:
“In the long run, farming must adapt better to more extreme weather conditions, not only heat and drought, but also prolonged wet periods. So, there is no one-fits-all solution for climate change adaptation.”
2. Most countries are recording reduced crop yields
Heat and a lack of water have “substantially worsened” crop expectations this summer in western and most of central Europe, according to a recent bulletin from the EU Joint Research Centre.
Yields are expected to be “significantly reduced”, with local crop failures “likely” in areas such as France, southern Germany, northern and central Italy, and Hungary, it added.
The chart below shows that yields of cereal grains – which, here, refers to the tonnes of a grain grown per hectare of land – are expected to fall in most EU countries in 2026.

Slovakia, Austria and Hungary are expected to see the largest declines in cereal yields, reducing by more than one tonne per hectare in 2026 compared to 2025.
The recent EU bulletin noted that irrigated crops performed well in Portugal this summer – the country with the largest yield increases. Other crops relying on rainfall showed growing signs of heat stress, it added.
3. Around €2bn worth of cereal losses after June heatwave
The record heatwave that hit many parts of Europe in June contributed to an estimated €2-2.3bn in cumulative grain production losses, as shown in the chart below.

The intense June heat in western Europe would have been “virtually impossible” just 50 years ago, according to a rapid climate attribution study. It was the region’s hottest June on record.
The Energy & Climate Intelligence Unit (ECIU) thinktank analysed June and July 2026 grain forecasts from Coceral, a European grain traders association.
ECIU estimated lost supply by multiplying the change in tonnes of grains between these two months by prices for harvest delivery in 28 European countries.
Major grain producers France, Germany, Hungary and Spain accounted for 86% of the lost revenue, according to the ECIU.
Extreme heat is also expected to have a wider economic impact across the continent. Analysis from Triodos Bank found that this summer’s extreme weather could reduce the EU’s gross domestic product (GDP) by around 1% this year, or around €180bn.
4. UK yields of wheat, barley and oats are all due to drop in 2026
If current trends continue, the average yields for cereals and oilseeds will result in the UK’s worst harvest since detailed records began in 1984, according to ECIU.

Barley yields could fall by 15%, oats by 14% and wheat yields by 6% year-on-year, according to 2026 harvest surveys from the Agriculture and Horticulture Development Board, a non-departmental public body that provides agricultural data to the UK government.
ECIU said that, even if the situation improves, this year is still expected to be one of the five worst harvests on record. This means that four of the five worst harvests in the UK have occurred in the past decade.
Consumers will likely see higher prices and/or smaller vegetables in supermarkets as a result, Tim O’Malley, chairman of UK company Nationwide Produce, told BBC News in August.
Other crops, such as berries, have grown successfully in the extreme heat. But the Guardian noted fears this could dip later this year “as plants become exhausted from heavy cropping during the heatwave”.
5. Maize production in France is due to hit a four-decade low
France has been acutely affected by this summer’s extreme weather, with more than 7,300 excess deaths during heatwaves and a record number of weather stations recording temperatures of above 40C.
The country is the EU’s largest agricultural producer, but heat, drought and wildfires have affected many crops.
The chart below shows that maize production is set to drop by more than one-third (35%) year-on-year.

This could result in France’s lowest maize production since 1980, according to data from Agreste, the country’s agriculture ministry’s statistics service.
Due to the heat, “record-early” grape harvests have also been recorded in various parts of the nation since mid-July, reported Le Monde. In some cases, this means “smaller, less juicy grapes, which will yield less wine”, explained the newspaper.
6. Declines in EU grains since 2025

Overall in the EU, data and projections indicate declines in the output of cereal grains this year.
Cereal production is set to fall by 9% compared to 2025, according to the European Commission.
Just one year in the past decade – 2024 – recorded lower production levels.
Maize production is set to be particularly affected, with projections indicating a 13% drop, to 52Mt – the lowest level in the EU since 2007.
The post How this summer’s heat and drought impacted crops in Europe – in six charts appeared first on Carbon Brief.
How this summer’s heat and drought impacted crops in Europe – in six charts
-
Climate Change1 year ago
Guest post: Why China is still building new coal – and when it might stop
-
Greenhouse Gases2 years ago嘉宾来稿:满足中国增长的用电需求 光伏加储能“比新建煤电更实惠”
-
Greenhouse Gases1 year ago
Guest post: Why China is still building new coal – and when it might stop
-
Climate Change2 years ago嘉宾来稿:满足中国增长的用电需求 光伏加储能“比新建煤电更实惠”
-
Climate Change2 years ago
Bill Discounting Climate Change in Florida’s Energy Policy Awaits DeSantis’ Approval
-
Renewable Energy11 months agoSending Progressive Philanthropist George Soros to Prison?
-
Greenhouse Gases1 year ago
嘉宾来稿:探究火山喷发如何影响气候预测
-
Carbon Footprint2 years agoUS SEC’s Climate Disclosure Rules Spur Renewed Interest in Carbon Credits


