

This concludes my three-part post. Part I, “Beginning,” began with the Three Mile Island accident and covered the decline of nuclear dread, the advent of fabulously reliable reactor operation, and nuclear power’s climate-hero status; it’s available here. Part II, “Centerpiece,” covered the failure of carbon tax advocacy, the closure of Indian Point, and the dissolution of my dream that renewable energy could do it all; it’s available here. This part takes antinuclear activism to task for turning a blind eye to the far more lethal harms from unrestrained automobility, and then turns to the need to redefine “least-cost” decision rules guiding electricity investment. — C.K.
7. A More-Brutal Bête Noire
On a different, but as I’ll show, related topic: I had known for some time that deaths from being struck by a motorist were shockingly common in the U.S., with 300 a year in New York City alone. I had made that fact a central element in defending bicycling against the moral panic over ― of all things ― New York’s industrious bicycle couriers during the pre-digital 1980s. And as a bicycle commuter I had long jousted with drivers. But the death of oncologist Dr. Jie Zhang in 1994 forced me to consider driver-caused traffic violence as an assault on both public health and the moral order.
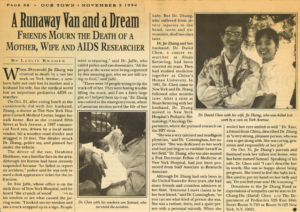
The horrific death in 1994 of physician and expectant mother Jie Zhang called into question antinuclear dogma that prioritized hypothetical reactor accidents over lethal dangers like unrestrained automobility.
A speeding driver hit and killed Dr. Jie outside Memorial Sloan Kettering Cancer Center on Manhattan’s East Side. She was nine months pregnant. As she lay dying, her colleagues at the hospital delivered her son, who survived. The newspaper ran a photo of the newborn in his father’s arms. My wife and our week-old son were safe at home. My good fortune was hard to bear.
What were the hazards of nuclear power, next to those of motorized traffic? There was and is no agreed-upon damage ratio between the two technologies. But in my eyes, the anti-nukers’ derogatory depictions of U.S. nuclear regulators seemed better suited to officials in charge of “auto safety.” In 2009, for example, after a spate of deaths in SUV rollovers, the National Highway Traffic Safety Administration required that roofs on new vehicles be able to support three times their already swollen weight. That rule led to wider windshield-obstructing structural posts , badly expanding SUV drivers’ blind spots. The result, according to a recent New York Times report, was a tidal wave of crashes that killed hundreds of pedestrians and cyclists and injured thousands more.
As a young attorney in the 1960s, Ralph Nader rocketed to fame by documenting how regulatory capture made cars excessively dangerous. His subsequent pivot to opposing nuclear power initially made sense but, over time, inadvertently left American pedestrians, cyclists, and occupants of smaller vehicles vulnerable not just to “vehicle bloat” but driver distractions and the “windshield perspective” of police, prosecutors and juries.
All the while, anti-nuclear activists keep pounding their drum, willfully ignoring U.S. reactors’ splendid post-seventies safety record (see Sections 1 & 2). With few domestic miscues to flog, they leaned instead into the faraway disasters at Chernobyl (1986) and Fukushima (2011). Those disasters were real enough, but they differed from the U.S. situation not just in location but also in root cause. Soviet and Japanese officials had downplayed reactor risks, while the U.S. nuclear enterprise had built a culture dedicated to containing them.
Even reactor radioactivity, like reactor accidents, is becoming another non-barking dog. We are half-a-century into the age of large-scale deployment of nuclear power, and not a single large-scale study has emerged that credibly pins increased morbidity and/or mortality on nuclear power plant operation. Moreover, the old Rubik’s Cube problem of nuclear waste disposal is yielding to engineered solutions. The hangup was never technical. It was political.
8. By All Means, Decarbonize
For half-a-century, nuclear power and renewable energy have circled each other like wary prizefighters.
The two weren’t simply antithetical, they were incompatible — logistically as well as culturally. One couldn’t be for both; you had to pick a side. That was the gospel of physicist Amory Lovins, whose revolutionary 1976 article in Foreign Affairs magazine, “Energy Strategy: The Road Not Taken,” upended energy policy debates and galvanized the antinuclear power movement.[12]
In Lovins’ influential framing, nukes epitomized “hard” energy — lumbering and brittle. Renewables — wind and solar — were “soft” — home-grown and “right-sized.” (This was before the relentless push for engineering efficiencies turned wind turbines into colossi and blanketed entire fields with solar panels.)
Fifty years on, the climate crisis has entered the ring and demanded that the rivals partner up. The choice now is carbon-burning vs. carbon-free. Further, the perilous timeline of the crisis has toppled another dictum, also traceable to Lovins: that the transition from fossil fuels must proceed under a “least-cost-first” hierarchy that turns to costlier energy sources only after first exhausting all of the less-expensive ones.
Once, that logic was persuasive. In a leisurely, decades-long transition, why not have the lowest-cost energy lead the way? Wherever a home solar array or a Great Plains wind farm could turn a profit, the thousand busy ants of capitalism could be trusted to deploy them. The climate-warping curve would bend, steadily, painlessly, bringing a more flexible and benign energy system into the bargain.
That was the idea. The reality is falling far short, as revealed by the stubborn persistence of U.S. carbon emissions.[13] The manifold causes have been touched on here; they include everything from traditional NIMBYism to viral versions built on conspiracy-mongering, along with supersized pickups, “sport utes” and the absence of robust carbon emissions pricing. The shale revolution and two Trump presidencies did their part as well, keeping fossil fuels cheap (until No. 47 made war on Iran), which added to the stock of carbon in the atmosphere and America’s stock of carbon-consuming cities and towns, farms and roadways.
In World Cup parlance, we’ve entered stoppage time. A new rule applies: nuclear power ― or any other fossil-fuel antidote ― need not pencil out as cheaper than solar or wind to merit a part in decarbonizing U.S. grids. Instead, we should pursue any energy source or energy-saving measure that displaces fossil fuel use at lesser cost than the harm caused by burning those fuels in the first place.
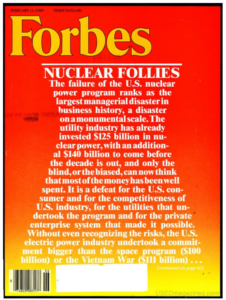
Feb. 11, 1985 cover.
Think of it like the hikers’ joke about the bear: I don’t need to outrun the bear, I just need to outrun you. In the same way, new nuclear plants don’t need to be cheaper per kilowatt-hour than solar or wind. Their electricity just needs to cost less than the added climate damage that would result from burning the fossil fuels that would otherwise fill the gap. And on that test, new nuclear power plants appear likely to succeed.
Let’s break that down.
What will new U.S. reactors cost to build?
This year I applied my statistical skills and power plant knowledge to the 49 most recently built U.S. reactors. Forty-seven of them limped to completion in the dozen years following Three Mile Island. At the time, their swollen costs so ravaged U.S. electric utilities that Forbes magazine termed the U.S. nuclear power program “the largest managerial disaster in business history.”
Nevertheless, my analysis of that cost data points to a path forward. I found that even if future reactor costs track past costs, a program that builds two or more reactors at each site and uses standardized designs will allow new plants to be built for an average cost of $8,200 per kilowatt of capacity, in 2025 dollars. At that price, building and running new reactors is almost certainly a lower-cost proposition than facing the ecological and human damage from burning equivalent fossil fuels.[14]
If anything, my figure is on the pessimistic side, since it bakes in the kind of shifting regulatory requirements that drove up costs so much in the post-TMI period. Even so, it comes to just half of what it cost to build the final two reactors — Georgia Power new Vogtle 3 and 4 units ― a project that nuclear power critics dredge up at every opportunity as proof that any new U.S. nuclear plant is doomed to be uneconomical.
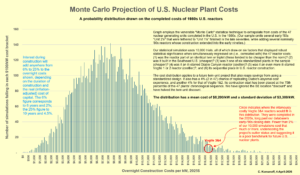
An alternative visualization of this chart appears as Fig. 9 in “Beyond Vogtle.”
Just as important, the odds of future extreme overruns appear low. Using a probabilistic model, I found that the likelihood that a new twin-unit plant, built to a standardized design, will end up costing as much as Vogtle is slim ― the same odds, around 1.7%, as correctly calling six coin flips in a row.[15]
Will the long time to build new reactors undo their climate benefit?
Past nuclear plants seemed to take forever to finish. The 47 reactors whose costs I analyzed averaged nearly 12 years from initiation to completion ― a 50 percent worsening from their 1970s counterparts. Much of that added time traces back to Three Mile Island, which triggered design changes, equipment upgrades, and staffing shifts across the entire U.S. nuclear sector, each adding delays. Slowing demand for power also led some utilities to stretch out construction schedules on their own.
To nuclear power’s critics, these setbacks come with the territory. But reactors aren’t the only major infrastructure projects facing long timelines. Delays in building wind farms, transmission lines, and other accoutrements of renewable energy have prompted plenty of national hand-wringing too. Even balcony solar ― the latest face of decarbonization ― will need time to scale up. Electrical codes and fire regulations must be rewritten, and then the real challenge begins: installing roughly 25 million of these devices (at 220W each) to match the climate benefit of a single 1,000-megawatt reactor.
There’s also a déjà vu tinge to the complaint that nuclear power is too slow to help with the climate crisis. That argument easily predates Vogtle 3 and 4 ― the massive Georgia project that tested residents’ patience and wallets, but is now helping decarbonize Atlanta and hundreds of other cities. The goal isn’t to repeat Vogtle’s egregiously high cost, which doesn’t yet clear the bar set by the social cost of carbon. It’s to treat the climate fight as an ongoing effort to reduce harm by whatever effective means are available.
Balcony solar and giant nukes aren’t rivals ― they’re partners. Building Vogtle didn’t stop Georgians from putting solar panels on their roofs in 2015, and if balcony solar really is the money-saving no-brainer its supporters claim, there’s no reason it shouldn’t help rate-burdened Georgia families in 2027, too. “All hands on deck” is a cliché, but it fits here. The world has no time to wait ― it needs to decarbonize by every means available. Including nuclear power.
[12] Lovins’ Foreign Affairs article is available here. I recounted its momentous impact on energy policy and public discourse for The Electricity Journal in 10 Blows That Stopped Nuclear Power (Jan/Feb 1991).
[13] U.S. CO2 emissions circa averaged only 1 to 2 percent annual reductions over the period 2010-2025, a rate many times slower than needed to meaningfully address the climate crisis.
[14] See Komanoff & Boucher, “Beyond Vogtle,” op. cit., pp. 41-44.
[15] The chance of correctly calling six coin-tosses in a row is one-half raised to the sixth power, which is 1 in 64, or 1.56%, which more or less matches the 1.7% chance that a new nuclear plant will cost as much as or more than Vogtle 3 and 4. See Komanoff & Boucher, op. cit., Fig. 9.


Carbon credit providers vs marketplaces is the first comparison many buyers try to make. In this comparison, a carbon credit provider is the project developer: the company that originates credits from its own projects and sells them directly. A carbon credit marketplace is a platform that lists credits from many projects at published prices.

Carbon Footprint
Democrats who call climate change an emergency should not defend a permitting system too slow to build the clean energy that would address it.”
Democrats, Take The Deal. New York Times editorial, Nov. 12.
Insetting program design starts with your supplier map. The carbon claim comes much later.
Consider a coffee procurement team that funds a farm intervention before checking its sourcing data. The supplier aggregates coffee lots from several regions. The buyer lacks farm-level traceability. Another purchaser expects to report the same outcome. A more attractive project brochure solves none of these problems.
If the distinction between a value-chain intervention and a purchased credit is still open, read CCC’s Insetting vs Offsetting guide before you set the brief.
Insetting program design begins with the purchasing relationship and works outward. You need to decide 1) where an intervention belongs, 2) what business problem it addresses, 3) who pays for it, 4) how results will be measured, and 5) what the evidence will let you say about them. This five-step playbook turns that sequence into a procurement plan.
Step 1: Insetting program design starts with supplier mapping
Start with the commodities that matter most to your Scope 3 inventory and sourcing continuity. Ask finance for spend by supplier, sustainability for the emissions baseline, and category managers for origin and volume records. Then identify which suppliers can trace material to a jurisdiction, sourcing region, producer group, or individual land-management unit.
The level of traceability affects what you can account for. Under the GHG Protocol Land Sector and Removals Standard, the spatial boundary for purchased land-based products depends on the traceability associated with each volume. Farm-specific factors or removals require physical traceability through an acceptable chain-of-custody model. A contract with a tier-one trader, by itself, does not establish a link to the farms behind its deliveries.[1]
Build a first-pass table with five columns: commodity and annual volume; supplier and origin; current traceability level; land-use and production risks; and the business owner who can change the purchasing terms. Mark missing data plainly. A blank cell is cheaper to fix before a program starts than after a claim is drafted.
If your company sets an SBTi Forest, Land and Agriculture target (FLAG), keep its land-related target boundary separate from energy and industry emissions. The current FLAG guidance also requires relevant companies to assess primary deforestation-linked commodities in their value chains.[2]
Step 2: Choose a commodity and jurisdiction for a pilot
Select one supply corridor where the sourcing connection can be established and procurement has a reason to stay. A useful pilot has repeat purchases, suppliers willing to share records, an intervention matched to a diagnosed problem, and a defined plan to measure the result. Carbon potential alone is a poor selection rule if the supplier cannot deliver the crop your business needs.
Compare candidate regions on land-use risk, supplier concentration, local rights and tenure, the availability of baseline data, and exposure to drought, erosion, or forest conversion. Check the relevant legal requirements separately. A nature project does not satisfy a due-diligence obligation merely because it has a carbon method attached.
Consider a coffee buyer sourcing from two districts. In the first, producer-group records identify the farms, while recent dry seasons have increased rejected green coffee lots. In the second, deliveries pass through several intermediaries and farm origins are unknown. Pilot shade management in the first district, with local agronomic advice and quality checks built into the plan. The buyer can trace purchases there and test the intervention against a defined sourcing problem.
Use a short decision memo to record why the selected corridor beats the alternatives, what remains uncertain, and what would stop the pilot. That memo is the first control against a project drifting toward whatever happens to photograph well.
Step 3: Design the supplier engagement and commercial model
The intervention needs an owner on each side of the contract. Decide who supplies planting material or training, who maintains the practice, who bears the cost if a harvest disappoints, and how long the buyer expects to purchase from participating suppliers. Where smallholders participate, budget cash flow and technical support for practices that offer a later return.
Put these terms in a supplier agreement or pilot addendum. It should cover eligible farms and volumes, consent to data collection, access for monitoring, any land or carbon rights that matter, benefit sharing, and what happens if the purchasing relationship ends. Ask local counsel and producer representatives to review the arrangement. The Accountability Framework is a useful reference for supply-chain work involving forests, ecosystems, and human rights.[3]
Avoid assigning an automatic carbon benefit to the buyer. The contract should say which party has the right to report each outcome, how overlapping claims will be checked, and how any issued credits will be handled. A reduction reported in a buyer’s inventory cannot simply be sold for someone else’s offset claim without an accounting review. SBTi FLAG guidance excludes purchased credits used as offsets from near-term FLAG target achievement.[2]
Set commercial measures beside environmental ones: delivered volume, rejection rate, supplier retention, and procurement cost. They tell you whether the program works as a supply-chain investment, even if carbon accounting takes longer to resolve.
Step 4: Build monitoring, reporting, and verification before rollout
Agree on the baseline and data flow before paying for a full rollout. Identify the land units or sourcing regions in scope, the practices that change, the records suppliers already keep, and the additional measurements the program requires. Decide which data can come from field visits, transaction records, or remote sensing, and who checks each source.
For carbon, separate three questions. Did the practice happen? Did emissions or removals change under an applicable method? Can the buyer attribute a defensible share to its purchased goods without double counting? The GHG Protocol’s 2026 guidance includes dedicated chapters on spatial boundaries, data and methods, evaluating actions, credited outcomes, and assurance.[1] These are distinct jobs. A photograph of a planted tree answers only part of the first.
CCC’s MRV and Additionality article explains the separate evidence questions a project reviewer will ask.
Create an evidence file for every reporting period: dated supplier and farm records, purchase volumes, methods and emission factors, uncertainty, quality checks, and changes from the baseline. Specify who can challenge the data and how corrections are recorded. If a project also seeks credit certification, keep project accounting and corporate inventory accounting separate. The GHG Protocol says its land standard focuses on entity-level inventories and does not set the rules for credit certification.[4]
Start with the minimum viable measurement design that can survive review. Add complexity when the pilot tells you which data actually changes a decision.
Step 5: Decide what can be reported and claimed
Insetting program design needs reporting rules before the marketing copy. Procurement, sustainability, finance, and legal should agree on four distinct outputs: operational performance; observed land or nature outcomes; inventory effects, if the accounting criteria are met; and any separately issued credits. One dashboard can display them, but they should not share a single unqualified headline.
SBTi FLAG guidance allows certain land-based removals within a company’s operations or supply chain to contribute to FLAG pathways, subject to criteria including permanence, traceability, data quality, and allocation. It does not allow purchased offsets to meet near-term FLAG targets.[2] Eligibility therefore depends on evidence and the applicable target rules, not on calling an activity “insetting.”
Draft a claims register. For each proposed sentence, record the period, boundary, data owner, calculation method, reviewer, and whether the result is measured, estimated, or still a goal. If the evidence supports only “we funded a pilot with 200 farms,” say that. Do not turn a funding fact into a verified emissions reduction.
What good looks like by year three
Treat year three as a review point, not a promised payback date. A mature pilot should have mapped participating supply volumes, a stable supplier agreement, a repeatable data collection process, and a comparison of commercial and environmental results against the baseline. It should also have a documented answer for outcomes that cannot be included in the buyer’s inventory.
Scale only where the pilot improves a sourcing decision and the evidence can follow the product. If neither condition holds, redesign the intervention or change the corridor. A disciplined program can conclude that a site is unsuitable. That is useful procurement intelligence.
Discuss your insetting program with CCC
Carbon Credit Capital designs nature-based supply chain investments around sourcing needs and measurable sustainability outcomes. Schedule a consultation with our carbon and sustainability experts to map your tier-one supplier network, FLAG exposure, and first pilot decision.
Sources
[1] GHG Protocol, Land Sector and Removals Standard, version 1.1, and companion Guidance, June 2026: https://ghgprotocol.org/land-sector-and-removals-standard ; https://ghgprotocol.org/land-sector-and-removals-guidance
[2] Science Based Targets initiative, Forest, Land and Agriculture Science-Based Target-Setting Guidance, version 1.2, March 2026, especially pp. 16–17, 37, and 41: https://sciencebasedtargets.org/resources/files/SBTiFLAGGuidance.pdf
[3] Accountability Framework initiative, Accountability Framework and guidance for companies: https://accountability-framework.org/
[4] GHG Protocol, Frequently Asked Questions: Land Sector and Removals Standard, questions 10 and 18: https://ghgprotocol.org/blog/frequently-asked-questions-land-sector-and-removals-lsr-standard

‘COP-out’: COP31 fails to deliver the ambition needed to phase out fossil fuels and address climate breakdown
COP31 Bulletin Day 13: New draft retains electrification goal but delays adaptation finance and science decisions

How “Marie Antoinnete” Can We Get?

-
Climate Change1 year ago
Guest post: Why China is still building new coal – and when it might stop
-
Greenhouse Gases1 year ago
Guest post: Why China is still building new coal – and when it might stop
-

 Renewable Energy1 year ago
Sending Progressive Philanthropist George Soros to Prison?
-
Greenhouse Gases1 year ago
嘉宾来稿:探究火山喷发如何影响气候预测
-

 Climate Change2 years ago
Analysis: China’s CO2 falls 1% in Q2 2024 in first quarterly drop since Covid-19
-

 Climate Change1 year ago
嘉宾来稿:探究火山喷发如何影响气候预测
-

 Renewable Energy5 months ago
Send a Bible to a Starving Child
-

 Green Living2 years ago
Our Picks for the Top 2024 Black Friday and Cyber Week Sales From Sustainable Brands