
Developing countries are receiving just a fraction of the international finance they need to prepare citizens and adapt infrastructure for escalating climate impacts.
That is according to the latest adaptation gap report from the UN Environment Programme (UNEP), which calculates that developing nations will need more than $310bn annually between now and 2035 to prepare for the impacts of climate change.
And yet, in 2023, developed nations provided just $26bn in international adaptation finance to developing nations, according to the report.
UNEP warns that, under current trends, developed nations are on track to miss their goal – agreed at the COP26 climate summit in Glasgow – of doubling 2019 international adaptation finance by 2025.
It cautions that countries’ more recent climate-finance pledge for 2035 – the new collective quantified goal (NCGQ) – will be “insufficient” to meet adaptation finance needs.
The UN report – entitled, “Running on empty: The world is gearing up for climate resilience without the money to get there” – also explores how countries are integrating adaptation priorities into national climate plans, policies and practices.
It finds that 87% of countries have at least one national adaptation plan or strategy in place, but warns that gaps remain in the implementation of measures.
Inger Andersen, the executive director of UNEP, says: “Even amid tight budgets and competing priorities, the reality is simple: if we do not invest in adaptation now, we will face escalating costs every year.”
Below, Carbon Brief summarises some of the key takeaways from the report.
- Developed countries are on track to miss their 2025 adaptation finance goal
- Developing nations’ adaptation finance needs are 12 times greater than current flows
- A majority of countries have a national adaptation plan or strategy in place
- Implementation of adaptation measures is progressing – but gaps remain
- The NCQG is insufficient on its own to meet adaptation finance needs
Developed countries are on track to miss their 2025 adaptation finance goal
Climate change adaptation refers to a range of measures that reduce society’s and infrastructure’s vulnerability to climate change, from planting crop varieties that can withstand greater heat through to building stronger defences against floods.
Spending from the public funds of developed nations is a key source of finance for these actions in developing nations, especially for low-income countries that are vulnerable to climate impacts.
Under Article 9 of the Paris Agreement, developed countries agreed to achieve a “balance” in the amount of climate finance raised for emissions reduction and adaptation. However, more money has been raised for cutting emissions than preparing for climate impacts.
UNEP’s adaptation gap report notes that, in 2023, the amount of public money channelled to developing countries from richer nations for adaptation measures fell.
In total, developed countries raised $25.9bn in international adaptation finance – marking a decline on the $27.9bn recorded in 2022.
The report authors attribute the fall to a decline in funding from multilateral development banks, such as the World Bank, which provided more than half – 57% – of international adaptation finance.
The table below shows how adaptation finance provided by developed countries for developing countries (orange) dipped in 2023 – despite an uptick in climate finance as a whole.
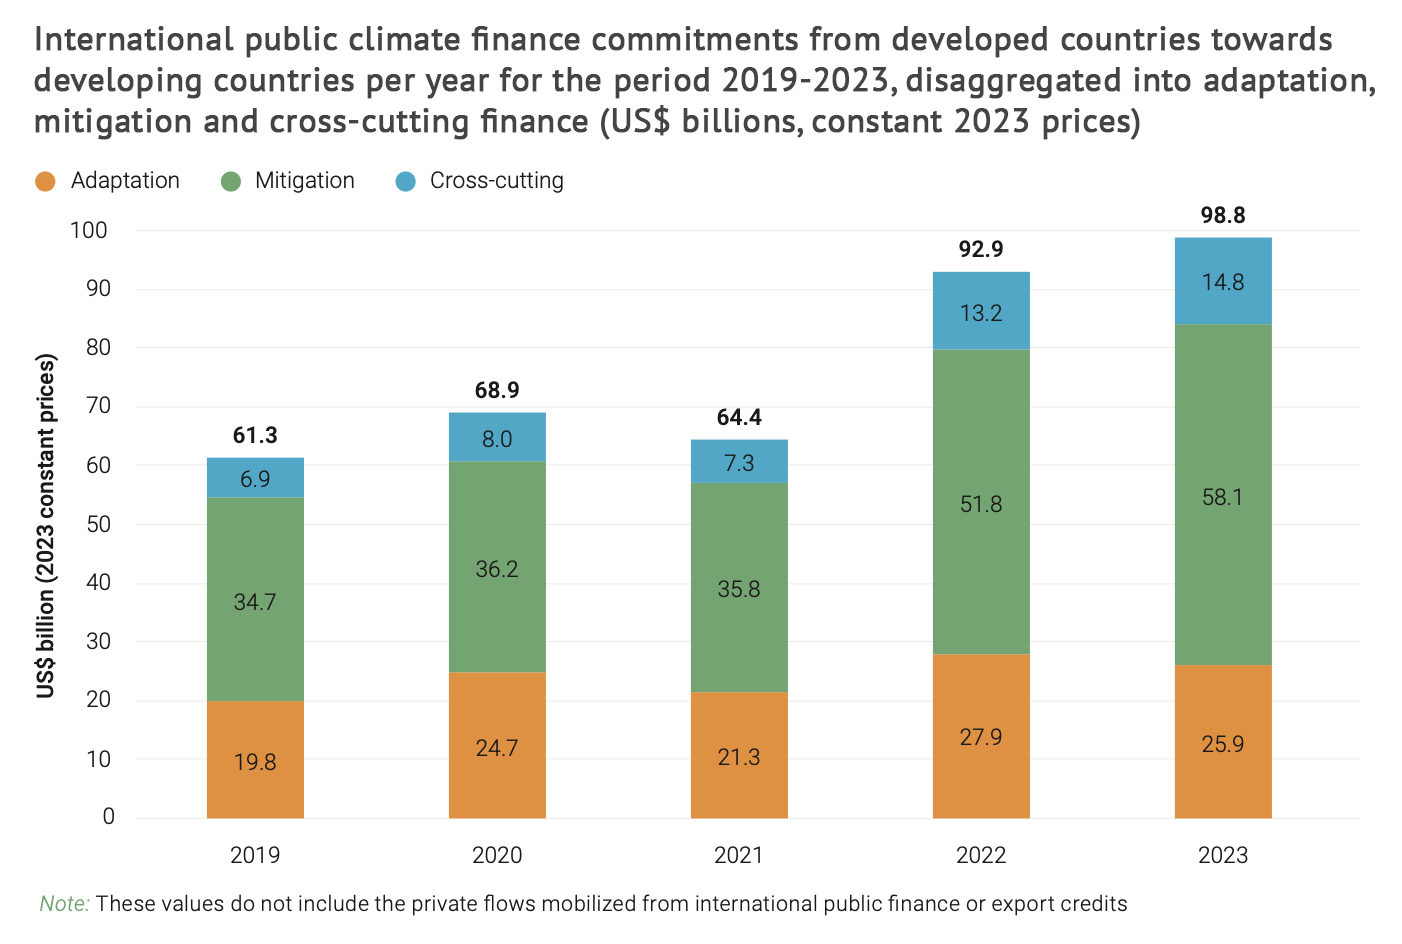
The UN warns that, if current trends continue, developed nations are set to miss their goal of doubling 2019 adaptation finance flows by 2025.
This goal – set out in the Glasgow Climate Pact agreed at the COP26 climate summit in 2021 – commits developed nations to providing $40bn in adaptation funding for developing nations by 2025.
Official climate-finance figures from the Organisation for Economic Co-operation and Development (OECD) for 2025 will not be available for several years. However, the report notes that, over 2019-23, international adaptation finance grew at a compound rate of 7% – falling short of the 12% rate required to meet the Glasgow Climate Pact goal.
Cuts to international aid budgets since 2023 are also threatening the Glasgow Climate Pact goal, according to the report authors. They note that, globally, foreign aid fell by 9% in 2024 and predict that reductions announced in 2025 are “likely” to lead to a further 9-17% decline.
Meanwhile, countries’ more recent pledge to help raise $300bn a year by 2035 for both tackling and adapting to climate change – set out in the new collective quantified goal for climate finance (NCQG), agreed last year at COP29 in Baku – is also under threat, according to the report.
In the introduction of the report, UNEP’s Anderson writes:
“While the numbers for 2024 and 2025 are not yet available, one thing is clear: unless trends in adaptation financing do not turn around, which currently seems unlikely, the Glasgow Climate Pact goal will not be achieved, the NCQG will not be achieved and many more people will suffer needlessly.”
‘Adaptation investment trap’
The report also breaks down international adaptation finance in 2023 by funding type. It finds that that 70% was either grants, which allow countries to address climate impacts without exacerbating debt, or “concessional” loans, which are provided at below market rate.
However, it notes that “non-consessional” finance – which is provided at, or near, market rates – is on the rise, growing at an annual compound rate of 7% over 2019-23. In 2023, non-concessional loans exceeded concessional ones for the first time, the report notes.
The “increasing proportion” of non-concessional finance raises “long-term affordability and equity” concerns, the authors warn. They also point to the risk of an “adaptation investment trap” – whereby rising climate disasters increase developing countries’ “indebtedness”, which subsequently makes it harder for them to invest in adaptation.
The report also finds that loans and other forms of “debt instruments” comprised “58% on average” of international adaptation finance in 2022-23.
The NCQG text highlights the need for “concessional” and “non-debt creating” finance.
(This came after strong calls from many developing countries to exclude “non-concessional” loans – which result in wealth flowing back to the donor countries as loan repayments and interest – as a form of climate finance. Analysis has shown that many developing countries are spending more on servicing debts than they receive in climate finance.)
Elsewhere, the authors also find that funding for new adaptation projects through UN Framework Convention on Climate Change (UNFCCC) funds (the adaptation fund, green climate fund (GCF) and the least developed countries fund (LDCF) and special climate change fund (SCCF) managed by the Global Environment Facility) saw a “large spike” in 2024, with grants reaching around $920m.
However, they note that the recent increase “may not be a trend, with financial constraints likely to rise beyond 2025”.
Developing nations’ adaptation finance needs are 12 times greater than current flows
While previous UN adaptation gap reports have investigated adaptation finance shortfalls through to 2030, this latest analysis extends its estimates through to 2035.
This is in light of the NCQG, which states that developed countries should “take the lead” in raising “at least $300bn” a year for climate action in developing countries by 2035.
The report calculates that the costs of adaptation by 2035 for developing countries sit in a “plausible central range” of $310-365bn annually. It explains that it has arrived at this range based on “two lines of evidence”:
- A modelled estimate of the additional costs of adaptation, calculated using “global sectoral models with national-level resolution”. This exercise pins the cost of adaptation for developing countries at $310bn a year by 2035 under an intermediate emissions scenario.
- An analysis of the climate finance needs set out by developing countries in 97 national adaptation plans and nationally determined contributions (NDCs) submitted to the UNFCCC – with “extrapolation” of this data to all 155 developing countries. This results in the upper figure of $365bn per year up to 2035.
The chart below shows the disparity between existing finance flows (dark blue bar) and adaptation finance needs and modelled costs (red bars).
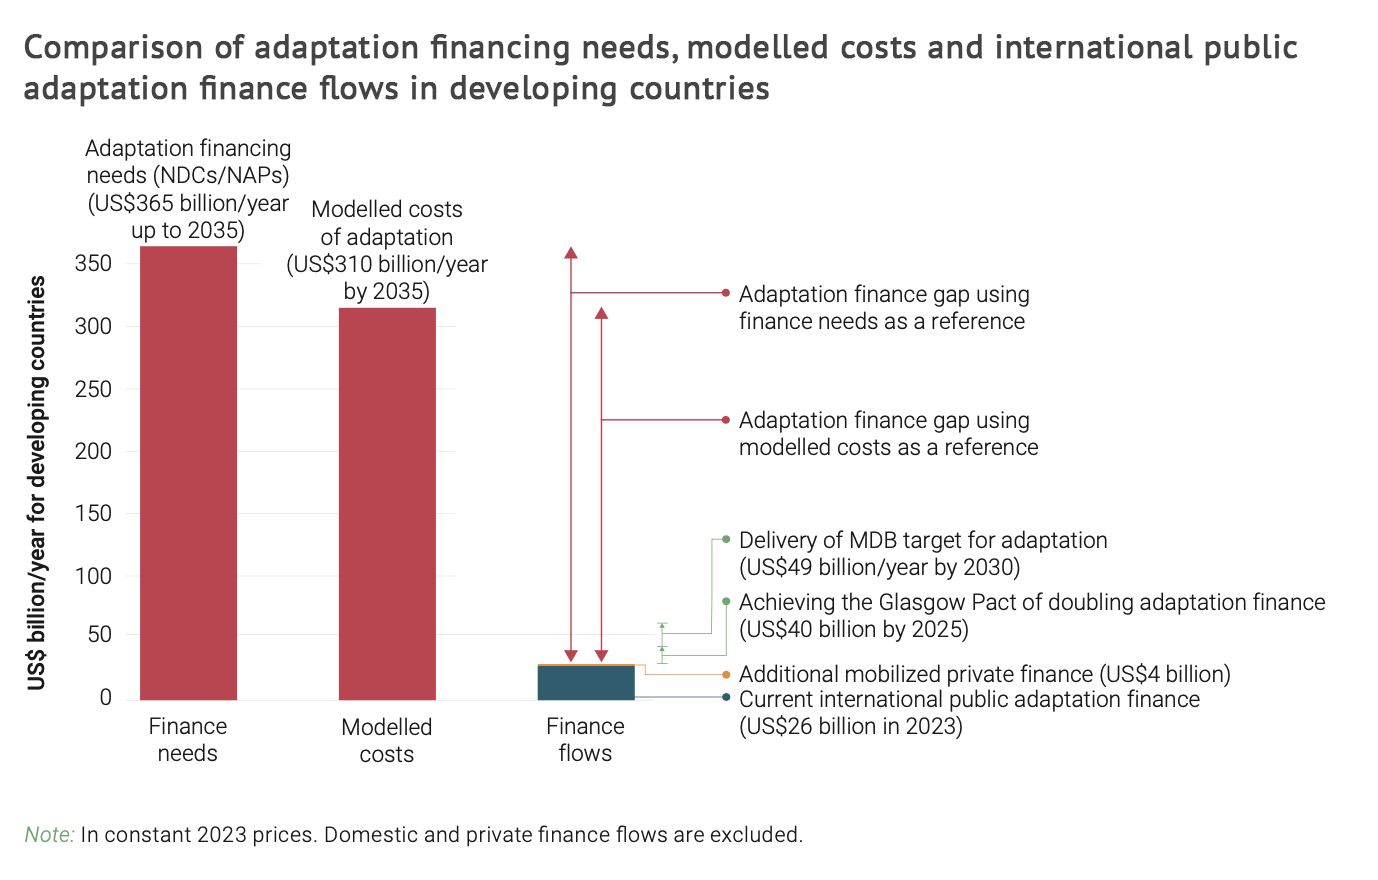
With current levels of international adaptation finance estimated at $26bn a year, the report calculates that developing countries are facing an “adaptation finance gap” in the range of $284-339bn per year by 2035.
As such, it calculates that the adaptation finance needs of developing countries by 2035 are “12-14 times” as much as current finance flows.
Of the public adaptation finance that has been issued, a higher proportion currently goes to the countries most exposed to climate hazards, according to the report. It notes that, in 2022-23, $10.4bn and $1.2bn was allocated to least-developed countries (LDCs), including Afghanistan and Rwanda, and small island developing states (SIDS), such as Tuvalua and the Marshall Islands, respectively.
Nevertheless, finance provided to these climate-vulnerable nations is still “modest relative to needs”, the report warns. It estimates that the adaptation finance needs of LDCs and SIDS are $50bn a year.
It also finds that per-capita adaptation finance to both country groups was lower in 2022-23 than previous years, at $9 for LDCs and $20 in SIDs.
A majority of countries have a national adaptation plan or strategy in place
Under the framework for the global goal on adaptation agreed at COP28, countries said they would put in place “national adaptation plans, policy instruments and planning processes and/or strategies” by 2030.
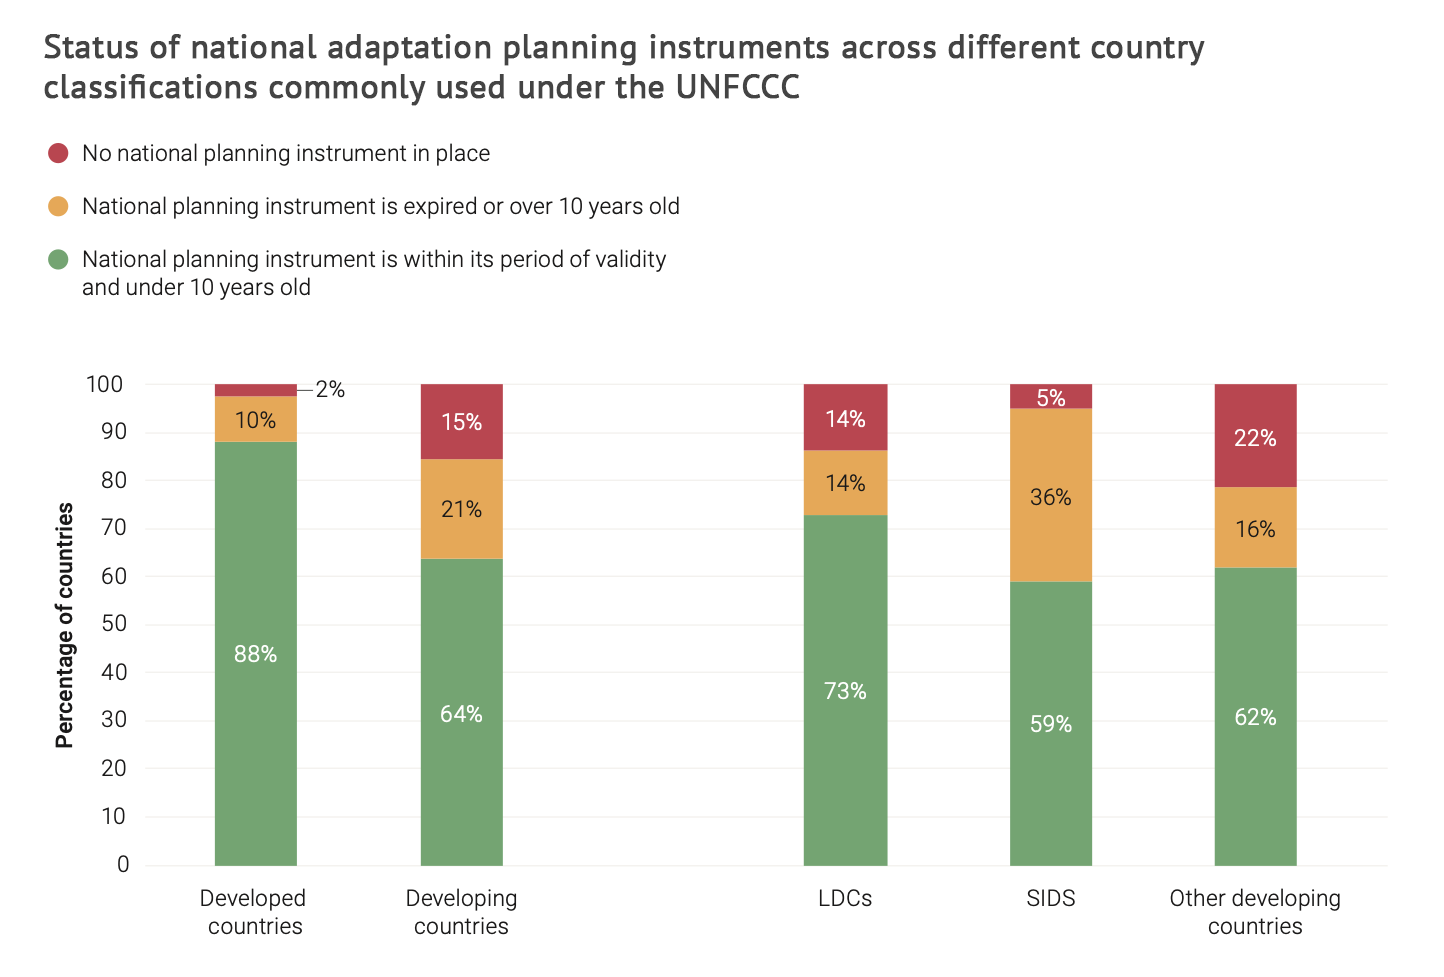
To assess the “global status” of national adaptation planning, the authors of the report tracked the publication of national plans, strategies and policies for adaptation in each country.
According to the report, the first national adaptation policy was published in 2002. It finds that there was a “notable acceleration” in countries developing national adaptation planning instruments over 2011-21, but says that, since then, progress has “slowed significantly”.
According to the report, 87% of countries had at least one national adaptation policy, strategy or plan in place as of 31 August 2025. However, 36 of these 172 countries’ plans are “expired” or “outdated”.
Meanwhile, 25 countries had no national adaptation plan at all, according to the report. It explains that these are “predominantly developing countries, suggesting that financial, technical and human resource constraints inhibit national adaptation planning”.
Of these countries without plans, 21 have “initiated a process to develop” a national adaptation plan, according to the report. However, it notes that many of these countries have “been in this process for a long time”.
The chart below shows the percentage of countries from different “country classifications” that have no national adaptation planning instrument in place (red), an expired adaptation planning instrument in place (yellow) and a valid instrument in place (green).
The report also discusses different types of adaptation “mainstreaming”. This is defined by the report authors as the “integration of adaptation objectives and climate risk considerations into the established functions, policy and practice of government institutions to build climate resilience”.
The authors list six different mainstreaming strategies. For example, “directed” mainstreaming means “dedicating funding, staff capacity-building and resources specifically to adaptation, including through financial frameworks and fiscal processes such as budget planning”.
Another example is “regulatory mainstreaming”, which means “modifying the formal or informal policy instruments such as legislation, frameworks, strategies and plans by integrating adaptation”.
According to the report, only regulatory mainstreaming is captured by the framework for the global goal on adaptation’s target related to planning.
The report also outlines the different “levels” of mainstreaming. These range from “prioritisation”, which it describes as a strong level of mainstreaming in which adaptation takes precedence over existing policy goals, to “coordination”, in which adaptation “is recognised as a policy goal, but is secondary to existing priorities”.
However, the report says there is “presently no agreement on how to measure and assess the outcomes of mainstreaming”.
Implementation of adaptation measures is progressing – but gaps remain
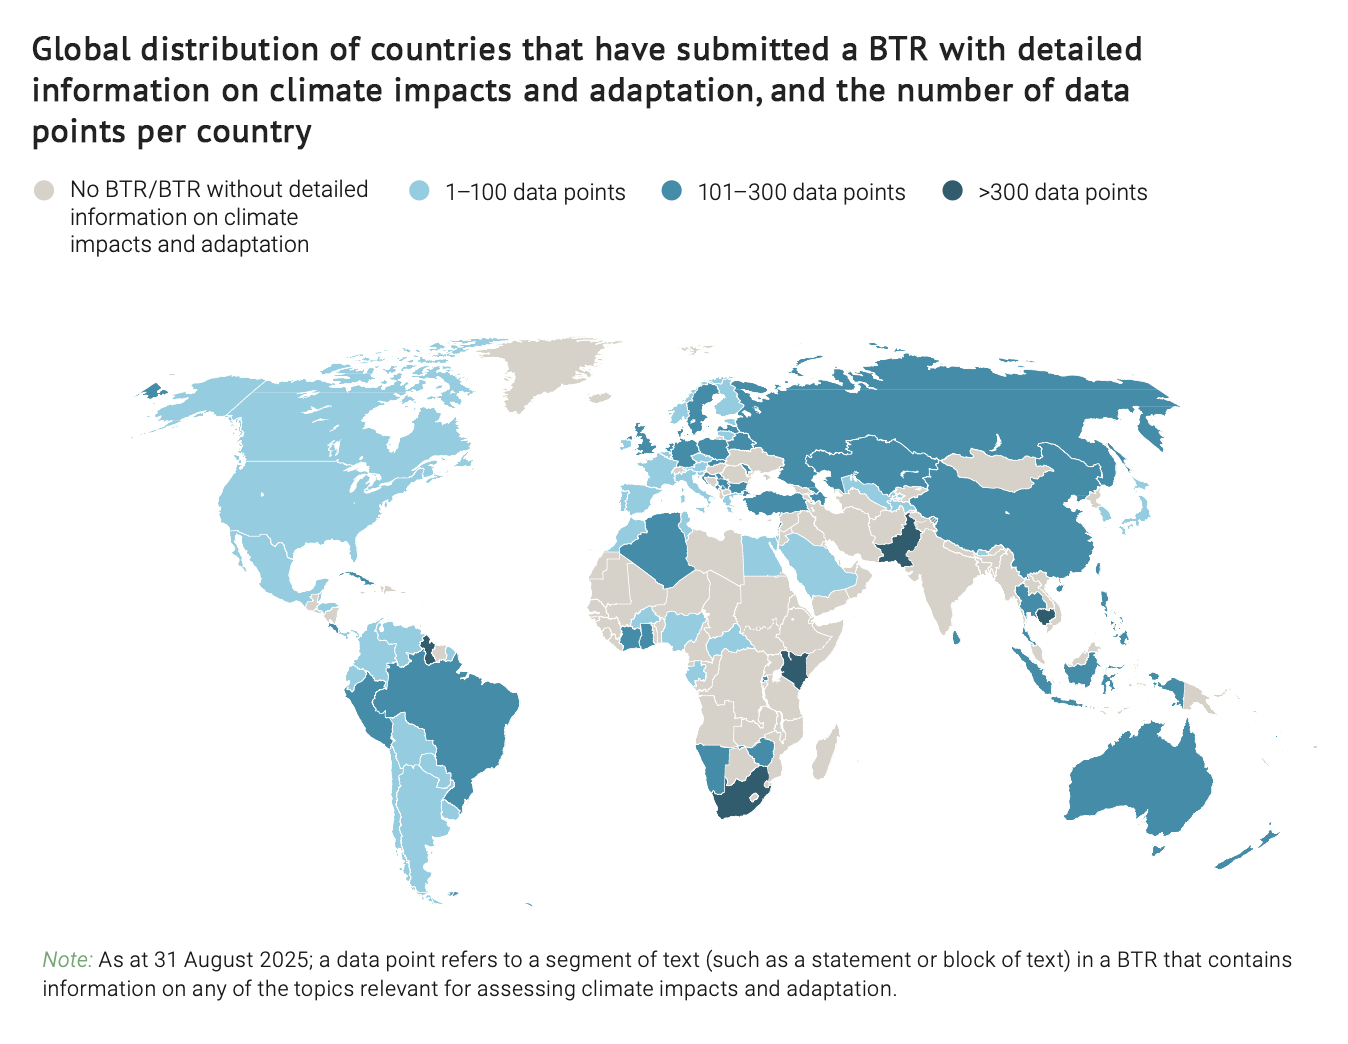
Under the UN “enhanced transparency framework”, countries are required to submit information about their climate progress in biennial transparency reports (BTR). The first report was due at the end of 2024.
The adaptation gap report calls BTRs the “most comprehensive national source of information on adaptation implementation worldwide available”.
The report says that 105 countries had submitted BRTs as of 31 August 2025, of which 94 include details about adaptation
The authors find that 75 of these BTRs mention gender in relation to adaptation. However, only 4% of the results reported through BTRs are directly related to “gender and social inclusion”.
The report also highlights the “uneven coverage” of BTRs globally. According to the report, 88% of developed countries have submitted a BTR, compared to only 37% of developing countries.
It adds that there are further inequalities within the bracket of “developing countries”. Only 21% of SIDS and 14% of LDCs have submitted BTRs with “detailed information on climate impacts and adaptation”, according to the report.
This could “indicate that preparing national reports such as BTRs is most burdensome for the countries with the least capacity”, the report authors suggest.
The map below shows the countries that have submitted a BTR including “detailed information on climate impacts and adaptation” (blue) and those that have not (grey). For the former category, darker blue indicates that the country’s BTR includes more segments of text (data points) about climate impacts and adaptation.
The report finds that countries are “disproportionately reporting on climate hazards, systems at risk, climate change impacts and adaptation priorities” in BTRs. Meanwhile, only 15% and 7% of the data points in the map above discuss adaptation “actions” and “results” respectively.
In total, the report identifies 1,640 “adaptation actions” across 68 BTRs. It says that 23% of these are related to “biodiversity and ecosystems”, 18% to “infrastructure and human settlements”, 16% to “water and sanitation” and 14% to “food and agriculture”.
However, it finds that actions targeting health and poverty alleviation or livelihoods are each accounting for only 5%, while those addressing cultural heritage are “nearly absent” and account for less than 1% of all reported actions.
In a separate analysis, the report explores documents submitted by developing countries to the UNFCCC to understand how adaptation needs break down by sector. It finds that the 55 plans submitted by developing countries which include “detailed sectoral information” reveal that the agriculture and food sector and water supply are “common priorities across all regions, though they vary in terms of their relative importance”.
The NCQG is insufficient on its own to meet adaptation finance needs
At COP29 last year, developed nations pledged to raise at least $300bn per year under the NCQG for both mitigation and adaptation.
The report says that, although the target “appears significantly higher than the previous goal for developed countries to mobilise $100bn by 2020 for developing countries”, it is still “clearly insufficient” to meet adaptation finance needs in 2035.
The report sets out two reasons for this.
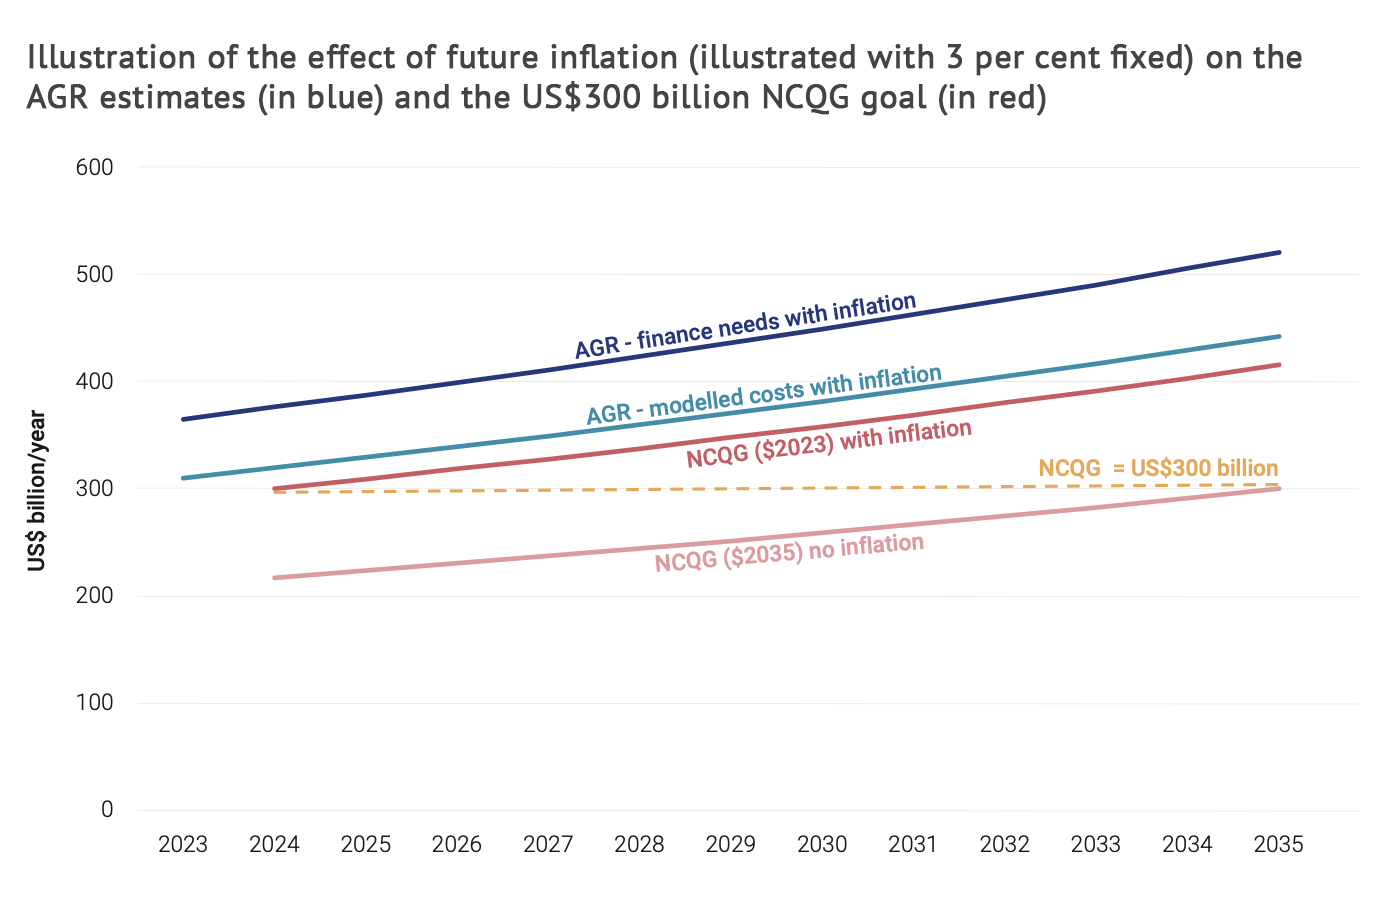
First, the authors explain that the $300bn target is not adjusted for inflation. It says that adaptation costs for developing countries are currently estimated at $310-365bn annually until 2035, based on costs in 2023. However, when adjusting for an inflation rate of 3% per year for the next decade, this number rises to US$440–520bn by 2035.
(In an analysis published last year, Carbon Brief noted that the $300bn target does not account for inflation.)
The plot below shows the effect of inflation on adaptation finance needs (dark blue) and modelled costs (light blue). It also shows the NCQG goal, accounting for inflation, based on 2023 costs (red) and without inflation based on 2035 costs (pink). It also shows the NCQG goal of $300bn by 2035 (yellow).
Second, it notes that the NCQG covers both mitigation – namely, efforts to cut emissions – and adaptation. So far, it warns that no “subgoal” has been agreed to determine how much money goes to each.
The report authors have also developed two scenarios exploring how much the NCQG would bridge the adaptation finance gap, if the $300bn target is met, both of which account for inflation. These are:
- A “minimum adaptation scenario”. The authors assume that 26% of the NCQG money will be used for adaptation finance as this is the percentage of all international climate finance that was spent on adaptation over 2011-20. Based on historical proportioning of finance, $3bn of the resulting $78bn this would go to SIDS and the rest to $25bn to LDCs.
- A “maximum adaptation scenario”. Under this scenario, the Glasgow Pact and Baku to Belém Roadmap are achieved, meaning that adaptation funding reaches $40bn annually by 2025 and $120bn annually by 2030. They also assume that adaptation finance grows by 7% per year, reaching $166bn by 2035 – more than half of the NCGQ finance goal of $300bn. Under this scenario, SIDS would receive $6bn in adaptation funding by 2035 and LDCs would receive $55bn.
The report concludes that, even if the NCQG is achieved, a “significant adaptation finance gap” is likely to remain in 2035 “regardless of the share of international public climate finance that will flow towards adaptation”.
Meanwhile, the report notes that private-sector finance can help “fill the adaptation finance gap” – but cautions that its overall contribution is likely to be “modest”.
The “realistic” potential for private-sector investment, according to the report, is $50bn per year by 2035 – a figure it estimates would cover 15-20% of overall estimated needs.
Reaching this level of private-sector finance will require “targeted policy action” given that current private-sector flows to “publicly identified” adaptation priorities in 2023 are estimated at $5bn, it notes.
Furthermore, UNEP warns that many proposed approaches for raising private-sector funds for adaptation measures pass “most of the costs of adaptation back to developing countries or households”.


The post UN report: Five charts which explain the ‘gap’ in finance for climate adaptation appeared first on Carbon Brief.
UN report: Five charts which explain the ‘gap’ in finance for climate adaptation
Climate Change
Toxic Ocean Crisis in Papua New Guinea Sparks Mass Marine Die-Off and Public Health Emergency
Thousands of dead fish are washing ashore and people are falling ill too, as officials investigate possible sources of contamination.
It started in December, when dead fish began washing ashore New Ireland—a mountainous island in Papua New Guinea’s New Ireland Province, flanked by the Pacific Ocean and the Bismarck Sea.
Toxic Ocean Crisis in Papua New Guinea Sparks Mass Marine Die-Off and Public Health Emergency
Go behind the scenes with senior editor Corey Mitchell and reporter Bob Berwyn as they discuss critical measures of the planet’s health.
“Earth is being pushed beyond its limits while every key climate indicator is flashing red,” warned U.N. Secretary-General António Guterres after the release of the latest State of the Global Climate report from the World Meteorological Organization.
Climate Change
Summit Sold Its Midwest Pipeline as a Carbon Solution. Now, It’ll Be Used for Fossil Fuels.
The pivot reveals a company adapting to Trump’s “drill, baby, drill” agenda and looking to cash in on recently boosted tax incentives for enhanced oil recovery.
For four years, battles over private property rights have gridlocked state legislatures across the Midwest and stalled plans for a pipeline to transport liquified carbon dioxide from ethanol plants in the region.
Summit Sold Its Midwest Pipeline as a Carbon Solution. Now, It’ll Be Used for Fossil Fuels.


-
Climate Change8 months ago
Guest post: Why China is still building new coal – and when it might stop
-
Greenhouse Gases8 months ago
Guest post: Why China is still building new coal – and when it might stop
-

 Greenhouse Gases2 years ago
嘉宾来稿:满足中国增长的用电需求 光伏加储能“比新建煤电更实惠”
-
Climate Change2 years ago
Bill Discounting Climate Change in Florida’s Energy Policy Awaits DeSantis’ Approval
-

 Climate Change2 years ago
嘉宾来稿:满足中国增长的用电需求 光伏加储能“比新建煤电更实惠”
-
Climate Change Videos2 years ago
The toxic gas flares fuelling Nigeria’s climate change – BBC News
-

 Carbon Footprint2 years ago
US SEC’s Climate Disclosure Rules Spur Renewed Interest in Carbon Credits
-

 Renewable Energy5 months ago
Sending Progressive Philanthropist George Soros to Prison?