

For ocean advocates like me who have been tracking the $1.5 trillion Bipartisan Infrastructure Law (BIL) rollout, the need for this long overdue investment in climate resilience is crystal clear. The law earmarks $50 billion for improving critical water infrastructure, like drinking water, stormwater and wastewater systems that are essential for maintaining safe, functioning communities and ecosystems. In coastal counties, which are home to about 40% of the United States’ population, critical water infrastructure is growing more vulnerable to climate change and faces a host of compounding hazards such as sea level rise and flooding, heavy precipitation and extreme storm surges. While swift implementation of climate funds is important, it’s vital that decision-makers are careful to deliver on President Biden’s Justice40 promise, a whole-of-government framework that instructs federal agencies to more equitably deliver climate investments to under-resourced communities.
Ocean Conservancy’s Justice40 interim report dives into research conducted in Florida at the nexus of failing water infrastructure, climate risk, and federal infrastructure investments in disadvantaged communities. Florida, one of the most climate-vulnerable states in the country, received a C rating or lower for water infrastructure types assessed by the American Society of Civil Engineers, signaling that robust investments from the BIL are essential.
Never miss an update
Enter your email and never miss an update
Despite its importance for our communities and the environment, critical water infrastructure across the United States is increasingly aging and failing. In 2023 alone, countless instances of climate-related water system failures have made headlines. In South Louisiana, record-low water levels in the Mississippi River, coupled with rising sea levels in the Gulf of Mexico, are causing saltwater to creep north up the river, damaging drinking water pipes and water intake systems. Communities living in southern parishes that tend to be low-income have had to rely on bottled water for drinking and cooking since June to avoid the adverse health impacts of consuming saltwater. A deteriorating wastewater treatment plant in San Diego near the U.S.-Mexico border is causing sewage overflows to contaminate beaches and waters in Southern California. This crisis became considerably worse when Hurricane Hilary inundated the area with heavy rains in August. In low-lying Southeast Florida, residents are constantly plagued by severe floods that engulf roadways and destroy property. Each time I visit Miami during the rainy season, I am struck by the height of floodwaters, rising up onto sidewalks and spilling out from retention ponds. Further communicating the need for upgrades to stormwater infrastructure, the National Oceanic and Atmospheric Administration (NOAA) has continued to document instances of record high-tide flooding from coast to coast. Without significant efforts to prepare critical water infrastructure for worsening climate impacts, the well-being of coastal communities and the health of our ocean will continue to be jeopardized.
Not all coastal populations bear the same burden from water infrastructure failure and other impacts. Communities of Black and Indigenous peoples, other people of color and those experiencing intergenerational poverty are often disproportionately overburdened by climate change, environmental degradation and under-funded infrastructure. Nearly 60% of the population living in coastal cities identify as Black, Indigenous or people of color, so these historically neglected groups near the coast should benefit the most from the BIL and other resources to cope with climate impacts, keeping in line with the administration’s Justice40 vision.
To better understand the nature of critical water infrastructure risk and funding disparities at a localized scale, we conducted a geospatial analysis studying systemically disadvantaged communities exposed to the cumulative effects of failing water systems, water pollution and coastal climate impacts. This research focused on the cities of Jacksonville and Orlando and Miami-Dade County in Florida. A funding gap analysis uncovered that, despite being the most impacted by failing critical water infrastructure, overburdened Black and brown communities received fewer infrastructure dollars from two Environmental Protection Agency clean water and drinking water funding sources that received once-in-a-generation investments from the BIL in 2021. This phase of the study also highlighted major challenges associated with leveraging federal infrastructure dollars from the perspectives of local decision-makers and community residents. Some challenges identified include limited capacity to complete funding applications, a lack of transparency regarding funding availability, and competing funding priorities that often leave out disadvantaged communities. The methodology and results of this study could be duplicated in other locations to support community advocacy and identify areas in need of climate investments.

Being a lead researcher on this study, I’ve had an opportunity to carefully observe the implementation of Justice40 and the BIL over time. One of my biggest takeaways is that, as resources continue to be rolled out by the government, members of the public must be attentive and work together to ensure that our decision-makers do not repeat longstanding legacies of leaving the most impacted communities behind. Here are some important first steps to get informed and spread knowledge to mobilize our peers. Ask yourself and your network:
- “Who is disproportionately impacted and what infrastructure projects do they want for their communities?
- What money is available and where is it being allocated?
- What are the best ways to hold state and local decision-makers accountable?
- How am I positioned to help?”
We must treat this time of historic investment as an all-hands-on-deck moment, especially as climate justice and clean water access continue to emerge as central to today’s movement for human rights and planetary healing. Check out our new Justice40 interim report to learn more.
The post Ocean Justice Requires Climate Action for All appeared first on Ocean Conservancy.

Ocean Acidification
Dr Heidarzadeh’s TV interview with SkyNews on the massive M7.7 Panama earthquake on 9 October 2026
Dr Heidarzadeh’s TV interview with SkyNews on the massive M7.7 Panama earthquake on 9 October 2026. Click here for the full story.

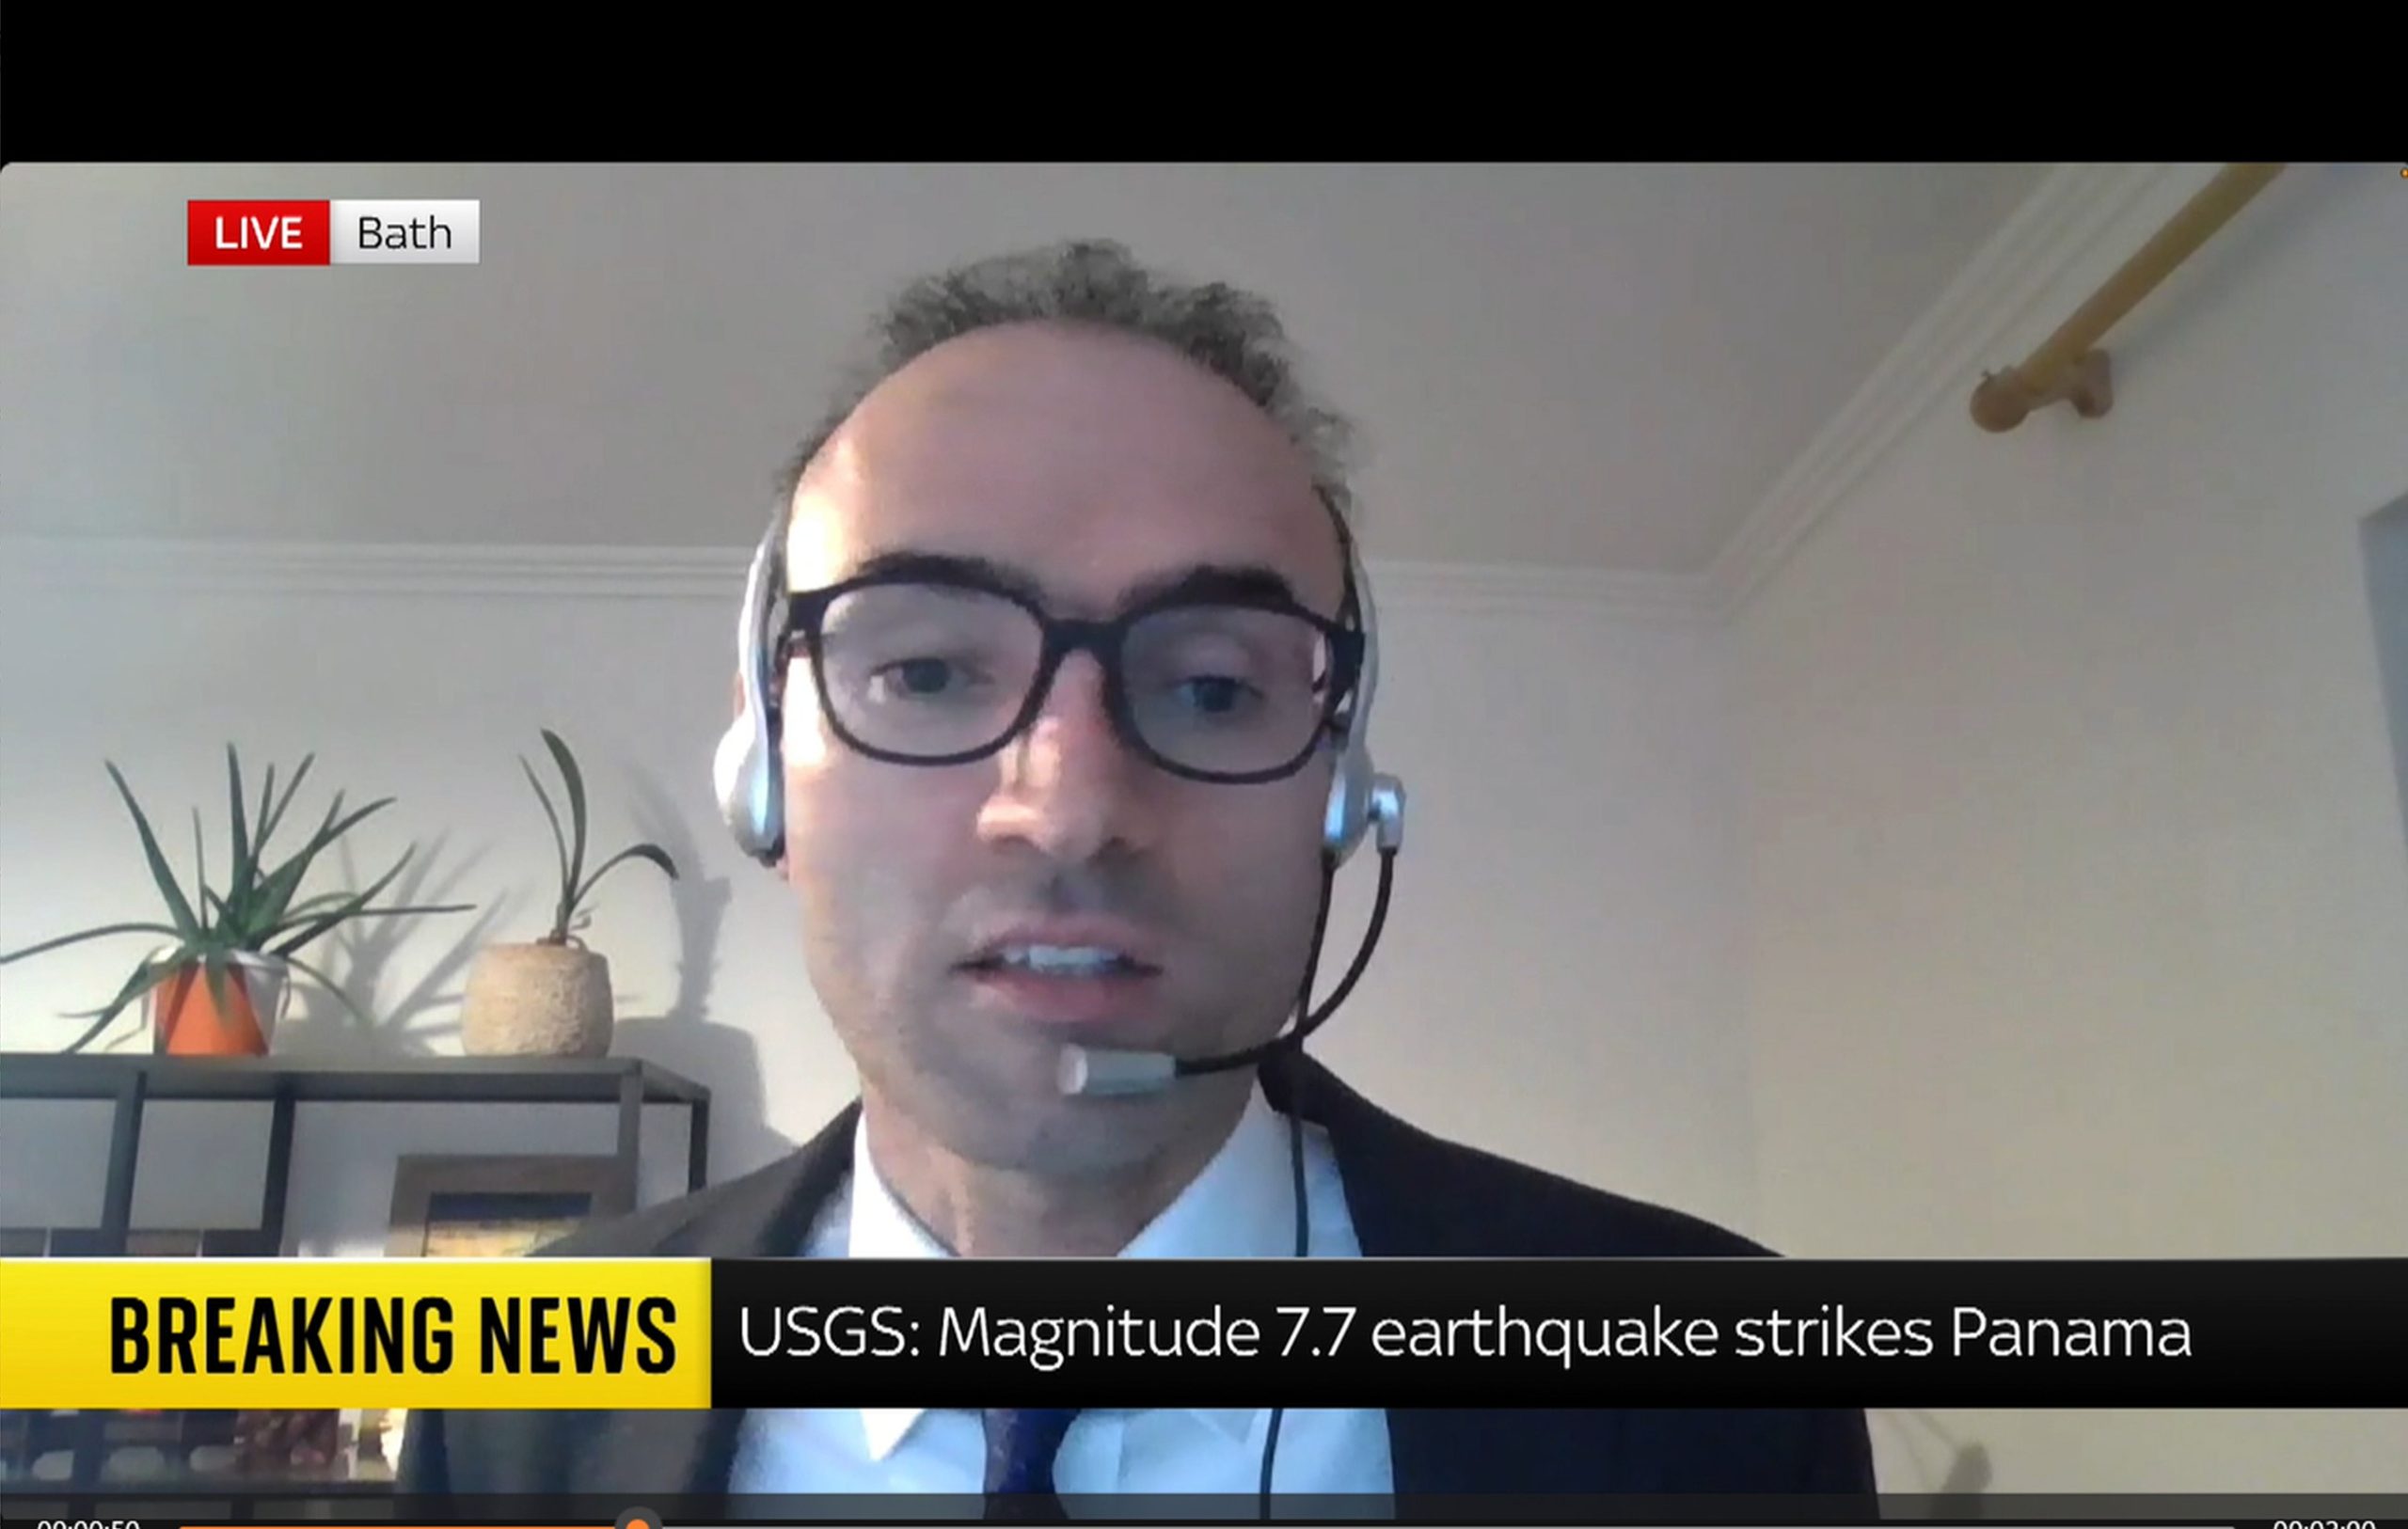
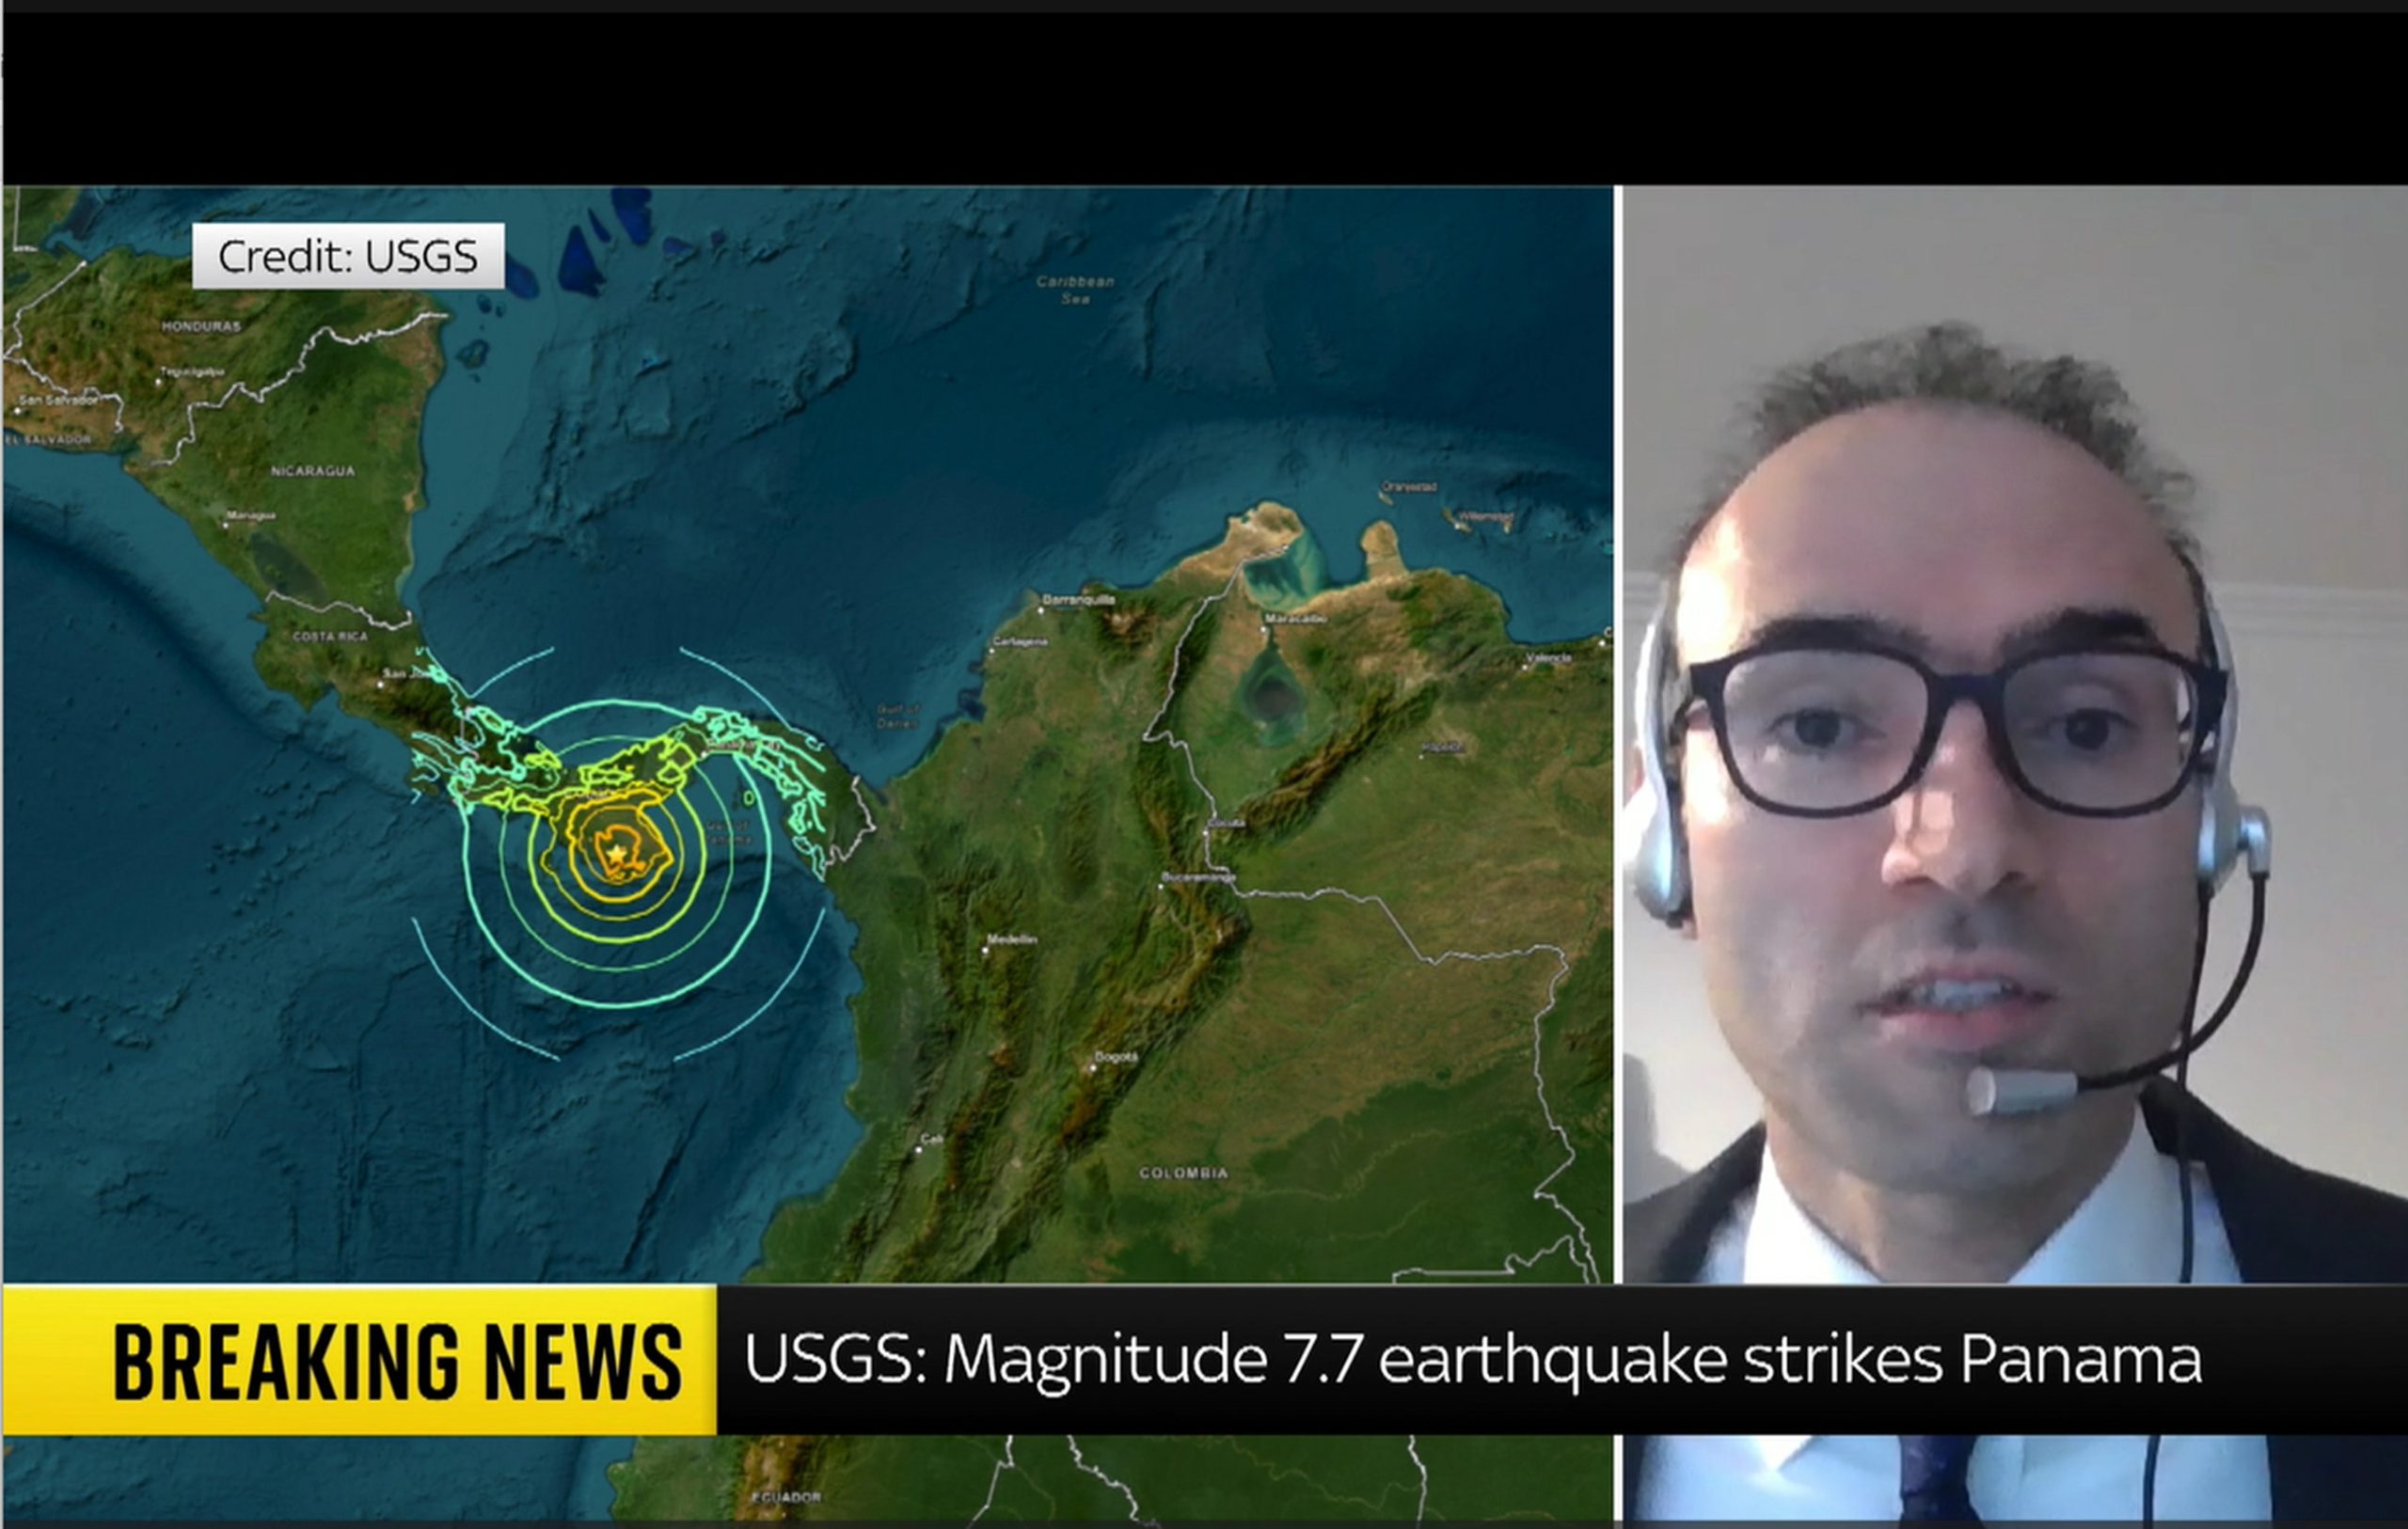
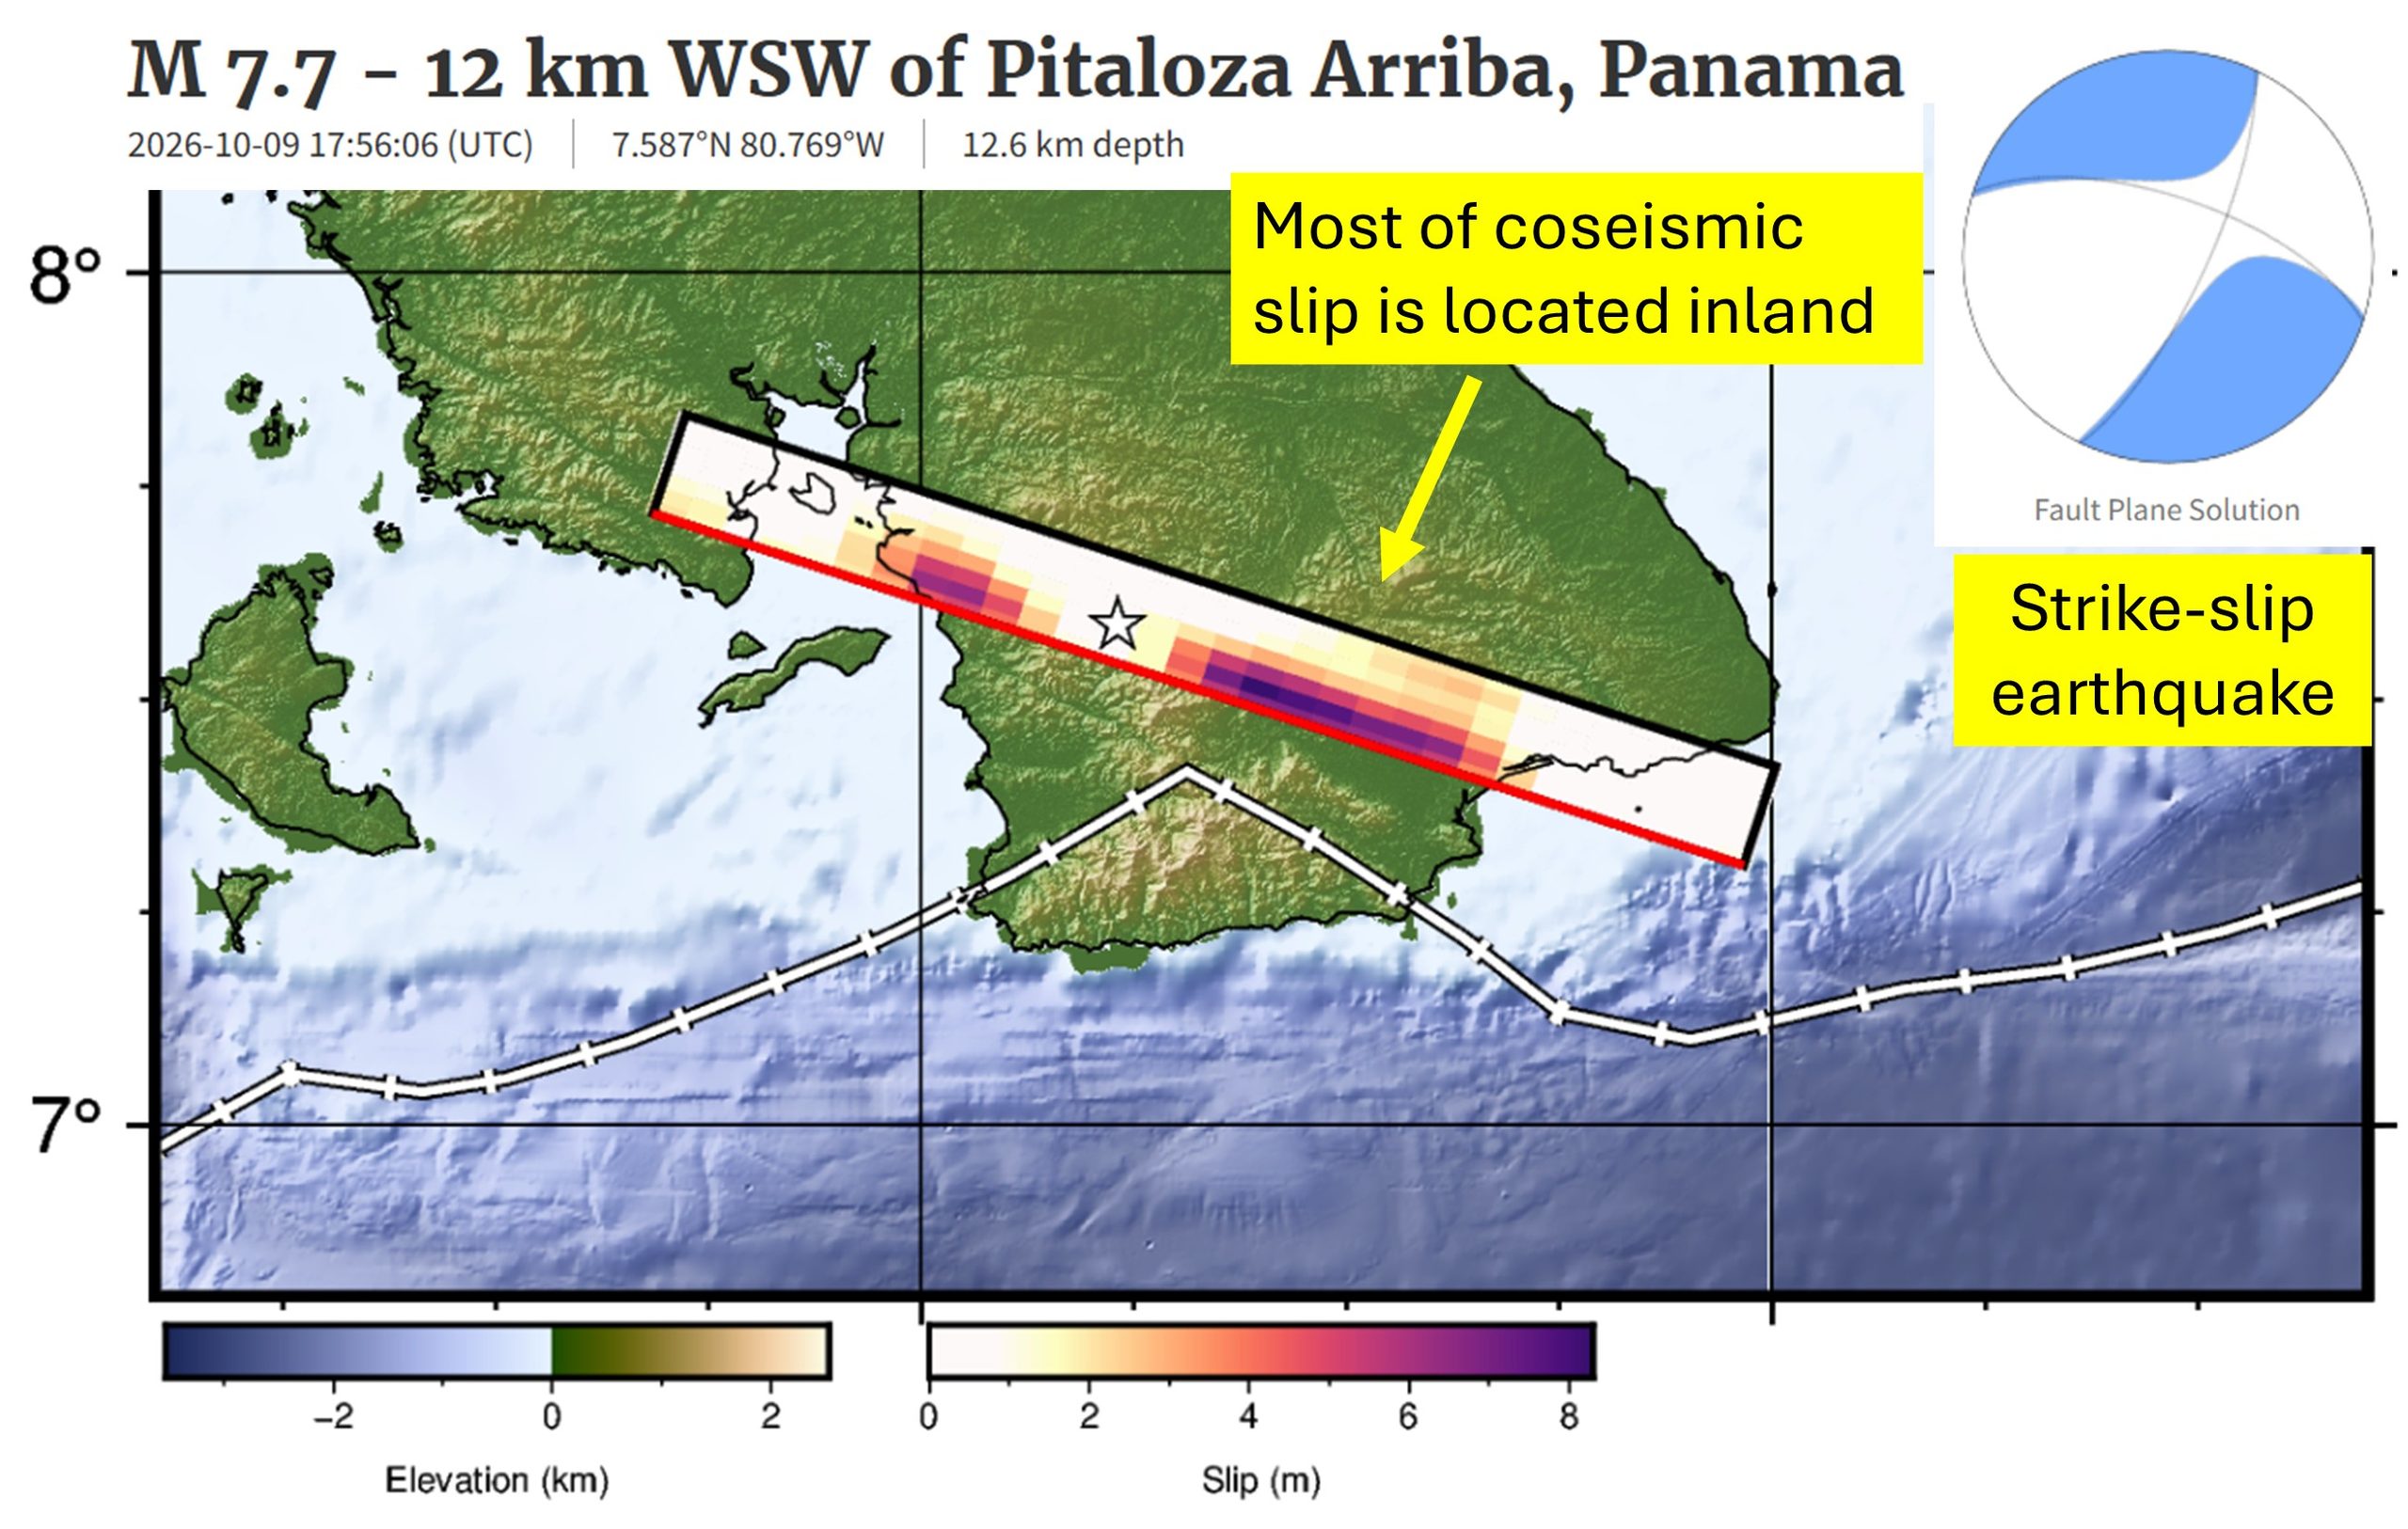
Dr Heidarzadeh’s TV interview with SkyNews on the massive M7.7 Panama earthquake on 9 October 2026
Our ocean is an incredibly vast and mysterious place. And there is no place where that is more evident than the deepest ocean area in the world: the legendary Mariana Trench. Located east of the Philippines, the Mariana Trench lies in the Mariana Archipelago in the western portion of the North Pacific. The greater area of the Mariana Trench Marine National Monument is made up of more than 95,000 square miles of ocean. Beneath these waters lie incredibly complex aggregations of submerged islands and volcanoes … and of course, an astoundingly massive trench.
Dive in with us to have your biggest questions answered about the famed Mariana Trench.
How deep is the Mariana Trench?
The deepest part of the Mariana Trench, known as Challenger Deep, is almost 36,000 feet below the ocean’s surface. For context, Mount Everest is about 29,000 feet above sea level, so the Mariana Trench is about 7,000 feet deeper than Mount Everest is tall. For one more comparison, the RMS Titanic lies at a depth of about 12,500 feet below sea level. The Challenger Deep is in waters nearly three times deeper than this ship’s final resting place.
Due to its enormous size, the Mariana Trench has at times been affectionately nicknamed the Grand Canyon of the ocean. This is certainly a picturesque image, but don’t let the mammoth size of this U.S. national terrestrial park fool you into thinking the Mariana Trench matches its size. The trench’s footprint is estimated to be 120 times larger than the Grand Canyon’s, and to reach the bottom of Challenger Deep, you’d need to descend through almost six Grand Canyons stacked on top of each other before you’d reach the seafloor.
Oh … and did we mention it’s five times wider than it is deep? It’s about 43 miles wide!
What is Challenger Deep, and how long would it take to reach it?
Challenger Deep is the deepest point of the Mariana Trench. Fewer than 30 people have ever journeyed to this area. The trek below the surface is long, dark and time-consuming, and it’s not an expedition considered lightly by scientists and explorers.
The first people to descend into the depths of this area in 1960 were oceanographers Jacques Piccard and Don Walsh, and it took them close to five hours to reach Challenger Deep. Since then, more advanced submersibles have been created, but it still takes two to four hours for modern vessels to reach such depths. For example, explorer and filmmaker James Cameron reached the seafloor in a little more than 2.5 hours in the first documented solo submarine dive to the area, and it took oceanographer Dr. Dawn Wright about four hours in 2022. It is crucial that these submersibles descend slowly and steadily beneath the surface, as the immense water pressure compounds with every mile a submersible descends. Speaking of pressure …
Get Ocean Updates in Your Inbox
Sign up with your email and never miss an update.
What is the water pressure at the bottom of the Mariana Trench?
If you thought the depth of the Mariana Trench was its only jaw-dropping feature, think again. Water pressure is one of the most important factors affecting deep-sea life. In the ocean, pressure increases by one atmosphere for every 33 feet (10 meters) of depth. One atmosphere (a unit of measurement for pressure equivalent to average air pressure at sea level) is equal to about 14.7 pounds per square inch (PSI), which is the approximate standard atmospheric pressure at sea level. If you were to convert atmospheric pressure into weight, one atmosphere is about the weight of a bowling ball. Stay with me, friends.
If a vessel were to dive 2,000 feet below the surface, the pressure would equal that of 60 bowling balls stacked atop every square inch of that submersible. But 60 bowling balls is simply nothing compared to the pressure in the Mariana Trench. The atmospheric pressure at the depths of Challenger Deep is equal to about 16,000 PSI. That pressure is about the same as the weight of an entire full-grown elephant on every square inch of a submersible!
Need a more extreme comparison? If a human were to be placed at the bottom of the Mariana Trench, the pressure would be equal to that of 50 jumbo jets piled on top of a person!
Do any animals live in the Mariana Trench?
The depths of the Mariana Trench come with immense pressure and extreme darkness, but somehow, life finds a way to survive. Organisms that live at an extreme depth, like that of Challenger Deep, have to be highly adapted to low temperatures (typically just above freezing), high pressure and virtually no light at all.
Species found in the depths of the Mariana Trench might look vastly different from animals from other ocean depths because their anatomy has been refined to thrive in harsh conditions. At such great depths, these animals typically depend on chemosynthesis (using nutrient-rich waters being pumped out of hydrothermal vents) or descending detritus (dead matter that has fallen from higher parts of the ocean) for food, such as whale falls. Just a handful of these animals include species of octopuses and squids, sea cucumbers, amphipods, sea jellies, shrimp, sea worms and some wild-looking fish!
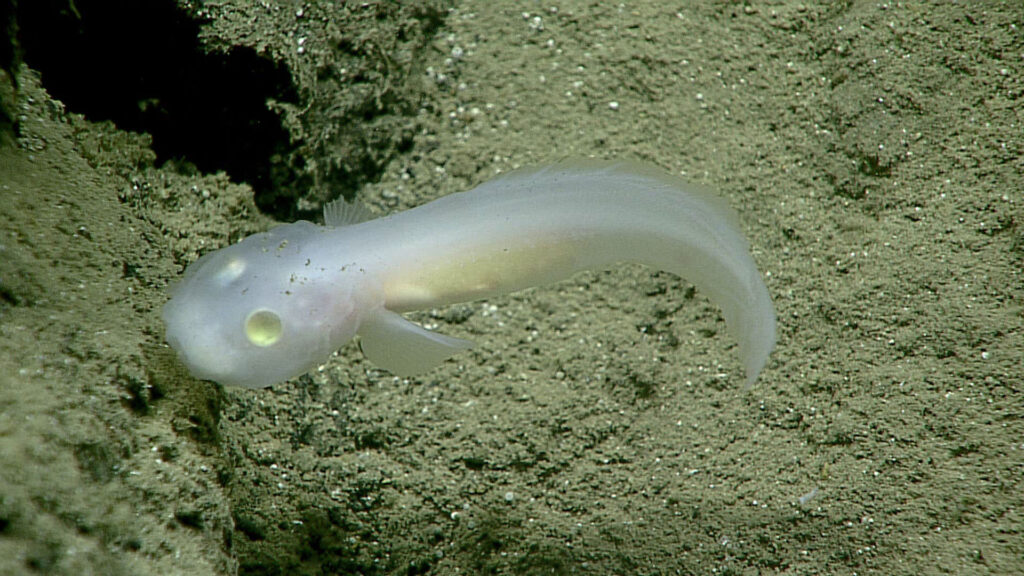
In 2025, more than 7,000 new species were discovered in the Mariana Trench, including the hadal snailfish (Pseudoliparis swirei). This is the deepest-dwelling fish currently known to science. Now, the fish has been dubbed “the Mariana snailfish.”
How was the Mariana Trench formed?
The process by which the Mariana Trench was created is a geologically fascinating one known as subduction. On the Earth’s surface, there are thin plates that cover the planet’s mantle, which is made of molten rock. If two of these plates collide, one pushes down into the Earth’s mantle while the other is pushed over the bottom plate. When this happens, a trench is formed from the drag of the bottom plate. This process can sometimes create incredibly strong earthquakes. The plates that forged the Mariana Trench’s creation are estimated to be up to approximately 180 million years old.
This trench was unknown to scientists until 1875. It was then that a team of explorers on the HMS Challenger measured the depth of the sea by simply lowering a weighted rope into the water. They were baffled when they measured that first portion of the seafloor to be five miles below the surface. And so was born the origin of some of the most daring deep-sea explorations known to mankind to date.
Is the Mariana Trench protected?
The Mariana Trench is in waters off Guam and the Mariana Islands. The region is protected from some human activities under its status as a marine monument. The creation of the Mariana Trench Marine National Monument signified that international, national and local leaders all recognize the importance of protecting this area.
However, just because the region is protected does not mean it’s not vulnerable to modern threats to ocean health. Plastic bags have been spotted in the Mariana Trench during several expeditions, highlighting the far-reaching impact of the marine debris problem. No corner of our ocean is safe from the ever-present threat of plastic pollution. The reality of a changing climate makes the future well-being of wondrous places like the Mariana Trench uncertain. What’s more: More than 70% of the global ocean has yet to be mapped. And what we don’t yet know about, we cannot wisely work to protect.
It’s up to us to work together to defend our ocean, from the sandy shores of our favorite beaches to the deepest, darkest parts of the sea. Together, we can work to protect our ocean as a whole, which ultimately helps protect treasured places like Challenger Deep.
Find out how you can join Ocean Conservancy’s wave of momentum to secure a healthy ocean and a thriving planet, forever and for everyone!
The post The Mysteries of the Mariana Trench appeared first on Ocean Conservancy.