

Forests are vital for our planet. They help fight climate change by absorbing a lot of carbon dioxide from the air, acting as major carbon sinks. They store large amounts of carbon in biomass and soil, estimated to absorb about 30% of human-caused CO2 emissions annually worldwide.
However, scientists and project managers must track forest health. They need to know how much carbon forests store. This helps ensure that efforts to protect or grow forests are effective. This is called measuring, monitoring, reporting, and verifying forest carbon, often shortened to MMRV.
Eyes in the Sky: How Remote Sensing Sees Forests Differently
Measuring carbon in forests is tricky and expensive. Usually, people go out into the forest and measure trees by hand, which takes a lot of time and effort. It’s hard to do this over large areas, especially in dense or remote forests.
This is where remote sensing comes in.
Remote sensing is a way to gather information about forests without going there in person. It uses satellites, airplanes, or drones equipped with cameras and sensors. This technology can take pictures and collect data. It helps scientists learn how tall trees are, how dense the forest is, and how much carbon it might store.
There are different kinds of remote sensing data:
- Optical imagery: like normal photos taken from space or planes, showing the tops of trees and land features.
- Radar: which uses radio waves and can see through clouds and work at night.
- Lidar: which uses lasers to map the exact height and shape of trees in 3D.
The Challenge with Remote Sensing Data
Each data type has strengths and weaknesses. Optical images are good and widely available, but they can’t see through clouds and only show forest surfaces. Radar can see through clouds but has trouble measuring details in dense forests. Lidar is very accurate but expensive and covers less area.
To get the best info, scientists combine different types of data using artificial intelligence (AI) and machine learning techniques. Machine learning helps computers find patterns in huge amounts of data to make better estimates.
Meta’s Canopy Height Map: AI-Powered Forest Intelligence
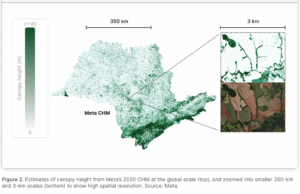
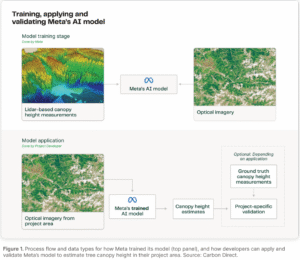
Meta developed a unique AI model that merges high-resolution satellite images with lidar data. This model maps tree canopy heights globally with great detail—less than one meter per pixel. This means it can see individual trees in many places.
The map and the AI model are open-source and freely available, so anyone can use them to help forest projects. They enable better planning, monitoring, and verification of forest carbon projects. Reza Rastegar, Senior Manager of Research Science at Meta, stated:
“When applied thoughtfully, we believe AI research and remote-sensing tools, particularly those that are open source, have the potential to revolutionize the transparency and accessibility of the carbon market.”
Meta’s model has been validated with mean absolute errors of 2.8 meters in U.S. forests and 5.1 meters in Brazil. This reflects a promising improvement in estimating canopy height at fine scales. These advanced datasets and models are helping to track natural regeneration, selective logging, and forest degradation more accurately, which is vital for credible MMRV of carbon credits.
What’s special about this model?
- It works globally with very fine detail.
- It can help identify important areas to protect or restore.
- It can make new maps for different times if good images are available.
- It helps detect small changes in forests, like selective logging (cutting some trees but not all).
- It supports methods from carbon credit standards. This is important for those who need dynamic baselining or updating project baselines with real data from nature.
RELATED: Meta and Microsoft Secured Long-Term Carbon Credit Deals to Support Olympic Rainforest
From Pixels to Carbon Credits: Turning Data into Climate Action
Forest carbon projects use different official methods to create and verify forest carbon credits. The three main methods Meta focuses on are:
- Verra VM0045 – for improved forest management (IFM).
- Verra VM0047 – for afforestation, reforestation, and revegetation (ARR).
- American Carbon Registry (ACR) IFM – a US-based improved forest management method.
Here’s how Meta’s canopy height map and AI model fit into these methods:
- In project planning, the map helps find good parcels of forest to include, determine project boundaries, and understand forest structure.
- For dynamic baselining, especially in ARR and ACR’s IFM methods, the AI model can help update baselines based on real forest growth or loss over time.
- For reversals monitoring (tracking if carbon gains are lost, e.g., due to fire or logging), the map gives better details to detect forest disturbances.
The Fine Print: What Meta’s Model Gets Right—and Where It Struggles
Many traditional satellite products can’t reliably measure forest height or biomass in dense forests or small areas. Meta’s model, because it uses very high-resolution images, helps overcome this.
Monitoring small or fragmented forests, river corridors, or areas with selective logging is crucial. These places are difficult to track using low-resolution data.
Meta’s canopy height model is a powerful tool for estimating forest structure, but it comes with limitations. It works best with high-quality imagery at 0.5–1 meter resolution. The global canopy height map uses images from 2009 to 2020. This means it might not show current forest conditions. So, there’s a need for updated maps.
Accuracy may also drop in underrepresented forest types, so local validation with field or lidar data is advised. Using the model requires significant computing power and technical expertise, which may limit adoption.
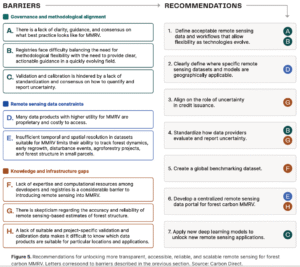
For forest carbon projects, remote sensing offers great promise but faces barriers. There is no universal agreement among registries, buyers, and developers on acceptable methods or datasets.
In addition, technical skills, computational capacity, and access to affordable, high-quality datasets remain limited. Uncertainty around accuracy—and lack of consensus on acceptable error levels—make trust and comparability difficult.
For the identified barriers, the report authors recommend the following:
Closing the Gap Between Innovation and Impact
Experts want clearer standards for how datasets can be used. They also seek better reporting on uncertainty and clearer rules for issuing carbon credits. A global benchmarking database with verified data and a central portal for quality datasets could help boost adoption.
Moreover, easier AI tools would make this process smoother. Integrating advanced models like Meta’s into accessible platforms, alongside collaborative standard-setting, will be crucial to scaling reliable forest carbon monitoring and verification.
Examples of New and Exciting Uses of Meta’s Model
- Counting trees in agroforestry projects to monitor performance.
- Mapping old-growth forests and biodiversity hotspots.
- Detecting subtle forest degradation, like selective logging.
- Monitoring reversals (losses of carbon stored) with greater accuracy.
- Supporting more accurate estimates of above-ground biomass.
Forests are vital to fighting climate change by storing carbon, but measuring how much carbon they hold and how this changes over time is tough. New technologies like remote sensing are making this easier, faster, and cheaper.
Meta’s AI-powered canopy height map is a cutting-edge tool offering very detailed, global forest height data that can help in planning, monitoring, and verifying forest carbon projects.
The post Meta’s AI Forest Map: The Game-Changer for Carbon Tracking appeared first on Carbon Credits.
Key takeaways
- SBTi is the default reference point for corporate climate action: 51% of Fortune Global 500 companies now hold net-zero targets, up from 8% in 2020, and over 11,000 organizations worldwide have SBTi-validated targets.
- Net Zero Standard V2 redefines climate leadership as reducing emissions and mitigating ongoing emissions, not reduction alone.
- The new standard adds flexibility through five-year cycles, a “best efforts” standard, and an Asset Transition Method for companies whose path to net-zero doesn’t fit a straight-line trajectory.
- Voluntary carbon credits are formally recognized for the first time, with reduction and removal credits accepted from 2027, and removals required from 2035.
- Companies with 2030 targets keep using V1 for their current cycle and move to V2 in 2028; companies without targets can start using V2 on February 1, 2027.
Why every business needs to understand the SBTi Net-Zero Standard revision
The Science Based Targets initiative (SBTi) has become the default reference point for credible corporate climate action. Net-zero targets are now held by 51% of Fortune Global 500 (FG500) companies, up dramatically from just 8% in 2020, and more than 11,000 organizations worldwide have set SBTi-validated targets.
However, SBTi’s influence extends well beyond the companies formally participating in the program. Every business in the value chain of an SBTi participant will have to reduce its own carbon emissions, and businesses that aren’t SBTi participants themselves still look to the program for guidance on climate action.
In short, SBTi gives every business a credible blueprint for climate action, and companies that follow its principles can pursue climate action with confidence, whether or not they’re formally part of the program.
How will the Net Zero Standard revision affect business climate action?
SBTi participation is expected to grow. Despite strong target-setting participation among the F500, only 17% of companies use the SBTi Net Zero Standard V1 beyond target setting, largely because its rules have been seen as too rigid to apply in practice. Much of the Net Zero Standard revision has focused on creating more flexibility to enable higher participation. Medium and small businesses will also increasingly feel pressure for climate action, since SBTi mandates that its participants reduce carbon emissions across their value chains.
Net Zero Standard V2 also redefines climate leadership: leading climate action now means reducing emissions and mitigating ongoing emissions. Reducing your own emissions while ignoring the emissions you continue to release along the way is no longer considered leadership. Supporting voluntary carbon projects with high-integrity carbon credits is now backed by the leading authority on corporate climate action.
What lessons shaped the Net Zero Standard V2 revision?
The revision reflects a few learnings about what actually drives climate progress, and how SBTi built those lessons into the new standard.
| Net Zero Standard V1 Learnings | Net Zero Standard V2 Implementation |
|---|---|
| Making real short-term progress is more important and more difficult than making big long-term promises | Focus on short-term climate progress |
| Every company has a different path to net zero that doesn’t always fit generalized net-zero rules | Create asset transition plans based on each company’s unique asset lifecycles and capital planning |
| We need to mitigate our ongoing emissions to keep global carbon emissions in check | Reduce global carbon emissions by financing voluntary carbon projects with high-integrity carbon credits |
What are the key changes between the old and new Net Zero Standard?
Both versions of the standard are grounded in net-zero by 2050. However, the old standard treated climate leadership as simply reducing emissions, expected a long-term commitment to net zero, based emission reduction targets on generalized net-zero goals, revoked status from companies that fell behind on targets, and ignored voluntary carbon projects entirely.
The new standard treats climate leadership as reducing emissions and mitigating ongoing emissions. It shifts the focus to short-term progress through five-year cycles, and it bases emission reduction targets on both the net-zero goal and a company’s own asset decarbonization plan. A new Asset Transition Method lets companies set decarbonization targets through asset plans with committed, verifiable steps; an ambitious but achievable path based on a company’s starting point, financial resources, and technology, with multiple pathways to reflect the unique opportunities and constraints of different industries and companies.
Crucially, the new standard moves to a “best efforts” basis that creates real flexibility on progress against targets. Businesses that miss their targets can keep their status if they’ve used “every lever” within their control, and minimum progress rules will be set out in the SBTi Assurance Manual.
Finally, the new standard formally uses voluntary carbon projects to mitigate ongoing emissions. From 2027 through 2034, this mitigation is recognized, and both carbon reduction and removal credits are accepted. From 2035 forward, mitigation with carbon removal credits becomes required, with durability matching between the removal and the emission it offsets.
| Old Net Zero Standard | New Net Zero Standard |
|---|---|
| Grounded in net-zero by 2050 | Grounded in net-zero by 2050 |
| Climate leadership is reducing emissions | Climate leadership is reducing emissions and mitigating ongoing emissions |
| Make a long-term commitment to net-zero | Focus on short-term progress in 5-year cycles |
| Emission reduction targets are based on net-zero goal |
|
| Businesses who fall behind targets lose status |
|
| Ignores voluntary carbon projects |
|
When does the new Net Zero Standard take effect?
Companies with existing 2030 targets should continue using the old Net Zero Standard for their current cycle, and start using the new Net Zero Standard in 2028 to set targets for the next cycle (2030–2035).
Companies that don’t yet have targets can use the new Net Zero Standard starting February 1, 2027.
What are SBTi’s Category A and Category B companies?
The new Net Zero Standard splits companies into two categories, with different requirements attached to each.
Category A covers large companies from all countries and medium-sized companies from high-income countries. A company from any country qualifies if it meets at least one of: net turnover of €450 million or more, or 1,000 or more full-time employees. A company from a high-income country qualifies if its Scope 1 and 2 emissions are 10,000 tCO2e or more, or if it meets at least two of: balance sheet of €25 million or more, net turnover of €50 million or more, or 250 or more full-time employees.
Category B covers small companies from all countries and medium-sized companies from lower-income countries.
How do Scope 1 targets work under Net Zero Standard V2?
Scope 1 targets aim to transition companies to net-zero direct emissions by 2050 or sooner, and companies can choose from three approaches.
- Absolute emissions reduction follows a straight-line emissions trajectory from the target base year to the net-zero year.
- Emissions intensity reduction lets companies follow sector-specific pathways designed to reflect the reduction opportunities available in sectors like steel, cement, or chemicals.
- Asset transition is designed for companies whose capital stock turnover doesn’t follow a linear or sector pathway. These companies design a transition plan to operate existing assets efficiently and replace them with low-carbon assets, using predetermined milestones.
How do Scope 2 targets work under Net Zero Standard V2?
Scope 2 targets address emissions from purchased electricity through three pathways:
- Reducing electricity consumption,
- Reducing grid consumption by installing onsite or direct-line offsite clean energy generation, and
- Cleaning up the regional grid using market-based tools like PPAs, RECs, and GOs that drive clean energy development.
V2 introduces a dual Scope 2 framework requiring two separate targets, with an overall goal of 100% low-carbon electricity by 2040.
The location-based target addresses the carbon intensity of a company’s physical power use, and requires companies to show that their grid consumption is falling and/or that their physical grid use is getting cleaner; in other words, that their market-based solutions are actually making the grid cleaner.
The market-based (or zero-carbon electricity) target tracks a company’s use of low-carbon power generation contracts and Energy Attribute Certificates. It requires geographical matching of these certificates with electricity consumption based on deliverability regions (grid regions); annual matching is allowed, though hourly matching is encouraged. Category A companies with large electricity loads must report the percentage of their Scope 2 electricity consumption matched with low-carbon attributes on an hourly basis, and there’s an optional recognition framework for companies that meet hourly matching thresholds.
How do Scope 3 targets work under Net Zero Standard V2?
Scope 3 targets share the same 2050-or-sooner net-zero goal, but companies set near-term targets only for material emissions sources in their value chain and areas where they have real influence. Long-term Scope 3 targets are generally not required.
Limited, justified exclusions are allowed for near-term targets, including categories that individually account for less than 5% of total Scope 3 emissions, and activities where a company lacks practical influence, like leased assets it doesn’t operationally control, or the processing of sold products. Optional exclusions are also available in specific categories.
Companies can choose from three approaches to near-term Scope 3 targets:
- An overarching emissions reduction target, which follows a linear contraction of emissions from the base year to residual emissions of 10% or less by 2050 or sooner;
- An overarching supplier/customer alignment target, benchmarked against a growing share of tier 1 suppliers and customers reaching net-zero by 2050 or sooner; or
- A category- or activity-specific target, tailored for companies with concentrated emissions in particular Scope 3 categories or high-emitting activities.
What is “ongoing emissions mitigation” under the new SBTi standard?
This is one of the most significant additions in Net Zero Standard V2. Accelerated climate contributions are needed to help the world achieve climate objectives, limit temperature overshoot, mitigate transition risks, and support the scale-up of climate solutions, and V2 formally recognizes that. Ongoing emissions mitigation runs as a parallel track to companies also reducing their own emissions.
The framework is initially voluntary, with recognition available at three contribution levels to encourage early action.
- Engaged companies address more than 1% of total Scope 1, 2, and 3 emissions.
- Advanced companies address more than 10% of total Scope 1, 2, and 3 emissions, including 100% of Scope 1 and 2 emissions.
- Leadership companies address 100% of total Scope 1, 2, and 3 emissions with a contribution budget of $80/tCO2e.
Carbon credits used for this purpose have to meet certain quality standards. They must be ex-post (issued after the mitigation has actually occurred), independently third-party-assured, emissions reductions or removals, measured in tCO2e, that occur within five years prior to the reporting year. They must be sourced from outside the company’s own value chain. Further minimum criteria will be set to align with high-integrity frameworks, with additional details on the recognition program expected in the second half of 2026.
Starting in 2035, carbon removals become mandatory for Category A companies. From that point, the carbon removal coverage requirement rises linearly from 1% of Scope 1–3 emissions to 100% by a company’s net-zero year. Within that, 10% of long-lived GHG emissions must specifically be covered by durable removals, also rising linearly to 100% by the net-zero year.
How must companies neutralize residual emissions?
At a company’s net-zero target year and thereafter, it must reduce its Scope 1, 2, and 3 emissions to zero or to residual levels, and neutralize all residual emissions using eligible carbon removals. Those removals have to meet two conditions: they must occur within the same reporting period as the residual emissions they’re neutralizing, and long-lived GHGs must be neutralized with long-lived removals, matching the durability of the removal to the atmospheric lifetime of the emission being addressed.
What is the SBTi implementation hierarchy?
Net Zero Standard V2 also lays out how companies should prioritize their actions for credible target delivery, in three tiers.
- Direct actions, at the activity level, are actions that reduce emissions at the source within a company’s own operations and value chain; things like efficiency improvements, fuel switching, and engaging suppliers and customers to reduce their emissions.
- Actions within shared systems, or activity pools that reduce the emissions of shared systems like electricity or gas grids. This includes market instruments that convey low-carbon attributes, such as PPAs, RECs, and GOs, all of which must meet minimum integrity criteria that SBTi will elaborate on in future guidance.
- Sector-level actions relate to the same type of activity occurring in a relevant geography or system, in a way that meaningfully reduces the emissions a company is responsible for.
How Terrapass helps businesses meet the new SBTi standard
As the rules around carbon credits become more rigorous, the quality of the credits behind them matters more than ever. Terrapass has expanded our global network of carbon projects: more project types, locations, prices, ICVCM CCPs, and UN SDGs, spanning super-pollutant destruction, nature-based solutions, and durable removals. We offer Green-e® Climate Certification and we only source from third-party-verified projects on ICVCM-Eligible registries.
We also help clients with impact beyond carbon: EACs, RECs, and GOs including Green-e® Certified credits that support leading renewable energy projects; water credits that support water restoration projects; and custom environmental product needs like RNG and SAF. Wherever your organization is on its sustainability journey, we help clients around the world address climate risk, advance their environmental and social goals, and get the most out of their sustainability budgets.
FAQ: SBTi Net-Zero Standard revision
What is the SBTi Net-Zero Standard?
It’s the framework the Science Based Targets initiative publishes for companies that want validated, credible net-zero targets tied to limiting global warming.
What is changing in the SBTi Net Zero Standard V2 revision?
The biggest changes are more flexibility (five-year cycles and a “best efforts” standard), a new Asset Transition Method for companies whose emissions don’t follow a straight-line path, and formal recognition of voluntary carbon credits for mitigating ongoing emissions.
When do companies need to switch to the new SBTi standard?
If your company already has 2030 targets, you keep using V1 for your current cycle and move to V2 in 2028. If you don’t have targets yet, you can start using V2 as of February 1, 2027.
Can companies use carbon credits to meet SBTi targets?
They can. Under V2, high-integrity carbon reduction and removal credits count toward mitigating ongoing emissions from 2027 through 2034. Starting in 2035, only removal credits count, and they need to be durability-matched to the emissions they offset.
What’s the difference between Category A and Category B companies under SBTi?
Category A is large companies everywhere plus medium-sized companies in high-income countries, based on thresholds like revenue, headcount, or emissions. Category B is small companies everywhere and medium-sized companies in lower-income countries.
What happens if a company misses its SBTi target?
Under the old standard, falling behind could cost a company its SBTi status. Under V2’s “best efforts” approach, a company can hold onto its status as long as it’s used every lever within its control, with minimum progress rules coming in the SBTi Assurance Manual.
Sources: This post is based on Terrapass’s internal analysis of the SBTi Corporate Net-Zero Standard V2.0. Facts and figures were checked against SBTi’s official V2.0 announcement, SBTi’s Corporate Net-Zero Standard V2.0 — Chapter 6: Ongoing Emissions Responsibility, Trellis’s coverage of the standard, Trellis’s reporting on Ongoing Emissions Recognition costs, Sylvera’s analysis of what comes next, Anthesis Group’s Fortune 500 net-zero commitments research, and Climate Impact Partners’ seventh annual FG500 analysis, as reported by CarbonUnits.com.
The post SBTi Net-Zero Standard V2: What the Revision Means for Every Business appeared first on Terrapass.
For most businesses, the emissions that matter most sit outside their own walls. Scope 3 emissions, everything generated across your value chain, from the suppliers who make your inputs to the customers who use your products, typically make up the majority of a company’s total carbon footprint. Under the Corporate Sustainability Reporting Directive (CSRD), those value-chain emissions now have to be measured and disclosed with a rigour that spend-based estimates alone struggle to satisfy. This guide sets out how to improve Scope 3 data accuracy for CSRD: the calculation methods open to you, how to move from estimates to verified supplier data, and how to govern that data so it holds up to audit.
![]()
A carbon credit is a commitment that extends well into the future. The tonne of CO₂ compensated for today from a nature-based carbon project must remain out of the atmosphere for good, which means the forest behind the credit has to remain standing long after the transaction is complete. For any buyer, this raises a defining question: What ensures that the forest endures?
![]()


-
Climate Change12 months ago
Guest post: Why China is still building new coal – and when it might stop
-
Greenhouse Gases12 months ago
Guest post: Why China is still building new coal – and when it might stop
-

 Greenhouse Gases2 years ago
嘉宾来稿:满足中国增长的用电需求 光伏加储能“比新建煤电更实惠”
-

 Climate Change2 years ago
嘉宾来稿:满足中国增长的用电需求 光伏加储能“比新建煤电更实惠”
-
Climate Change2 years ago
Bill Discounting Climate Change in Florida’s Energy Policy Awaits DeSantis’ Approval
-

 Renewable Energy9 months ago
Sending Progressive Philanthropist George Soros to Prison?
-

 Carbon Footprint2 years ago
US SEC’s Climate Disclosure Rules Spur Renewed Interest in Carbon Credits
-
Greenhouse Gases1 year ago
嘉宾来稿:探究火山喷发如何影响气候预测