

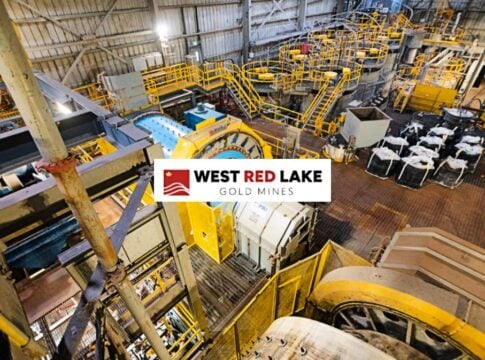
Disseminated on behalf of West Red Lake Gold Mines Ltd.
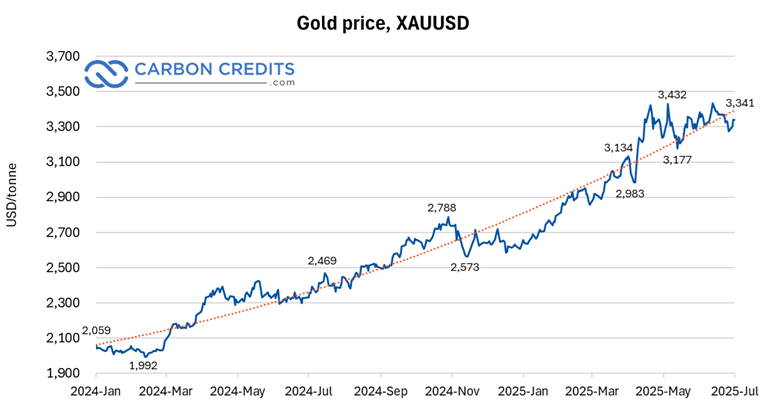
While tech stocks and rate cuts dominate headlines, gold has quietly broken out. With prices averaging near $2,900/oz in Q1 2025 and $3,290/oz in Q2, miners are seeing an earnings explosion. This rally seems to be fuelled by Western investors becoming interested in gold after the yellow metal gained 93% % from 2020 to 2025, driven by strong physical demand from Asia and central banks.
Now miners are raking in profits. And this silent bull market could be just getting started. Let’s dive deeper.
Q1 2025: Gold Miners’ Profits Explode
- Mid-Tier Miners: The top 25 companies in the GDXJ index saw revenues jump 26.8% YoY, with all-in sustaining costs (AISC) averaging $1,378/oz, leaving margins at record highs.
- Wesdome Gold Mines: Reported a 365% YoY increase in gross profit and a nearly fivefold jump in net income, as Q1 gold production rose 37% and AISC fell 17% to $1,366/oz. The average realized gold price was $2,882/oz, driving margins and cash flow to new highs.
- Newmont Corporation: The world’s largest gold miner delivered 1.5 million ounces in Q1 and a record $1.2 billion in free cash flow. With these numbers, the company stays on track to meet its 2025 targets with a strong gold portfolio for shareholders.
Newmont’s Playbook: Cheap Today, Explosive Tomorrow
Newmont is the world’s largest gold producer. It’s currently trading at about 7x earnings. This is surprisingly low given its top-tier assets and strong cash flow. But with gold at record levels and persistent macroeconomic uncertainty prompting Western investors to invest in the yellow metal and the companies that produce it, a re-rating to 15x earnings looks entirely possible, given that gold miners have been valued at 22x earnings in past gold cycles.
Let’s once again ponder the Q1 figures. For starters, Newmont generated $1.2 billion in free cash flow, and its profit hit 27%, showing operational strength.
If investors come back to gold, Newmont could lead the charge and set the tone for others.
WRLG: Junior Miner, Big Potential
Now let’s talk about West Red Lake Gold (TSXV: WRLG; OTCQB: WRLGF), a junior miner transitioning into a producer. It’s a classic under-the-radar story. But that could change.
Here’s why:
- WRLG just restarted the high-grade Madsen Mine
- It’s moving from zero revenue to cash flow
- Companies starting new gold mines can be particularly attractive for investors wanting exposure to a rising gold price because the value of new production layers on top of increased revenues
- A shift to 15x earnings isn’t crazy – it’s been done before
WRLG doesn’t need gold to go higher; it just needs to hit its own targets. If it does, investors could start to value the company as a successful new gold miner, just as the market potentially also starts to give gold miners higher valuations relative to cash flows.
Can WRLG Go from New Miner to 15x Producer?
1. Ramping up the Madsen Mine
WRLG just restarted the Madsen Mine. It now needs to ramp the operation up, from the ~60% level it started at to full scale by the end of the year. Doing this smoothly and successfully would build confidence in the Madsen Mine and support a shift towards valuing West Red Lake Gold as a producing gold miner..
2. Achieving Commercial Production
The moment WRLG poured its first gold, it shifted from a high-risk developer to a real producer. Cash flow began. The value of the operation will become clear when WRLG declares commercial production, something mines usually do after ramping up to target mining rates, and starts reporting on costs and revenues. Margins matter.
3. Getting the Market’s Attention
If WRLG delivers consistent production, it could move to a 7x earnings multiple, in line with other gold miners. The market rewards execution. WRLG just needs to stick the landing.
4. Boost from Unlocking More at Madsen
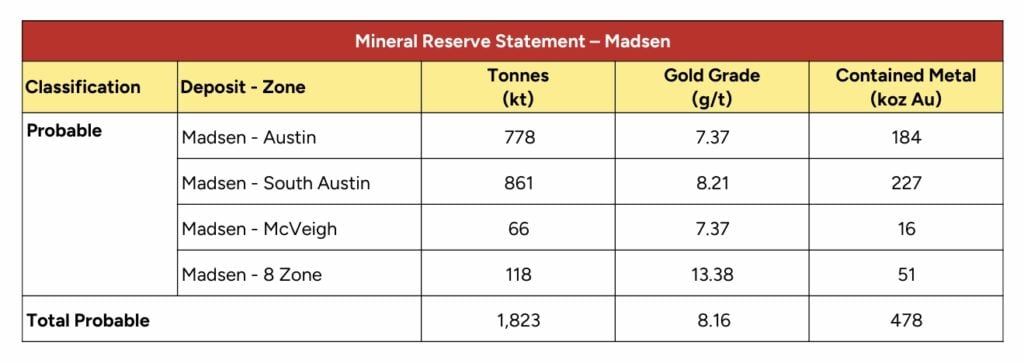
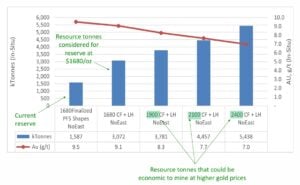
The Madsen Mine plan is a conservative plan to get the mine back in action. It outlines a nice mine – but there are multiple opportunities to unlock more value at Madsen, from using a less conservative approach and therefore, mining more of the deposit at lower costs to adding two nearby, defined, WRLG-owned deposits to the mine plan.
What Could Go Wrong?
WRLG still faces challenges, and some of them are:
- Execution risk: delays or cost overruns can hurt timelines
- Operational ramp-up: hitting production targets is crucial
- Market recognition: It takes time for investors to re-rate juniors
But these are standard hurdles for any miner. WRLG’s roadmap is clear, and management is quickly checking off milestones.
Could Underground Mining Boost WRLG’s Valuation?
Underground mining often brings higher grades and lower surface disruption—investors like that. The Madsen Mine sits in a known gold belt, giving WRLG added credibility. If the company can sustain production and control costs, it may earn the valuation premium typically reserved for proven underground producers in Top Tier jurisdictions.
Gold’s breakout has already changed the game for producers like Newmont. But the real story might be at the junior level. WRLG is flipping the switch from developer to producer, creating new value, and is working to unlock significant additional value along the way.
If gold stays above $3000, feeding big profits for gold miners, and generalist investors really start to rotate into the gold sector, a sector-wide re-rating to 15x earnings could drive significant upside. The market ignored gold’s move, but now it can’t ignore the profits.
And there are very few new gold producers like WRLG who are ready for the opportunity.
DISCLAIMER
New Era Publishing Inc. and/or CarbonCredits.com (“We” or “Us”) are not securities dealers or brokers, investment advisers or financial advisers, and you should not rely on the information herein as investment advice. West Red Lake Gold Mines Ltd. made a one-time payment of $30,000 to provide marketing services for a term of 1 month. None of the owners, members, directors, or employees of New Era Publishing Inc. and/or CarbonCredits.com currently hold, or have any beneficial ownership in, any shares, stocks, or options in the companies mentioned. This article is informational only and is solely for use by prospective investors in determining whether to seek additional information. This does not constitute an offer to sell or a solicitation of an offer to buy any securities. Examples that we provide of share price increases pertaining to a particular Issuer from one referenced date to another represent an arbitrarily chosen time period and are no indication whatsoever of future stock prices for that Issuer and are of no predictive value. Our stock profiles are intended to highlight certain companies for your further investigation; they are not stock recommendations or constitute an offer or sale of the referenced securities. The securities issued by the companies we profile should be considered high risk; if you do invest despite these warnings, you may lose your entire investment. Please do your own research before investing, including reading the companies’ SEDAR+ and SEC filings, press releases, and risk disclosures. It is our policy that information contained in this profile was provided by the company, extracted from SEDAR+ and SEC filings, company websites, and other publicly available sources. We believe the sources and information are accurate and reliable but we cannot guarantee it.
CAUTIONARY STATEMENT AND FORWARD-LOOKING INFORMATION
Certain statements contained in this news release may constitute “forward-looking information” within the meaning of applicable securities laws. Forward-looking information generally can be identified by words such as “anticipate”, “expect”, “estimate”, “forecast”, “planned”, and similar expressions suggesting future outcomes or events. Forward-looking information is based on current expectations of management; however, it is subject to known and unknown risks, uncertainties and other factors that may cause actual results to differ materially from the forward-looking information in this news release and include without limitation, statements relating to the plans and timing for the potential production of mining operations at the Madsen Mine, the potential (including the amount of tonnes and grades of material from the bulk sample program) of the Madsen Mine; the benefits of test mining; any untapped growth potential in the Madsen deposit or Rowan deposit; and the Company’s future objectives and plans. Readers are cautioned not to place undue reliance on forward-looking information.
Forward-looking information involve numerous risks and uncertainties and actual results might differ materially from results suggested in any forward-looking information. These risks and uncertainties include, among other things, market volatility; the state of the financial markets for the Company’s securities; fluctuations in commodity prices; timing and results of the cleanup and recovery at the Madsen Mine; and changes in the Company’s business plans. Forward-looking information is based on a number of key expectations and assumptions, including without limitation, that the Company will continue with its stated business objectives and its ability to raise additional capital to proceed. Although management of the Company has attempted to identify important factors that could cause actual results to differ materially from those contained in forward-looking information, there may be other factors that cause results not to be as anticipated, estimated or intended. There can be no assurance that such forward-looking information will prove to be accurate, as actual results and future events could differ materially from those anticipated in such forward-looking information. Accordingly, readers should not place undue reliance on forward-looking information. Readers are cautioned that reliance on such information may not be appropriate for other purposes. Additional information about risks and uncertainties is contained in the Company’s management’s discussion and analysis for the year ended December 31, 2024, and the Company’s annual information form for the year ended December 31, 2024, copies of which are available on SEDAR+ at www.sedarplus.ca.
The forward-looking information contained herein is expressly qualified in its entirety by this cautionary statement. Forward-looking information reflects management’s current beliefs and is based on information currently available to the Company. The forward-looking information is made as of the date of this news release and the Company assumes no obligation to update or revise such information to reflect new events or circumstances, except as may be required by applicable law.
For more information on the Company, investors should review the Company’s continuous disclosure filings that are available on SEDAR+ at www.sedarplus.ca.
Please read our Full RISKS and DISCLOSURE here.
The post Gold’s Big Comeback: Can WRLG Follow Newmont’s Path to a 15x Earnings Boom? appeared first on Carbon Credits.

EU carbon credit claims changed on 27 September 2026, the day the Directive (EU) 2024/825 began to apply across the European Union. The change is narrow. It changes how a company can talk about the credits it buys. A product can no longer be called neutral on the strength of compensation alone; however, every specific, evidenced statement about what a company measured, reduced, and funded stays fully available.

The post Promoting Improved Cooking Practices in Nigeria appeared first on Terrapass.



-
Climate Change1 year ago
Guest post: Why China is still building new coal – and when it might stop
-

 Greenhouse Gases2 years ago
嘉宾来稿:满足中国增长的用电需求 光伏加储能“比新建煤电更实惠”
-
Greenhouse Gases1 year ago
Guest post: Why China is still building new coal – and when it might stop
-

 Climate Change2 years ago
嘉宾来稿:满足中国增长的用电需求 光伏加储能“比新建煤电更实惠”
-

 Renewable Energy12 months ago
Sending Progressive Philanthropist George Soros to Prison?
-
Climate Change2 years ago
Bill Discounting Climate Change in Florida’s Energy Policy Awaits DeSantis’ Approval
-
Greenhouse Gases1 year ago
嘉宾来稿:探究火山喷发如何影响气候预测
-

 Climate Change2 years ago
Analysis: China’s CO2 falls 1% in Q2 2024 in first quarterly drop since Covid-19