Connect with us

Published

on

“Extreme” wildfires emitted more than 8bn tonnes of carbon dioxide during the 2024-25 “global fire season”, according to a new report.

The annual “state of wildfires” report from an international team of scientists finds that fires burned at least 3.7m square kilometres of land – an area larger than India – between March 2024 and February 2025.

This is almost 10% below the average annual area burned over the past two decades.

But, due to an increase in wildfires in carbon-rich forests, the CO2 emissions resulting from these fires were almost 10% above average.

The report also zooms in on four of the most prominent extreme wildfire events during this time: southern California; north-east Amazonia; South America’s Pantanal-Chiquitano region; and the Congo Basin. 

All of these events were found to have been more likely to occur as a result of human-caused climate change.

The researchers identify that, in some cases, the area burned by these fires was 25-35 times larger than it would have been without global warming.

The report also estimates that more than 100 million people around the world were exposed to wildfires in 2024 and 2025.

These fires are “reshaping lives, economies and ecosystems on a global scale”, one of the report authors, Dr Carmen Steinmann from ETH Zürich, said in a statement. 

‘Increasing extent and severity’

Scientists from dozens of institutions analyse “extreme wildfires” globally between March 2024 and February 2025 in the second annual edition of the report.

The report explains that the “March-February definition of the global fire season latest global fire season is chosen so as to align with an annual lull in the global fire calendar in the boreal spring months”.

According to the report, the authors “harness‬‭ and‬‭ adopt‬‭ new‬‭ methodologies‬‭ brought‬‭ forward‬‭ by‬‭ the‬‭ scientific‬‭ community”. They add that in future reports, they hope to “enhance the tools presented in this report to predict extremes with increasing lead times, monitor emerging situations in near-real time and explain their causes rapidly”.

In the report’s “summary for policymakers”, study author Dr Matthew Jones, from the University of East Anglia, says:

“[The report] focuses on the global extreme wildfire events of the global fire season, explains why they happened and fingerprints the role of climate change as one of the key drivers of changing wildfire risk globally.”

The authors aim to “deliver actionable information” to policy experts and wider society about wildfires, the report says.

Using satellite data, the authors find that 3.7m square kilometres (km2) of land burned globally between March 2024 and February 2025. This means that the 2024-25 fire season ranks 16th out of all fire seasons since 2002, indicating below-average burned area compared to the rest of the 21st century. 

However, the global fire emissions database shows that the 2024-25 wildfire season drove more than 8bn tonnes of CO2 emissions, according to the report. This is 10% above the average of wildfire seasons since 2002.

Jones explains that this is indicative of a trend towards “increasing extent and severity of fire in global forests, which are carbon-rich”, as opposed to less carbon-rich grassland biomes.

The chart below shows global burned area (top) and carbon emissions (bottom) during the 2024-25 wildfire season, compared to the average over 2002-24, for different world regions. Red bars indicate that the 2024-25 wildfire season had higher-than-average burned area or emissions for the given region, while blue indicates lower-than-average numbers.

Burned area, in thousands of km2 (top) and carbon emissions in teragrams of carbon.
Burned area, in thousands of km2 (top) and carbon emissions in teragrams (equivalent to millions of tonnes) of carbon (bottom) during the 2024-25 wildfire season, compared to the 2002-24 average, for different world regions and biomes. The triangles (right y-axis) indicate the percentage of the relative anomaly compared to the average. Source: Kelley et al. (2025)

Savannas, grasslands and shrublands account for more than 80% of the burned area in a typical year, with forests and croplands making up the rest.

According to the report, burned area in tropical and subtropical grasslands, savannah and shrublands‬‭ was 10% below the 2002-24 average over 2024-25, but still contributed 70% towards the total global burned area.

The 2024-25 wildfire season was the second consecutive year that African‬‭ savannahs‬‭ “experienced‬‭ a‬‭ low‬‭ fire‬‭ season”, the report notes, with below average burned area and carbon emissions.

Meanwhile, the report finds that the greatest increases in burned area and carbon emissions during the 2024-25 wildfire season were seen in the ‭Canada’s boreal‬‭ forests‬‭, the‬‭ moist‬‭ tropical‬‭ forests‬‭ in‬‭ the Amazon region, the‬‭ Chiquitano‬‭ dry‬‭ forests‬‭ of‬‭ Bolivia and the Cerrado – a tropical savannah in central Brazil.

The graphic below shows some key figures from the 2024-25 wildfire season.

Key figures from the 2024-25 wildfire season
Key figures from the 2024-25 wildfire season. Source: State of wildfires project, summary for policymakers (2025).

Study author Dr Douglas Kelley, from the UK Centre for Ecology and Hydrology, told a press briefing that the author team spent time “actively engaging with a big regional panel of experts”. 

The team identified four “focal events” – extreme wildfire events that were chosen both for the severity of the fire and the impacts on people and the environment.

For each focal point, the study authors assessed the drivers of the wildfire. They also used attribution – a field of climate science that aims to identify the “fingerprint” of climate change on an extreme event – to determine the contribution of human-caused climate change.

Finally, the authors estimated the likelihood of similar events occurring in the future as the climate continues to warm over the coming century.

Kelley told the press briefing that “capturing fires themselves can be quite tricky”, because they are affected by a range of different factors.

The report notes that wildfires are affected by changes in weather, with hot and dry weather providing the best conditions for wildfires. It adds that changes in land use are also important, as they can affect ignition.

Kelley explained that the report authors used “multiple types of attribution” to capture these different factors, using a range of fire models, weather forecasting models and land use data.

North America

In North America, 2024-25 was an “extreme” fire year, the report says.

Both burned area and carbon emissions reached their second-highest levels since records began in 2002 and 2003, respectively. Across the continent, the burned area was 35% higher than the average since 2002 and the carbon emissions were more than double the average emissions since 2003.

In Canada, 46,000km2 of land burned during the 2024-25 fire season, releasing 282m tonnes of carbon (Mt). The burned area was 85% higher than average, but the associated emissions were more than 200% higher than average, according to the report.

The report also notes that the wildfire season started early in Canada in 2024, due to earlier-than-normal snowmelt, as well as persistent, multiyear drought and “holdover fires” that reignited in the spring after smouldering through the winter months.

In the US, more than 64,000 individual wildfires contributed to a total burned area larger than 36,000km2. More than 8,000 wildfires in Mexico led to a record 16,500km2 of burned area.

The regions experiencing record or near-record burned area and carbon emissions were varied: from the Canadian tundra and the north-western US mountain ranges to California’s grasslands and Mexico’s tropical forests. In the far-northern boreal forest – which contains around 20% of the world’s forest carbon – the season trailed only the record-breaking 2023-24 fire season in burned area and associated emissions. 

The researchers select the January 2025 southern California wildfires as one of the four “focal events” of the report.

The maps below show the locations of the four focal events: southern California, the Congo Basin, north-east Amazonia and the Pantanal-Chiquitano. The colours show the percentage difference from the average burned area, with blue indicating less burned area than average and darker browns showing more burned area.

The burned area anomaly, expressed as a percentage difference from the 2002-24 average, for each of four focal events
The burned area anomaly, expressed as a percentage difference from the 2002-24 average, for each of four focal events (clockwise from top left): southern California, Congo Basin, Pantanal-Chiquitano and north-east Amazonia. The inset on each chart shows the location of the event. Blue colours indicate negative anomalies (less burned area than usual) and browns indicate positive anomalies. Source: Kelley et al. (2025)

In early January 2025, more than a dozen fires broke out in and around Los Angeles. Although January is “well outside the typical fire period”, the fires “became the most expensive wildfires ever recorded in just a few short days”, Prof Crystal Kolden – a study author and the director of the University of California, Merced’s Fire Resilience Center – wrote in the report. 

The two largest fires, named the Palisades fire and the Eaton fire, resulted in at least 30 deaths, more than 11,500 homes destroyed and more than 153,000 people being evacuated from their homes.

The fires resulted in estimated economic losses of $140bn, placing “substantial pressure on the already volatile home insurance market in California”, according to the report. It notes that the fires also contributed to the “housing and affordability crisis” in southern California.

The report says that the severity of the January fires was largely due to intensifying extremes in the water cycle – an unusually wet period that allowed vegetation to flourish, followed by an unusually arid winter that dried out that vegetation, turning it into fuel. It notes:

“Between 5 and 25 January, favourable weather, fuel availability and ignition sources aligned, leading to create ideal conditions for ignition and rapid fire spread.

“The substantial suppression efforts deployed is unaccounted for in our modelling framework and could be one of the possible reasons the fires did not escalate even further.”

Previous attribution analysis found that the January 2025 fires were “likely influenced” by human-driven climate change. The report authors also find that the burned area in the southern California event was 25 times greater due to climate change.

However, whether extreme fire activity in southern California continues to intensify depends largely on how the region’s plants and trees respond to increased atmospheric CO2, the report says. It also notes that climate models disagree as to whether wintertime rainfall will increase or decrease in future climates.

South America

The report finds that South America had a total area burned by wildfires of 120,000km2 during the 2024-25 fire season – 35% higher than average.

That translated into the release of 263Mt of carbon – the “highest carbon emissions on record for the continent” and 84% above average, the report says.

Jones, a study author, said in a press briefing that South America “hasn’t seen carbon emissions like this on record before”.

The report underlines that South America’s fire season was “unprecedented” in many ways, such as fire extent, emission levels, intensity and their impacts on society and the environment, although not in the number of fires.

For example, fires in the north-east Amazon impacted air quality, crops, houses and native vegetation, affecting people living in the region, including Indigenous peoples such as the Yanomami, the report says.

Laercio Fernandes, a volunteer firefighter and Indigenous man, holds a shell of a turtle found dead after a forest fire hit the Kadiwéu Indigenous land, in Mato Grosso do Sul, Brazil, in 2024.
Laercio Fernandes, a volunteer firefighter and Indigenous man, holds a shell of a turtle found dead after a forest fire hit the Kadiwéu Indigenous land, in Mato Grosso do Sul, Brazil, in 2024. Credit: Diego Cardoso / Alamy Stock Photo

The country with the largest area burned by wildfires during the 2024-25 fire season was Brazil, with a total burned area of 243,000km2, followed by Bolivia, with a total of 107,000km2 of burned area, and Venezuela, with a total of 43,000km2 of burned area.

The most-affected biomes in the region were the Amazon rainforest, with 47,000km2 of wildfires above the average since 2002.

Second was the Chiquitano and Chaco dry forests – encompassing parts of Bolivia, Brazil, Paraguay and Argentina. These biomes experienced a “record-breaking” fire season with more than 46,000km2 of burned area. These fires resulted in 100Mt of carbon emissions – six times higher than the average since 2003.

More than 46,000km2 of the Pantanal – the largest tropical wetland located in Brazil, Bolivia and Paraguay – burned in 2024-25, with associated carbon emissions of 67Mt above the average.

According to the report, fire activity in the region was primarily driven by “anomalous dry weather”.

In the north-eastern Amazon, the severity of the fire season between January and April 2024 was compounded by natural sources of climate variability, such as El Niño and the Atlantic Meridional Mode, which contributed to very high temperatures and absence of rainfall. There, deep soil moisture dropped to 1%.

Meanwhile, in Pantanal and Chiquitano, “extreme dry weather” since 2023 and “multiple years of below-average rainfall” contributed to the severe fires, the report says. Study author Dr Francesca Di Giuseppe said in a briefing that the “wet season that usually happens between February and May failed completely to recharge the soil that kept completely dry and this drove most of the fire season” in the region.

The authors conduct an attribution analysis and find that the fire weather conditions in the north-eastern Amazon that season were “significantly more likely” due to climate change. In the Pantanal and Chiquitano, the conditions were 4.2-5.5 times more likely due to climate change.

Africa

Overall, the scale of fires across Africa was “well-below average” in 2024 and 2025, the report finds, except in certain areas, including the Congo Basin, northern Angola and South Africa.

In 2024, a record-high amount of land was burned in the Congo Basin – a biodiverse region in central Africa spanning six countries that holds the world’s second-largest tropical forest. This burned area was 28% higher than the annual average and there were 4,000 fires in total, 20% more than usual, in 2024. 

Fires also caused “hazardous” air pollution and contributed to the Congo Basin’s highest loss of primary forest in a decade.

The analysis in the report finds that it is “virtually certain” that human-caused climate change contributed to the extreme fire weather in this region in July and August 2024.

The hot, dry and windy conditions were 3-8 times more likely to occur as a result of climate change and the area scorched by fires was three times greater than it would have been otherwise, the findings show.

Climate change has also driven an increase of more than 50% in the average annual burned area in the Congo Basin, which the researchers say is “one of the most robust signals of climate influence” in the fire trends they analysed.

Drought was a major factor behind the fires, the report finds, and water stress is expected to be the main driver shaping future fires in the Congo Basin.
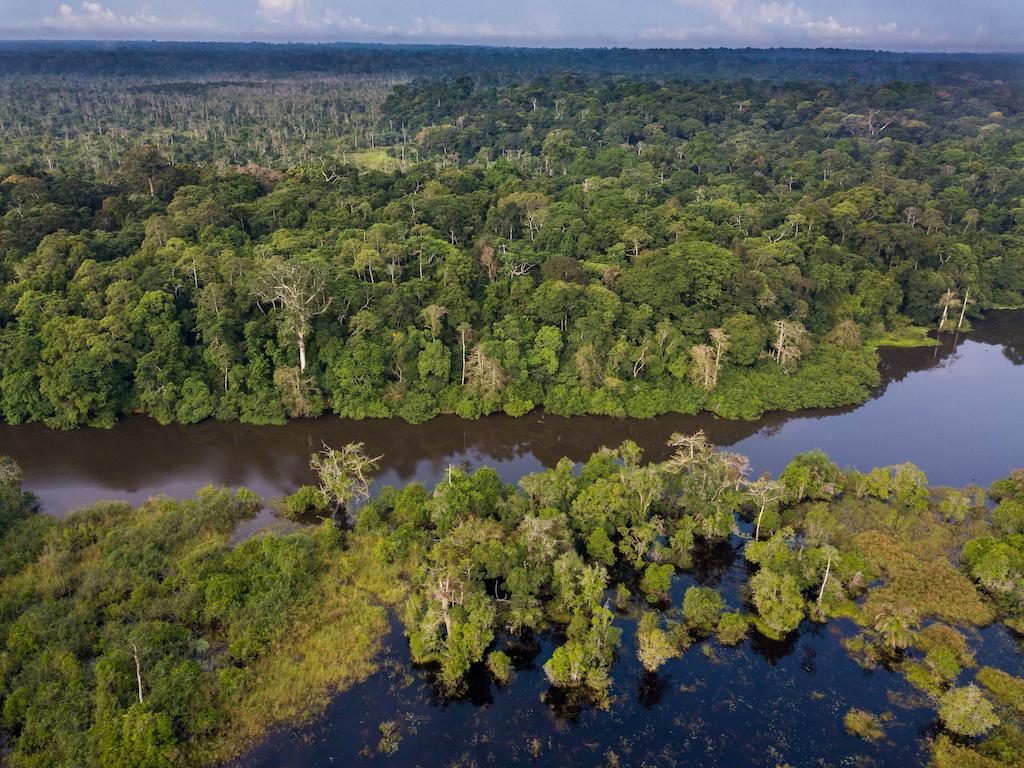
Congo rainforest along Rembo Ngowe river in Akaka, Loango National Park, Gabon.
Congo rainforest along Rembo Ngowe river in Akaka, Loango National Park, Gabon. Credit: Lee Dalton / Alamy Stock Photo.

These fires are “part of a long-term trend of increasing fire encroachment into African moist forests, driven by climate change and human pressure”, says Prof Michael Wimberly, a professor at the University of Oklahoma who was not involved in the report, but has researched wildfires in Africa. He tells Carbon Brief: 

“The increased fire activity in the Congo Basin is troubling because of the vast expanses of unfragmented forests and peatlands that store massive amounts of carbon, provide habitat for threatened species and supply vital resources to local populations.”

The report notes that there is “sparse reporting and poor media coverage” on the impacts of fires in the Congo Basin in 2024, despite millions of people being impacted.

In South Africa, 34 people were killed and thousands of livestock and homes were destroyed in fires last year. In Ivory Coast, 23 people were killed and 50km2 of land was burned.

Dr Glynis Humphrey, a postdoctoral research fellow at the University of Cape Town, who was not involved in the study, adds that a below-average burned area across Africa “does not necessarily indicate a decline in fire risk or impact”. She tells Carbon Brief: 

“In some ecosystems, fewer but more intense fires are being observed, which can still have severe ecological and atmospheric consequences.”

Using climate models, the researchers project that fires to the extent of those in the Congo Basin last year could occur up to 50% more often by 2100, under a medium-emissions pathway. 

The region is also projected to see more increases in extreme wildfire risk by the end of this century. Gabon, Equatorial Guinea and the central part of the Democratic Republic of the Congo could see some of the largest increases in burned area, which, the report estimates, could double or quadruple in some cases. 

Humphrey notes that fire patterns are “shifting” in response to climate change, which is “leading to significant consequences for ecosystems that don’t typically burn – like the forests in the Congo Basin”. She tells Carbon Brief:

“This is of concern, as primary forests harbour critical biodiversity that supports ecosystem functioning and provide services to people…These forests are also sanctuaries for endangered species.”


The post Global wildfires burned an area of land larger than India in 2024 appeared first on Carbon Brief.

Global wildfires burned an area of land larger than India in 2024

Continue Reading

Climate Change

Energy Vampires: the AI data centres draining Australia

Published

on

A new report from Greenpeace Australia Pacific and independent expert Ketan Joshi reveals how the frenzied rollout of AI data centres in Australia is set to derail the renewable energy transition, entrench gas and turbocharge climate pollution, prompting calls for an urgent moratorium on data centre approvals until appropriate guardrails are in place.

The frenzied rollout of AI data centres in Australia is rushing through massive new projects, which will derail Australia’s energy transition unless the government urgently intervenes.

Greenpeace campaigner Solaye Snider at the site of the proposed Mamre Rd data centre with a banner saying "Data centres = energy vampires"
Greenpeace campaigner Solaye Snider at the site of the proposed Mamre Rd data centre in Sydney. If approved, the data centre will be the biggest in Australia and will generate peak annual grid emissions equivalent to that produced by 560,000 petrol cars. © Toby Davidson / Greenpeace

Key findings

  • The frenzied rollout of AI data centres in Australia is rushing through massive new projects, which will derail Australia’s energy transition unless the government urgently intervenes. Our conservative assumptions mean this impact is understated, in this analysis.
  • Australia’s biggest proposed data centre, the 1GW Mamre Road Data Centre Campus in Western Sydney, will generate peak annual grid emissions equivalent to that produced by 560,000 petrol cars for a year or all domestic flights within NSW in 2023.
Bitcoin Big Horn Data Center in Hardin, Montana. © Janie Osborne / Greenpeace
The Big Horn Data Hub and the Hardin Generating Station in Hardin, Montana. © Janie Osborne / Greenpeace
  • Data centres already fail to cover their own emissions with new renewables and their rollout will dramatically hold back Australia’s energy transition.
  • No data centre operator analysed in this report adequately proves their claim of driving Australia’s renewable energy growth. Claims they are doing this through truly “additional” new power purchasing agreements for renewable energy are unsubstantiated.
  • There are early signs of a data centre-fuelled gas boom in Australia, which will come with massive, nationally significant climate costs. For example, the Tamboran proposal for the Northern Territory would effectively double the state’s emissions. In NSW, Cloud Carrier’s proposed gas-fired project would wipe out NSW’s entire projected 2028 emissions cuts.

  • Even if only 1 in 4 new Australian data centres were powered by new on-site gas, it would result in 2.8x higher total emissions compared to using grid power.
  • New analysis shows that on-site gas for data centres globally could fuel emissions that exceed Brazil’s total power grid emissions by 2030.
  • Fossil fuel corporations are quietly joining the data centre lobby group as members, and sponsoring and attending technology industry conferences. The two industries are reinforcing each other’s talking points and PR spin.
Clean Our Cloud Action in Seattle. © Greenpeace © Greenpeace
Clean Our Cloud Action in Seattle. © Greenpeace
  • Data centre operators do not disclose the customers of an individual facility, the purpose of the computations performed there, or site-specific energy consumption, despite the industry’s defense of its ‘critical infrastructure’ status or claims of transparency. It is a matter of public record that AI is being used for abuse, war and other human rights violations.
  • Data centres can be ‘right sized’ through community ownership schemes, well-deployed AI software and strict moratoria to allow for democratic governance of this industry.
An aerial view of the Facebook Data Center in Forest City. The 150-acre facility is the second Facebook-built data center in the United States. © Greenpeace

This report recommends:

  • An urgent moratorium on data centre development until safeguards are legislated
  • Binding, legislated standards for AI development, including substantiated claims of additional renewable energy
  • Full disclosure of services delivered, emissions, finances and energy use, per project
  • Full assessment of compliance with human rights frameworks

Lead author: Ketan Joshi is an independent climate, environment and sustainability expert. He was the lead author on “The AI Climate Hoax”, published with several corporate accountability and environmental groups in 2026, and previously wrote “Windfall: Unlocking a Fossil Free Future” with the University of New South Wales Press. He worked for eight years in Australia’s renewable energy sector (corporate and government), and has worked with European NGOs working on climate communications and corporate accountability.

Energy Vampires: the AI data centres draining Australia

Continue Reading

Climate Change

Residents Wrangle Over Transmission Line Proposal for Rural Virginia

Published

on

Valley Link would connect a potential nuclear reactor and fossil fueled-powered plants to serve suburban data centers.

GOOCHLAND, Va.—Deborah Blackburn leaned on her cane in a line to enter the Central High Cultural and Educational Complex, angst-ridden over a giant transmission line proposal for reasons that are common refrains here: It’s all to benefit data centers in Northern Virginia, and it will disrupt the rural character here outside Richmond.

Residents Wrangle Over Transmission Line Proposal for Rural Virginia

Continue Reading

Climate Change

Analysis: China’s new carbon metric leaves Germany-sized gap in its emissions

Published

on

A major change in the way that China measures its core climate goal has effectively halved the growth in the country’s carbon dioxide (CO2) emissions over the past five years.

The revised measure of “carbon intensity”, the amount of CO2 per unit of economic output, implies that China’s emissions have only gone up by 7% from 2020-2025.

This is just half of the 14% rise indicated by previous official statistics.

On paper, the revision creates a gap of 700m tonnes of CO2 (MtCO2) per year, equivalent to the total emissions of Germany or South Korea.

While China has never officially defined how it measures carbon intensity, it has now made what appears to be a retrospective change, with the effect of making targets easier to meet.

The shift means that China officially came close to meeting its carbon-intensity target for 2020-2025, whereas official statistics had previously pointed towards falling well short.

The new definition of carbon intensity has not been made public, but plausible approaches to calculating the metric do not seem to be sufficient to explain the Germany-sized gap.

The apparent gaps or inconsistencies in China’s new carbon accounting also mean that China could meet its international climate pledges for 2030, even if its emissions go up, whereas the previous measure would have required them to fall.

This article explains how the metric appears to have shifted, what changes might potentially explain the revision and what the revised measure implies for China’s climate goals.

Measuring carbon intensity

Reducing carbon intensity – CO2 emissions per unit of GDP – has been China’s key climate commitment since the Copenhagen climate conference in 2009.

At that time, the country pledged to cut its carbon intensity to 48% below 2005 levels by 2020. This was followed up by a 2030 target of a 60-65% reduction, announced in 2014, which was then upgraded to more than 65% in 2021.

Since carbon intensity was made a key progress indicator in China’s 14th five-year plan for 2021-25, the country has reported reductions in carbon intensity every year in its statistical communique, issued at the end of February.

Neither China’s international climate pledges (its nationally determined contributions, NDCs) nor other official documents have ever set out a definition of carbon intensity, despite it being a cornerstone of the country’s climate commitments.

However, until this year, it was possible to closely reproduce the reported numbers, based on a straightforward interpretation of what carbon intensity means.

But the types of emissions that are included in the carbon-intensity metric have now changed.

Previously, it was possible to reproduce the reported carbon-intensity data by combining official GDP data with estimates of emissions from the use of fossil fuels. The latter could be estimated based on the officially reported consumption of coal, oil and gas, multiplied by China’s official emissions factors for the CO2 per unit of energy from each fuel.

The previous carbon-intensity measure apparently included emissions from the use of fossil fuels to generate energy, as well as their use as chemical feedstocks, so-called “non-energy uses”. However, it did not include non-fossil fuel CO2 emissions from industrial processes, such as the production of cement, as shown by the “old scope” in the figure below left.

Chart showing that China has changed the scope of its carbon-intensity metric
Old and new scopes of China’s CO2 emission reporting from fossil-fuel use and industrial processes. Source: Analysis for Carbon Brief by Lauri Myllyvirta. See “about the data” for further details.

Based on the annually reported progress against this old scope, China’s carbon intensity had fallen by a total of 12.4% from 2020-2025.

This was well short of the 18% target set for these years under the 14th five-year plan.

In September 2025, Huang Runqiu, head of the Ministry of Ecology and Environment, acknowledged this gap, saying that meeting China’s carbon-intensity targets had become “more challenging” due to the effects of the Covid-19 pandemic and trade tensions.

Yet the 15th five-year plan, published in March 2026, reported that China had cut its carbon intensity by 17.7% over the same period – just shy of the 18% target.

As such, it is clear that there has been a major shift in the way that China measures its carbon intensity, specifically in terms of which types of emissions are included.

Moreover, the revised numbers imply that – rather than missing it by a large margin – China officially came close to meeting its carbon-intensity target for the 14th five-year plan.

A footnote in China’s latest statistical communique offers a brief description of carbon intensity as relating to the CO2 emissions from “energy activities and industrial production”.

This indicates that the carbon-intensity calculation now includes industrial process emissions and excludes non-energy uses of fossil fuels, shown by the “new scope” in the figure above.

In comments sought by Carbon Brief, Ryna Cui, associate research professor at the University of Maryland School of Public Policy, who was not involved in the analysis, agrees that the changes to the carbon-intensity methodology are “unclear”. However, she notes that “limited data” makes it challenging to fully verify the nature and impact of the changes.

The revision mirrors a recent change made to the way that China measures its “energy intensity”, the energy use per unit of economic output. In 2024, energy intensity was changed to exclude non-energy use of fossil fuels and energy use from non-fossil fuels.

This exclusion also created a major incentive for expanding the chemical industry and the non-energy use of fossil fuels.

As for the change in carbon-intensity metric, this follows the highly energy-intensive pattern of economic growth during and after the Covid-19 pandemic and China’s “zero-Covid” policy.

Germany-sized gap

The shift in the way that China is measuring its carbon intensity has implications for estimates of the country’s emissions, which are only reported officially some years later.

Changes in carbon intensity and GDP are reported far more quickly – and can be used to estimate changes in China’s CO2 emissions.

China’s total emissions from energy and industrial processes were 11.2bn tonnes of CO2 (GtCO2) in 2020. Based on the originally reported changes in carbon intensity and GDP, its fossil-fuel CO2 emissions had grown 14% by 2024, an increase of 1,430m tonnes (MtCO2).

In contrast, the newly reported carbon-intensity figures imply that China’s CO2 emissions only grew by 7% between 2020 and 2025, up just 690MtCO2, as shown by the figure below.

The gap between these figures amounts to 730m tonnes of CO2 (MtCO2), equivalent to the annual emissions of Germany or South Korea.

Chart showing that China's new carbon metric leaves Germany-sized gap in emissions
Estimated annual changes in China’s CO2 emissions, relative to 2020=100. Blue line: Estimate based on originally reported changes in carbon intensity. Red: Based on changes reported in 2026. Source: Analysis for Carbon Brief by Lauri Myllyvirta. See “about the data” for further details.

On paper, therefore, the change in the carbon-intensity metric effectively halves the rate of growth in China’s CO2 emissions over the past five years.

Decoding the new carbon-intensity methodology

The change in the carbon-intensity metric could have other significant implications, explored below, making it important to understand how it is being calculated.

Yet, while there are some indications of what the new approach entails, these changes do not seem to account for the magnitude of the revision.

The new scope includes industrial-process emissions. One of the largest sources of these emissions, the cement industry, has been contracting due to a slowdown in real estate and infrastructure construction.

This reduction in emissions is one reason why China’s carbon intensity has improved more quickly under the new scope than under the old one.

In addition, the new scope excludes non-energy use of fossil fuels – largely relating to the chemicals industry – where there has been rapid growth over the past five years.

This is another factor in carbon intensity improving faster under the new scope.

Indeed, China’s chemicals industry drove more than half of the growth in its total fossil-fuel use in the past five years, including 40% of coal use and all of oil use. As a result, non-energy use reached 13% of the total consumption of fossil fuels in 2025, up from 7% in 2020, after growing at an average annual rate of 13%.

The figure below illustrates the impact of these changes in scope. It shows the change in China’s emissions from 2020-2025 due to the use of fossil fuels for energy, its industrial-process emissions and non-energy use of fossil fuels.

The first few rows show changes based on the consumption of fossil fuels overall, amounting to a combined 1,430MtCO2 rise in emissions.

This compares with the 690MtCO2 rise implied by the new carbon-intensity metric, leaving that Germany-sized 730MtcO2 gap in emissions. The new scope explains some of this gap.

In terms of industrial processes, the 30% fall in cement production could account for a 300MtCO2 fall in China’s CO2 emissions. In addition, the amount of carbon stored in products, such as plastics, asphalt and rubber, could account for an estimated 100MtCO2 fall in emissions.

On the other hand, emissions from the incineration of plastics increased by an estimated 40% and from metals industry processes by 10%, with aluminium production having expanded by 21%. Together, these would have increased emissions by an estimated 60MtCO2.

In total, the changes in emissions from fossil-fuel use, industrial processes, carbon retained in products and waste incineration add up to a combined 1,070MtCO2 rise from 2020-2025, shown in the penultimate row of the figure below.

Again, this revised total – based on the change in scope of the carbon-intensity metric – goes some way to explaining the Germany-sized gap in China’s CO2 emissions.

However, the new carbon-intensity figures imply that China’s CO2 emissions only increased by 690MtCO2, as shown in the final row of the figure below. This leaves a residual gap of around 380MtCO2, which does not appear to be accounted for by the data available.

Chart decoding China's new carbon-intensity metric
Changes in China’s emissions by source from 2020-2025, MtCO2. Source: Analysis for Carbon Brief by Lauri Myllyvirta. See “about the data” for further details.

One way to make the numbers add up would be to assume that the amount of carbon embedded in chemical-industry products has increased by the equivalent of 500MtCO2.

However, the reported output of major chemical-industry products cannot account for this level of embedded carbon. The figure below shows that the increase in output of major chemical products only explains around a 110MtCO2 increase in retained carbon.

Much of the increase in the production of plastics was cancelled out by a contraction in the use of bitumen for asphalt, due to lower road-building activity.

Chart showing that a growing number of carbon is being stored in manufactured products
The amount of carbon retained in products from 2005-2025, MtCO2. Source: Analysis for Carbon Brief by Lauri Myllyvirta. See “about the data” for further details.

Furthermore, the 14th five-year plan for 2021-25 had a target of raising the share of waste incineration to 65% of urban residential waste treatment capacity, up from 45% in 2020.

So, while plastics production did go up, resulting in increased amounts of retained carbon, a larger share of this retained carbon was being incinerated, meaning its carbon would quickly be released back into the atmosphere.

One reason why carbon retained in products has grown more slowly than the amount of fossil fuels used in chemicals production is that the fastest growth has been in the coal-based chemicals industry.

Coal-based processes have a much lower conversion efficiency than oil- and gas-based production, with process emissions that are typically multiple times as high.

For example, these emissions are 10 times as high for the production of olefins – a key plastics feedstock – from coal as compared with oil or gas. The process is reported to require 3.75 tonnes of standard coal per tonne of product. This implies that only 30% of the carbon in the coal is retained in the product, with the other 70% being emitted in the process.

There are also chemical processes that use fossil fuels as a feedstock, but where the end product does not contain carbon. One example is ammonia, a key building block for fertiliser, where production grew by 52% from 2020 to 2025.

Neither the change in scope of the carbon-intensity calculation, nor the change in the amount of carbon retained in products, is sufficient to explain the size of the revision in the newly reported numbers. There must be another explanation.

There are two options. Either the new scope broadly aligns with what is outlined above, but also excludes a subset of the CO2 emissions. Or the scope does not exclude any of the CO2, but there are gaps in the monitoring of some energy or industrial-process emissions.

Either explanation would mean that China is not accounting for some of its CO2 emissions. It would also mean that the improvement in carbon intensity for 2020-2025 is over-reported.

China’s latest officially reported emissions inventories reinforce the second of the two options above, namely, that there are gaps in emissions reporting from the chemical industry.

From 2018 to 2021, the latest year for which China has reported on its emissions, the CO2 output of chemical-industry processes only increased by 13%. Over the same period, non-energy use of fossil fuels increased by 29%, according to data reported to the International Energy Agency by the Chinese government.

One factor in these apparent gaps could be that China’s National Bureau of Statistics (NBS) is required to publish data on carbon intensity very quickly, since it is a key indicator in the country’s five-year plans.

On the other hand, detailed greenhouse gas emissions inventories and energy statistics are only published years later, by the environment ministry and NBS, respectively.

What the change means for China’s targets

The change in the definition of carbon intensity has the effect of weakening China’s climate targets and introducing more uncertainty into tracking progress.

On the basis of China’s new numbers, it will require less effort to hit the 2030 target for a 65% reduction in carbon intensity on 2005 levels, as per China’s Paris pledge.

This target can now be met even if CO2 emissions go up between 2025 and 2030, whereas the previous metric would have required a reduction.

It will also require less effort to hit the 17% target in the 15th five-year plan.

The apparent gaps in the CO2 emissions numbers for 2025 could affect the delivery of China’s other key climate pledges, such as the commitment to peak CO2 emissions before 2030. They could also allow the chemical industry’s CO2 emissions to continue climbing rapidly, while still officially meeting the 2030 goals for CO2 intensity.

Moreover, the apparent gaps or inconsistencies in China’s new carbon accounting also mean that China would be able to officially meet its target to peak its CO2 emissions by 2030, even if its overall CO2 emissions do not actually reach a peak.

The apparent gaps could also affect the delivery of China’s newer target to cut its greenhouse gas emissions to 7-10% below peak levels by 2035 and beyond.

Nevertheless, researchers and analysts can still monitor progress by calculating China’s CO2 emissions independently.

China’s reporting on fossil-fuel consumption, the output of plastics and other carbon-containing products, as well as manufacturing of commodities with substantial process emissions, provides a basis for tracking emissions under the new scope.

While under the UN’s climate framework China is free to use any definition it wants to meet its own nationally determined climate pledges, retrospective changes to methodology or inconsistent accounting could erode the value of the country’s commitments.

Moreover, it will, ultimately, have to close any gaps in its emissions data and reporting, under the transparency rules of the Paris Agreement.

China’s next transparency report to the UN, due by the end of this year, should also provide more clarity on the methodology and data underlying the revised numbers.

This underscores the importance of monitoring, reporting and verification for industrial process emissions. “Mass balances” based on fossil-fuel consumption and product output could be used as a check on CO2 emissions reporting. Finally, China’s emissions data could also be made more granular and clearly defined.

Carbon Brief has approached the National Bureau of Statistics and Ministry of Ecology and Environment for comment.

The University of Maryland’s Cui tells Carbon Brief that in general, China’s climate goals are “improv[ing]” in terms of their coverage and scope. However, she adds:

“The issue is…the ambiguity and inconsistency in the coverage, definition and method between target setting and progress tracking, which can lead to large uncertainties and room for manipulation. It highlights the importance of transparency in national climate targets, following the UNFCCC’s international transparency framework, which should also be applied as best practices for domestic targets.”

About the data

The calculations in this analysis are based on China’s total coal, oil and gas consumption from energy statistical yearbooks covering the years until 2023, with data for 2024 and 2025 taken from the latest statistical communiques.

“Originally reported” CO2 emissions were back-calculated from carbon-intensity reductions and GDP growth given in annual statistical communiques. The revised emissions for 2020, 2024 and 2025 are similarly back-calculated from the reductions in carbon intensity from 2020 to 2025 and from 2024 to 2025, as reported in the 15th five-year plan outline and the 2025 statistical communique, respectively, combined with annually reported GDP growth.

Cement process emissions up to 2024 are from Robbie Andrews’ estimates, scaled to 2025 based on year-on-year change in total cement output.

Process emissions from the metals industry are based on calculating emissions for aluminium, silicon, lead, zinc and crude steel from the bottom-up, using industrial output data and IPCC default emission factors scaled to the reported total in 2021. For steel, the calculations are based on typical quicklime use in basic-oxygen and electric-arc furnaces.

Emissions from the incineration of plastics are based on a peer-reviewed estimate of plastics incineration in 2022, combined with growth rates in the overall power generation from waste-to-energy plants. The analysis assumes that the share of plastics in the energy content of the incinerated waste stayed constant over this period, which is a conservative assumption given the rapid rise in plastics production.

Total non-energy use of fossil fuels in 2020, 2024 and 2025 is available from an NEA data release, with data for 2021-2023 found in the China energy statistical yearbook 2025.

The mix of coal, oil and gas within non-energy use is based on the energy statistical yearbook data up to 2023, with the increase in coal in 2024 and 2025 based on Wind Financial Terminal data on coal consumption in the chemical industry. Gas use, which is relatively minor, is assumed to have grown on trend and oil is calculated as the residual.

Primary plastics, rubber, and urea output data are from NBS industrial statistics. The production of solvents, lubricants and waxes, as well as the use of bitumen in construction, is from energy statistical yearbooks. The analysis assumes no change in output from 2023 to 2025, given the lack of clear trends.

The post Analysis: China’s new carbon metric leaves Germany-sized gap in its emissions appeared first on Carbon Brief.

Analysis: China’s new carbon metric leaves Germany-sized gap in its emissions

Continue Reading

Trending

Copyright © 2022 BreakingClimateChange.com