

A major change in the way that China measures its core climate goal has effectively halved the growth in the country’s carbon dioxide (CO2) emissions over the past five years.
The revised measure of “carbon intensity”, the amount of CO2 per unit of economic output, implies that China’s emissions have only gone up by 7% from 2020-2025.
This is just half of the 14% rise indicated by previous official statistics.
On paper, the revision creates a gap of 700m tonnes of CO2 (MtCO2) per year, equivalent to the total emissions of Germany or South Korea.
While China has never officially defined how it measures carbon intensity, it has now made what appears to be a retrospective change, with the effect of making targets easier to meet.
The shift means that China officially came close to meeting its carbon-intensity target for 2020-2025, whereas official statistics had previously pointed towards falling well short.
The new definition of carbon intensity has not been made public, but plausible approaches to calculating the metric do not seem to be sufficient to explain the Germany-sized gap.
The apparent gaps or inconsistencies in China’s new carbon accounting also mean that China could meet its international climate pledges for 2030, even if its emissions go up, whereas the previous measure would have required them to fall.
This article explains how the metric appears to have shifted, what changes might potentially explain the revision and what the revised measure implies for China’s climate goals.
Measuring carbon intensity
Reducing carbon intensity – CO2 emissions per unit of GDP – has been China’s key climate commitment since the Copenhagen climate conference in 2009.
At that time, the country pledged to cut its carbon intensity to 48% below 2005 levels by 2020. This was followed up by a 2030 target of a 60-65% reduction, announced in 2014, which was then upgraded to more than 65% in 2021.
Since carbon intensity was made a key progress indicator in China’s 14th five-year plan for 2021-25, the country has reported reductions in carbon intensity every year in its statistical communique, issued at the end of February.
Neither China’s international climate pledges (its nationally determined contributions, NDCs) nor other official documents have ever set out a definition of carbon intensity, despite it being a cornerstone of the country’s climate commitments.
However, until this year, it was possible to closely reproduce the reported numbers, based on a straightforward interpretation of what carbon intensity means.
But the types of emissions that are included in the carbon-intensity metric have now changed.
Previously, it was possible to reproduce the reported carbon-intensity data by combining official GDP data with estimates of emissions from the use of fossil fuels. The latter could be estimated based on the officially reported consumption of coal, oil and gas, multiplied by China’s official emissions factors for the CO2 per unit of energy from each fuel.
The previous carbon-intensity measure apparently included emissions from the use of fossil fuels to generate energy, as well as their use as chemical feedstocks, so-called “non-energy uses”. However, it did not include non-fossil fuel CO2 emissions from industrial processes, such as the production of cement, as shown by the “old scope” in the figure below left.
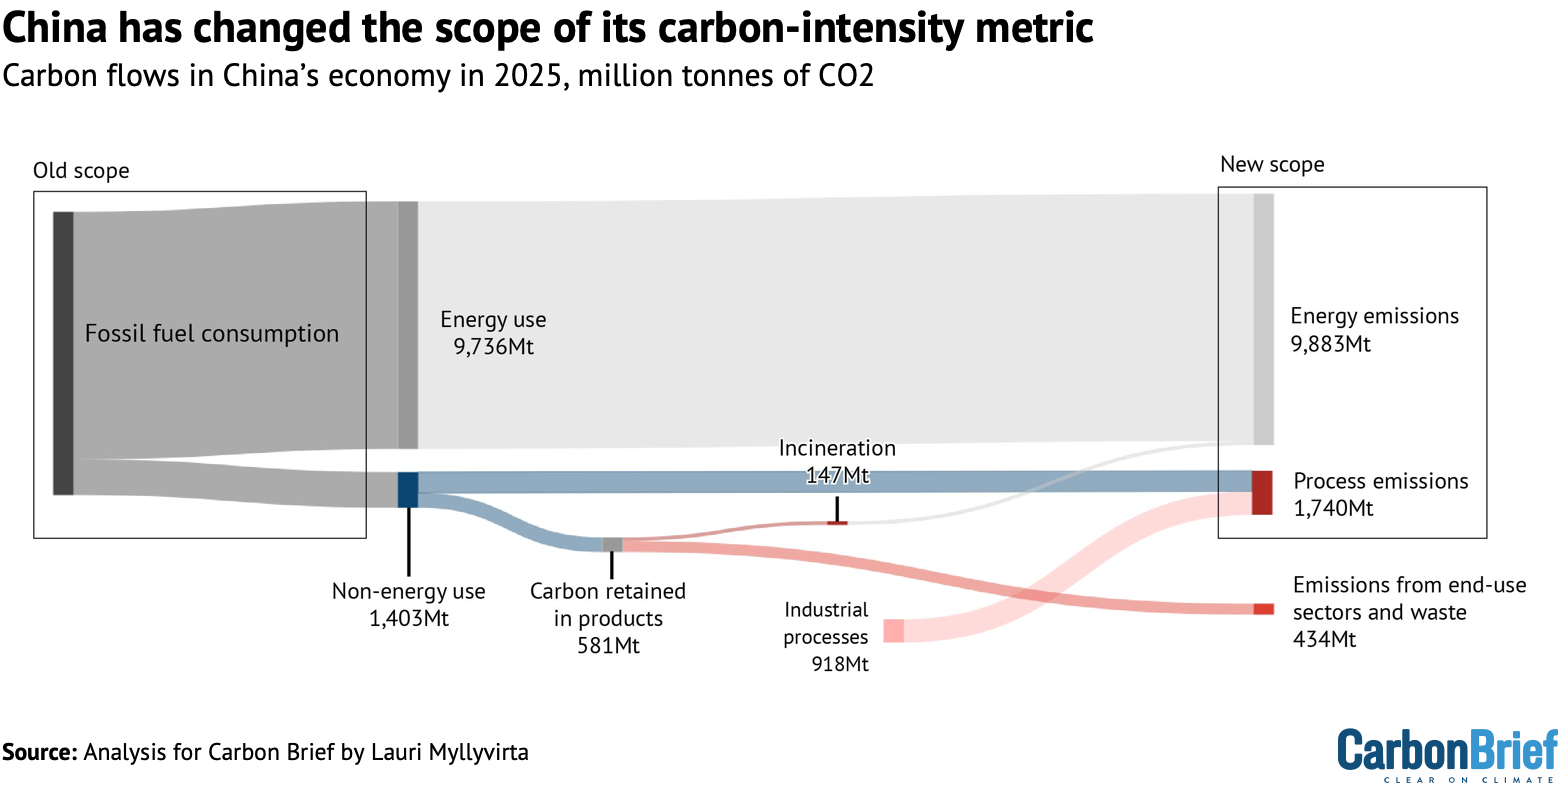
Based on the annually reported progress against this old scope, China’s carbon intensity had fallen by a total of 12.4% from 2020-2025.
This was well short of the 18% target set for these years under the 14th five-year plan.
In September 2025, Huang Runqiu, head of the Ministry of Ecology and Environment, acknowledged this gap, saying that meeting China’s carbon-intensity targets had become “more challenging” due to the effects of the Covid-19 pandemic and trade tensions.
Yet the 15th five-year plan, published in March 2026, reported that China had cut its carbon intensity by 17.7% over the same period – just shy of the 18% target.
As such, it is clear that there has been a major shift in the way that China measures its carbon intensity, specifically in terms of which types of emissions are included.
Moreover, the revised numbers imply that – rather than missing it by a large margin – China officially came close to meeting its carbon-intensity target for the 14th five-year plan.
A footnote in China’s latest statistical communique offers a brief description of carbon intensity as relating to the CO2 emissions from “energy activities and industrial production”.
This indicates that the carbon-intensity calculation now includes industrial process emissions and excludes non-energy uses of fossil fuels, shown by the “new scope” in the figure above.
In comments sought by Carbon Brief, Ryna Cui, associate research professor at the University of Maryland School of Public Policy, who was not involved in the analysis, agrees that the changes to the carbon-intensity methodology are “unclear”. However, she notes that “limited data” makes it challenging to fully verify the nature and impact of the changes.
The revision mirrors a recent change made to the way that China measures its “energy intensity”, the energy use per unit of economic output. In 2024, energy intensity was changed to exclude non-energy use of fossil fuels and energy use from non-fossil fuels.
This exclusion also created a major incentive for expanding the chemical industry and the non-energy use of fossil fuels.
As for the change in carbon-intensity metric, this follows the highly energy-intensive pattern of economic growth during and after the Covid-19 pandemic and China’s “zero-Covid” policy.
Germany-sized gap
The shift in the way that China is measuring its carbon intensity has implications for estimates of the country’s emissions, which are only reported officially some years later.
Changes in carbon intensity and GDP are reported far more quickly – and can be used to estimate changes in China’s CO2 emissions.
China’s total emissions from energy and industrial processes were 11.2bn tonnes of CO2 (GtCO2) in 2020. Based on the originally reported changes in carbon intensity and GDP, its fossil-fuel CO2 emissions had grown 14% by 2024, an increase of 1,430m tonnes (MtCO2).
In contrast, the newly reported carbon-intensity figures imply that China’s CO2 emissions only grew by 7% between 2020 and 2025, up just 690MtCO2, as shown by the figure below.
The gap between these figures amounts to 730m tonnes of CO2 (MtCO2), equivalent to the annual emissions of Germany or South Korea.
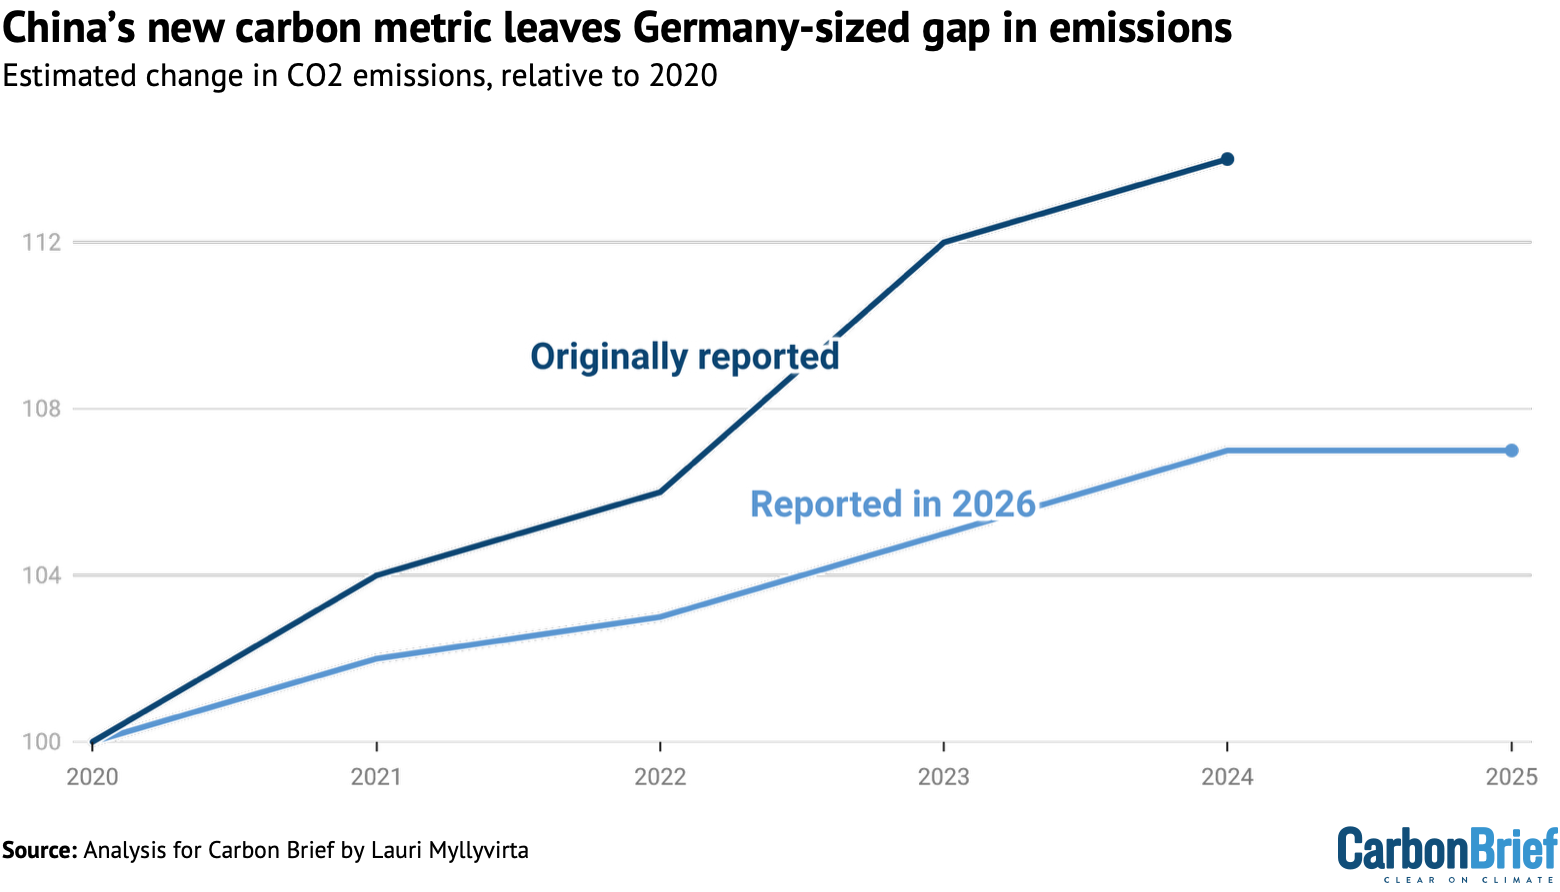
On paper, therefore, the change in the carbon-intensity metric effectively halves the rate of growth in China’s CO2 emissions over the past five years.
Decoding the new carbon-intensity methodology
The change in the carbon-intensity metric could have other significant implications, explored below, making it important to understand how it is being calculated.
Yet, while there are some indications of what the new approach entails, these changes do not seem to account for the magnitude of the revision.
The new scope includes industrial-process emissions. One of the largest sources of these emissions, the cement industry, has been contracting due to a slowdown in real estate and infrastructure construction.
This reduction in emissions is one reason why China’s carbon intensity has improved more quickly under the new scope than under the old one.
In addition, the new scope excludes non-energy use of fossil fuels – largely relating to the chemicals industry – where there has been rapid growth over the past five years.
This is another factor in carbon intensity improving faster under the new scope.
Indeed, China’s chemicals industry drove more than half of the growth in its total fossil-fuel use in the past five years, including 40% of coal use and all of oil use. As a result, non-energy use reached 13% of the total consumption of fossil fuels in 2025, up from 7% in 2020, after growing at an average annual rate of 13%.
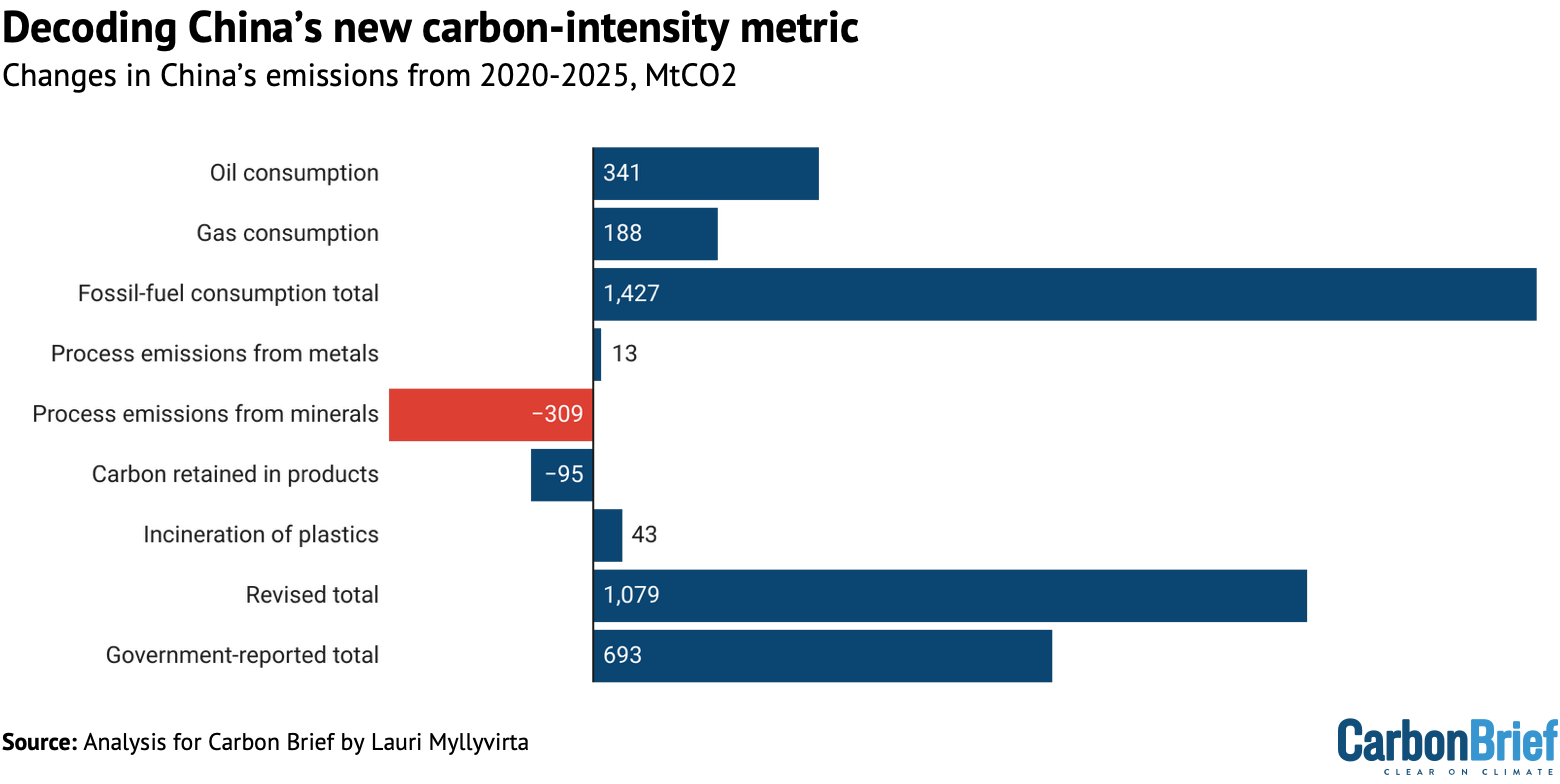
The figure below illustrates the impact of these changes in scope. It shows the change in China’s emissions from 2020-2025 due to the use of fossil fuels for energy, its industrial-process emissions and non-energy use of fossil fuels.
The first few rows show changes based on the consumption of fossil fuels overall, amounting to a combined 1,430MtCO2 rise in emissions.
This compares with the 690MtCO2 rise implied by the new carbon-intensity metric, leaving that Germany-sized 730MtcO2 gap in emissions. The new scope explains some of this gap.
In terms of industrial processes, the 30% fall in cement production could account for a 300MtCO2 fall in China’s CO2 emissions. In addition, the amount of carbon stored in products, such as plastics, asphalt and rubber, could account for an estimated 100MtCO2 fall in emissions.
On the other hand, emissions from the incineration of plastics increased by an estimated 40% and from metals industry processes by 10%, with aluminium production having expanded by 21%. Together, these would have increased emissions by an estimated 60MtCO2.
In total, the changes in emissions from fossil-fuel use, industrial processes, carbon retained in products and waste incineration add up to a combined 1,070MtCO2 rise from 2020-2025, shown in the penultimate row of the figure below.
Again, this revised total – based on the change in scope of the carbon-intensity metric – goes some way to explaining the Germany-sized gap in China’s CO2 emissions.
However, the new carbon-intensity figures imply that China’s CO2 emissions only increased by 690MtCO2, as shown in the final row of the figure below. This leaves a residual gap of around 380MtCO2, which does not appear to be accounted for by the data available.
One way to make the numbers add up would be to assume that the amount of carbon embedded in chemical-industry products has increased by the equivalent of 500MtCO2.
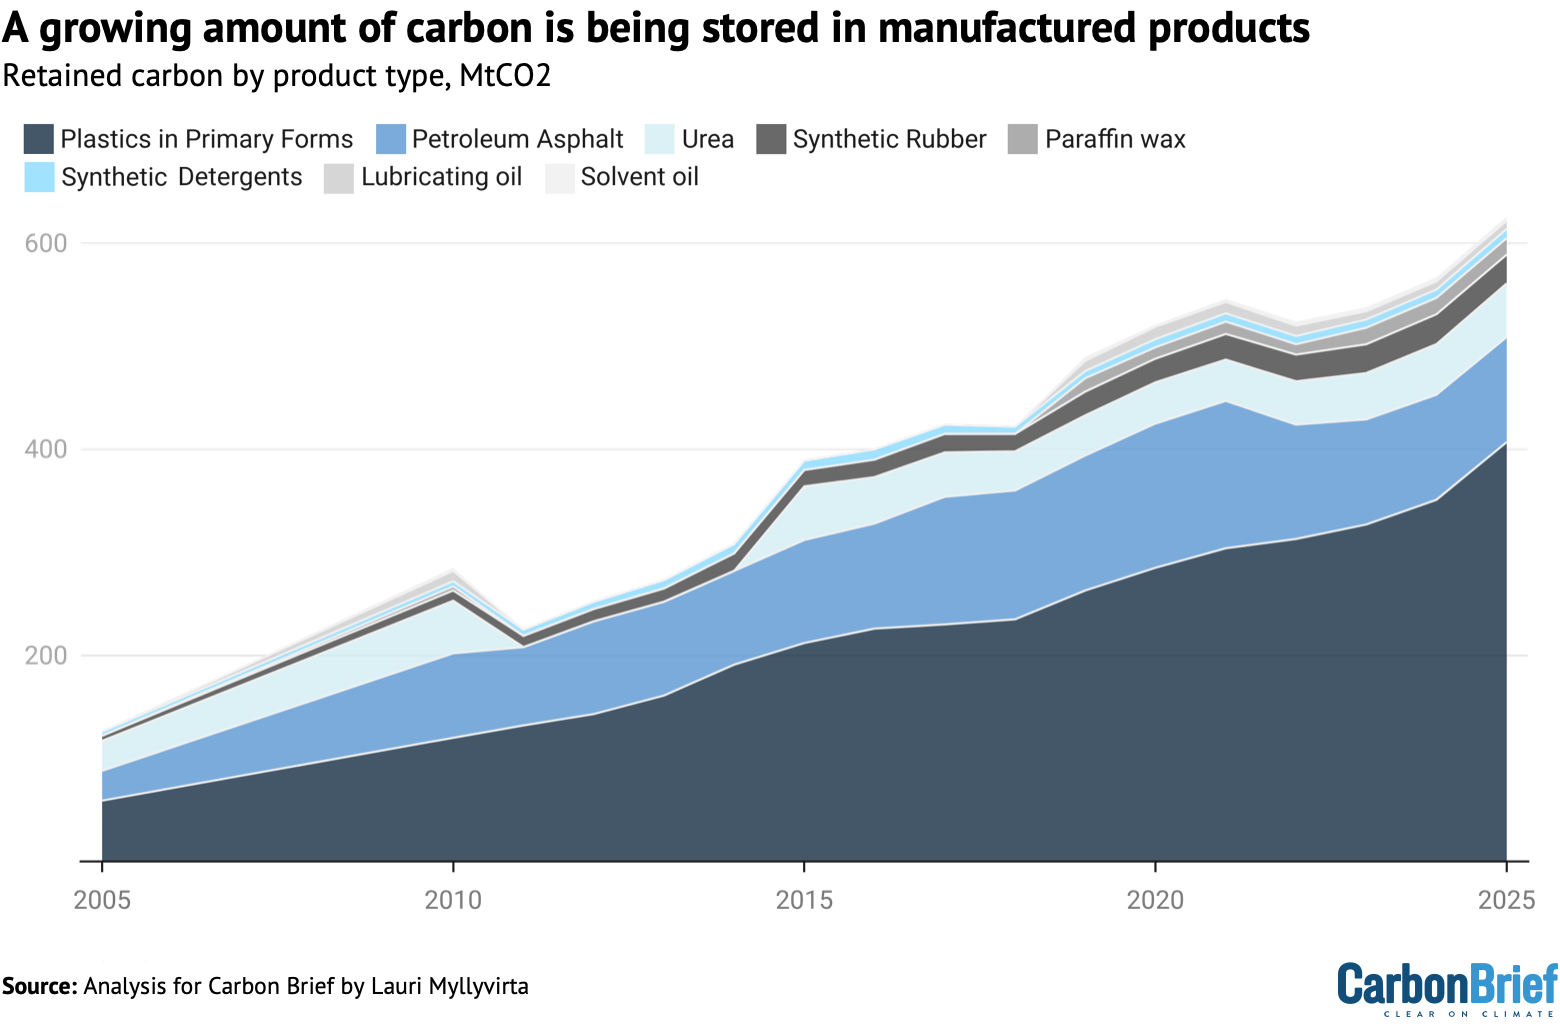
However, the reported output of major chemical-industry products cannot account for this level of embedded carbon. The figure below shows that the increase in output of major chemical products only explains around a 110MtCO2 increase in retained carbon.
Much of the increase in the production of plastics was cancelled out by a contraction in the use of bitumen for asphalt, due to lower road-building activity.
Furthermore, the 14th five-year plan for 2021-25 had a target of raising the share of waste incineration to 65% of urban residential waste treatment capacity, up from 45% in 2020.
So, while plastics production did go up, resulting in increased amounts of retained carbon, a larger share of this retained carbon was being incinerated, meaning its carbon would quickly be released back into the atmosphere.
One reason why carbon retained in products has grown more slowly than the amount of fossil fuels used in chemicals production is that the fastest growth has been in the coal-based chemicals industry.
Coal-based processes have a much lower conversion efficiency than oil- and gas-based production, with process emissions that are typically multiple times as high.
For example, these emissions are 10 times as high for the production of olefins – a key plastics feedstock – from coal as compared with oil or gas. The process is reported to require 3.75 tonnes of standard coal per tonne of product. This implies that only 30% of the carbon in the coal is retained in the product, with the other 70% being emitted in the process.
There are also chemical processes that use fossil fuels as a feedstock, but where the end product does not contain carbon. One example is ammonia, a key building block for fertiliser, where production grew by 52% from 2020 to 2025.
Neither the change in scope of the carbon-intensity calculation, nor the change in the amount of carbon retained in products, is sufficient to explain the size of the revision in the newly reported numbers. There must be another explanation.
There are two options. Either the new scope broadly aligns with what is outlined above, but also excludes a subset of the CO2 emissions. Or the scope does not exclude any of the CO2, but there are gaps in the monitoring of some energy or industrial-process emissions.
Either explanation would mean that China is not accounting for some of its CO2 emissions. It would also mean that the improvement in carbon intensity for 2020-2025 is over-reported.
China’s latest officially reported emissions inventories reinforce the second of the two options above, namely, that there are gaps in emissions reporting from the chemical industry.
From 2018 to 2021, the latest year for which China has reported on its emissions, the CO2 output of chemical-industry processes only increased by 13%. Over the same period, non-energy use of fossil fuels increased by 29%, according to data reported to the International Energy Agency by the Chinese government.
One factor in these apparent gaps could be that China’s National Bureau of Statistics (NBS) is required to publish data on carbon intensity very quickly, since it is a key indicator in the country’s five-year plans.
On the other hand, detailed greenhouse gas emissions inventories and energy statistics are only published years later, by the environment ministry and NBS, respectively.
What the change means for China’s targets
The change in the definition of carbon intensity has the effect of weakening China’s climate targets and introducing more uncertainty into tracking progress.
On the basis of China’s new numbers, it will require less effort to hit the 2030 target for a 65% reduction in carbon intensity on 2005 levels, as per China’s Paris pledge.
This target can now be met even if CO2 emissions go up between 2025 and 2030, whereas the previous metric would have required a reduction.
It will also require less effort to hit the 17% target in the 15th five-year plan.
The apparent gaps in the CO2 emissions numbers for 2025 could affect the delivery of China’s other key climate pledges, such as the commitment to peak CO2 emissions before 2030. They could also allow the chemical industry’s CO2 emissions to continue climbing rapidly, while still officially meeting the 2030 goals for CO2 intensity.
Moreover, the apparent gaps or inconsistencies in China’s new carbon accounting also mean that China would be able to officially meet its target to peak its CO2 emissions by 2030, even if its overall CO2 emissions do not actually reach a peak.
The apparent gaps could also affect the delivery of China’s newer target to cut its greenhouse gas emissions to 7-10% below peak levels by 2035 and beyond.
Nevertheless, researchers and analysts can still monitor progress by calculating China’s CO2 emissions independently.
China’s reporting on fossil-fuel consumption, the output of plastics and other carbon-containing products, as well as manufacturing of commodities with substantial process emissions, provides a basis for tracking emissions under the new scope.
While under the UN’s climate framework China is free to use any definition it wants to meet its own nationally determined climate pledges, retrospective changes to methodology or inconsistent accounting could erode the value of the country’s commitments.
Moreover, it will, ultimately, have to close any gaps in its emissions data and reporting, under the transparency rules of the Paris Agreement.
China’s next transparency report to the UN, due by the end of this year, should also provide more clarity on the methodology and data underlying the revised numbers.
This underscores the importance of monitoring, reporting and verification for industrial process emissions. “Mass balances” based on fossil-fuel consumption and product output could be used as a check on CO2 emissions reporting. Finally, China’s emissions data could also be made more granular and clearly defined.
Carbon Brief has approached the National Bureau of Statistics and Ministry of Ecology and Environment for comment.
The University of Maryland’s Cui tells Carbon Brief that in general, China’s climate goals are “improv[ing]” in terms of their coverage and scope. However, she adds:
“The issue is…the ambiguity and inconsistency in the coverage, definition and method between target setting and progress tracking, which can lead to large uncertainties and room for manipulation. It highlights the importance of transparency in national climate targets, following the UNFCCC’s international transparency framework, which should also be applied as best practices for domestic targets.”
About the data
The calculations in this analysis are based on China’s total coal, oil and gas consumption from energy statistical yearbooks covering the years until 2023, with data for 2024 and 2025 taken from the latest statistical communiques.
“Originally reported” CO2 emissions were back-calculated from carbon-intensity reductions and GDP growth given in annual statistical communiques. The revised emissions for 2020, 2024 and 2025 are similarly back-calculated from the reductions in carbon intensity from 2020 to 2025 and from 2024 to 2025, as reported in the 15th five-year plan outline and the 2025 statistical communique, respectively, combined with annually reported GDP growth.
Cement process emissions up to 2024 are from Robbie Andrews’ estimates, scaled to 2025 based on year-on-year change in total cement output.
Process emissions from the metals industry are based on calculating emissions for aluminium, silicon, lead, zinc and crude steel from the bottom-up, using industrial output data and IPCC default emission factors scaled to the reported total in 2021. For steel, the calculations are based on typical quicklime use in basic-oxygen and electric-arc furnaces.
Emissions from the incineration of plastics are based on a peer-reviewed estimate of plastics incineration in 2022, combined with growth rates in the overall power generation from waste-to-energy plants. The analysis assumes that the share of plastics in the energy content of the incinerated waste stayed constant over this period, which is a conservative assumption given the rapid rise in plastics production.
Total non-energy use of fossil fuels in 2020, 2024 and 2025 is available from an NEA data release, with data for 2021-2023 found in the China energy statistical yearbook 2025.
The mix of coal, oil and gas within non-energy use is based on the energy statistical yearbook data up to 2023, with the increase in coal in 2024 and 2025 based on Wind Financial Terminal data on coal consumption in the chemical industry. Gas use, which is relatively minor, is assumed to have grown on trend and oil is calculated as the residual.
Primary plastics, rubber, and urea output data are from NBS industrial statistics. The production of solvents, lubricants and waxes, as well as the use of bitumen in construction, is from energy statistical yearbooks. The analysis assumes no change in output from 2023 to 2025, given the lack of clear trends.



The post Analysis: China’s new carbon metric leaves Germany-sized gap in its emissions appeared first on Carbon Brief.
Analysis: China’s new carbon metric leaves Germany-sized gap in its emissions

June Rubis is a steering group committee member for the Cali Fund, from Sarawak in Malaysian Borneo.
At COP16 in Cali, governments made a significant commitment: at least half of the funding from the new Cali Fund should support the self-identified needs of Indigenous Peoples and local communities, including women and youth. It was a watershed moment for multilateral benefit-sharing.
The challenge now is to translate that commitment into access arrangements that recognise the different institutions, priorities and decision-making processes of Indigenous Peoples and local communities.
For generations, biodiversity and traditional Indigenous knowledge have provided significant value to companies who depend on nature’s genetic diversity to discover new drugs that fight diseases, create products that improve health, and grow crops resilient to extreme heat and flooding events. While some compounds are sampled directly from the source country, increasingly the digital blueprints are held in online public databases which are freely accessible to use for innovation and research.
Countries urged to ramp up “insufficient” nature policies at COP17
The Cali Fund was established at COP16 to encourage commercial users of Digital Sequence Information, or DSI, to share benefits arising from its use. Estimates suggest it could generate over $3.5 billion a year – a stark contrast to the modest $10,656 currently committed to the fund from just five SMEs, underlining how much progress must be made at COP17 over the next two weeks.
The COP16 decision that set up the fund offers two routes for money to reach Indigenous Peoples and local communities: through government authorities, and through direct payments to institutions identified by Indigenous Peoples and local communities themselves.
Varied ways of organising
Indigenous Peoples and local communities organise through a wide range of institutions. Some have national or regional organisations experienced in managing international grants. Others work through territorial organisations, customary institutions, community associations, cooperatives or networks. Some have professional finance teams and audited accounts; others have extensive experience governing territories, collective resources or conservation work without having been organised around international funding requirements.
For direct access, some questions are already apparent. Which institutions should be able to receive funds? How should they be identified? What fiduciary standards should apply? How should safeguards and accountability work where institutional capacities differ? What support may be needed where institutions have strong community mandates but less experience with international finance?
Comment: Protecting nature is a public duty, not a Wall Street profit opportunity
If access is designed mainly around institutions that already meet the expectations of large international finance mechanisms, early funding will tend to favour those already familiar to funders. They will gain further experience and become better positioned for future funding, while institutions with less administrative capacity may remain outside the system despite strong community mandates and long histories of stewardship.
These first decisions matter most, because they set the terms for everyone who follows.
The role of intermediaries requires care. Some Indigenous organisations may want a fiscal host to hold and manage funds on their behalf. Communities may choose to work through an NGO they trust. Government-facilitated arrangements may work well in particular national contexts.
What matters is the function an intermediary performs and the authority that comes with it. Providing administrative support is different from deciding which Indigenous organisations qualify, which priorities can receive support, or how success will be assessed. Direct access means communities keep that decision-making authority.
Decision-making power
The COP16 decision refers to institutions that Indigenous Peoples and local communities identify. But authority among Indigenous Peoples does not sit in one kind of body. It may sit with territorial organisations, customary institutions, community associations or combinations of these. Legal recognition and customary authority do not always align neatly.
Global deforestation slowed in 2025 but Brazil’s election could undo “fragile” gains
An important feature of the Cali Fund’s governance is that Indigenous Peoples and local communities participate as full members of the Steering Committee, rather than as observers. Seven Indigenous Peoples and local community representatives, one from each of the seven socio-cultural regions, participate in consensus-based decision-making alongside representatives of governments and UN entities. Six additional representatives from civil society, scientific institutions and the private sector participate as observers.
That representation carries responsibility. Institutional legitimacy, access and representation take different forms across the seven socio-cultural regions. Indigenous Peoples and local communities members therefore have an important role in bringing those differences into the Fund’s governance and in ensuring that arrangements developed for one context do not become the assumed model for everyone else.
Safeguards and clear responsibilities
COP17 can establish the core principles and direction, while allowing operational pathways to develop in ways that respond to different regional contexts. The decisions countries take in Yerevan will shape how that flexibility is realised in practice.
The choices made around access will influence which institutions are able to participate, which routes become established and which forms of authority are recognised within the funding architecture. The aim should be an architecture with enough structure to maintain confidence while allowing for different forms of Indigenous and community governance.
A credible direct-access pathway will need safeguards, financial oversight and clear responsibilities. This would give the 50% commitment a stronger institutional foundation.
The Cali Fund’s importance will ultimately depend not only on how much funding reaches Indigenous Peoples and local communities, but on whether they are able to determine how the money is accessed, governed and used. This requires access pathways that recognise their institutions, priorities and decision-making processes, rather than requiring them to conform to a single predetermined model.
The post COP17 must settle who decides how Cali Fund money is disbursed appeared first on Climate Home News.
COP17 must settle who decides how Cali Fund money is disbursed
The UK government has approved extraction at the Jackdaw gas field in the North Sea, despite acknowledging that this decision could make it harder for Britain to convince other countries to move away from fossil fuel production.
UK energy secretary Miatta Fahnbulleh approved the drilling on Wednesday after months of high-profile debate, fuelled in part by interventions from US President Donald Trump. She argued that the project would boost energy security in the wake of the Middle East fossil fuel crisis, protect hundreds of jobs and add £2.9 billion ($3.88bn) to the UK economy.
She said Jackdaw’s gas would be cleaner than imported gas and would not prevent the UK from meeting its legally-binding carbon targets and its goal of net zero by 2050. As the field is already licensed, she said extraction was consistent with the Labour Party’s 2024 manifesto promise not to issue any new oil and gas licenses.
The same morning, the government announced a new Energy Wealth Fund to reinvest oil and gas revenues in the climate transition. It will start with £2 billion ($2.67bn) from the government and be topped up over time with tax revenues from offshore oil and gas production.

Climate campaigners in the UK and abroad were quick to condemn the decision, while a leading legal expert told Climate Home News it goes against the advice of the International Court of Justice. Meanwhile, the government’s own documents reveal that it recognises the drilling could damage the UK’s reputation and its ability to push forward the global transition away from fossil fuels.
“Climate leadership” blow
The 92-page decision document says Fahnbulleh “acknowledges that international standing on climate is important and accepts that a decision to grant consent may not further the UK’s international climate leadership.”
It adds: “She acknowledges concerns about the potential implications for the UK’s credibility and influence – including the difficulty inherent in encouraging other states to move away from fossil fuel production while the UK continues, in a limited and transitional way, to draw on its own domestic resources.”
While noting that Jackdaw has not been issued with a new license – just permission to extract gas – the document says Fahnbulleh “accepts this does not fully resolve the underlying tension in the UK’s position” but “considers this alongside the substance of the UK’s wider record [on emissions reduction], which remains significant”.
It continues that she accepts these concerns are “legitimate” and weigh against approving gas extraction, but only gives this argument a “moderate negative weight” set against the benefits of gas production.
“Huge” wrong signal
In international climate talks, the UK has long supported the transition away from fossil fuels and is one of very few major oil and gas producers to ban new licenses. Across the North Sea, the Norwegian government continues to make offshore areas available for oil and gas exploration through annual licensing rounds.
Climate experts and campaigners shared the concern, acknowledged in the decision document, that approving Jackdaw could set a precedent for fossil fuel production elsewhere. Sam Fankhauser, professor of climate change economics at Oxford University, said the direct climate impact of Jackdaw is “much smaller than the debate around it would suggest” but the “wrong signal it sends, however, is huge”.