

At least 67 NHS hospital wards, departments and other sites across the UK have been forced to temporarily close or relocate due to weather-related flooding over the past five years, a Carbon Brief investigation reveals.
Maternity centres, surgical theatres, a neonatal intensive-care unit and even entire hospital buildings have been disrupted by heavy rainfall or encroaching floodwaters.
Carbon Brief submitted freedom-of-information (FOI) requests to 162 NHS trusts, which show that while many flood-related shutdowns were brief, some lasted for weeks or months.
In total, 148 trusts responded to these requests with reports of 67 flood-related shutdowns, giving detailed data for 30 incidents that resulted in a total of 3,000 days of closures.
Reports of flooding at NHS sites have been on the rise, according to NHS England data.
This comes as the UK experiences wetter winters, with periods of extreme rainfall that are increasingly linked to human-caused climate change.
These floods can exacerbate existing problems in a healthcare system that is already struggling with insufficient funding, old hospital buildings and a backlog of maintenance work.
Indeed, while there have been efforts to make UK hospitals more resilient to extreme weather, one expert tells Carbon Brief that such measures are difficult to implement when these institutions are struggling to keep their “heads above water”.
Rising floods
Floods pose a threat to people’s health, but they also threaten the UK’s healthcare infrastructure. Water can enter hospitals, paralyse ambulance services and damage equipment, placing strain on an already stretched NHS.
NHS records show that the number of flood incidents “caused by external weather events” in facilities across England has doubled since 2021, reaching nearly 400 in 2024-25.
Equivalent data is not available for Scotland, Wales and Northern Ireland, although there have been reports of floods disrupting services across the whole UK.
As global temperatures rise and the atmosphere holds more moisture, UK winters are getting wetter. Attribution studies show climate change has increased the severity of recent rainfall and flooding events – including Storm Eunice in 2022 and Storm Babet in 2023.
There is also a risk of increased flooding when heavy rain hits after periods of intense drought, of the kind seen in recent years.
Environment Agency modelling suggests that a rising share of medical facilities in England will be at risk of flooding due to climate change. It says the share of sites at risk will increase from a quarter in 2024 to a third by the middle of the century.
Despite this apparent threat facing the UK’s healthcare system, there is limited information about the extent to which these floods are already disrupting NHS services.
Closed services
To build a fuller picture of NHS-wide flooding, Carbon Brief sent FOI requests to 162 trusts and health boards – the organisations in charge of health services – across England, Scotland, Wales and Northern Ireland.
They were asked for details of wards, departments or services that had been temporarily or permanently closed due to weather-related flooding, such as river floods or heavy rainfall, between 2021-22 and the start of 2026.
In total, 148 of these bodies responded with details of 67 incidents in which weather-related floods have triggered closures. The map below shows where these incidents were located, from hospital wards in Scotland to an eye unit on the south coast of England.
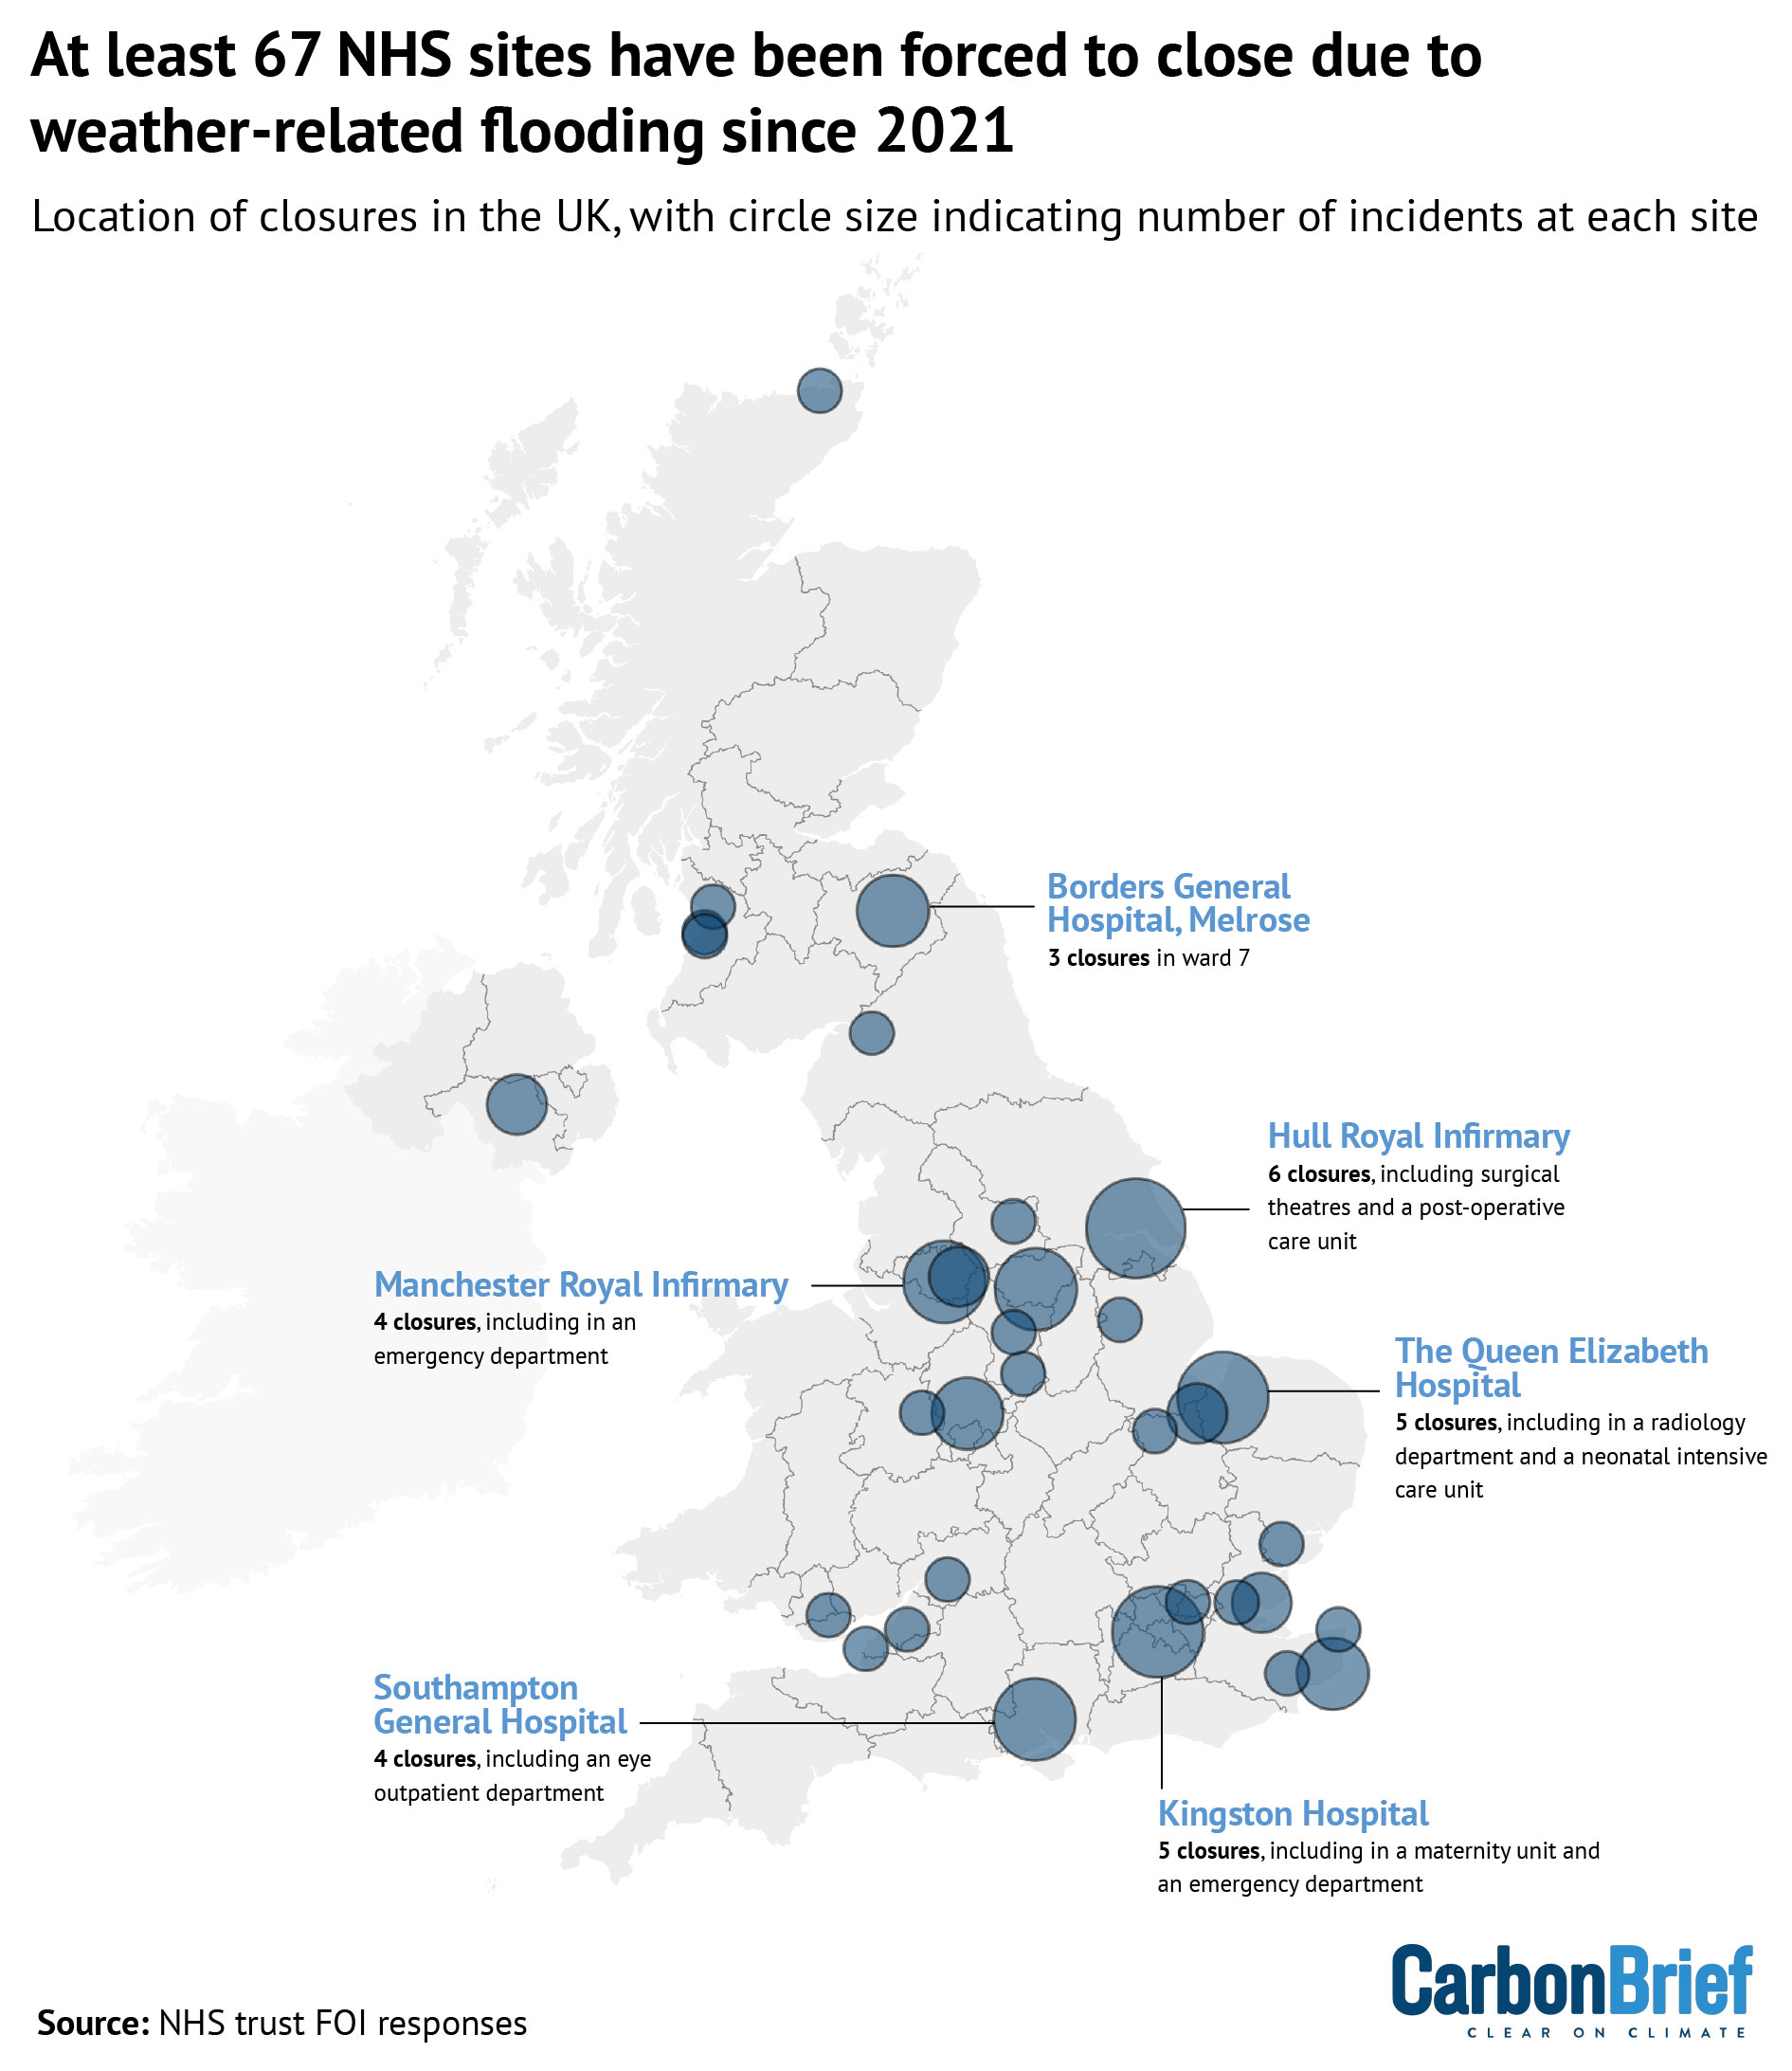
The 67 flooding-related disruptions reported by NHS trusts and health boards is likely an underestimate. Many trusts told Carbon Brief they did not record such detailed information or that collating it would be too time-consuming.
Nevertheless, the results provide an insight into the kind of risks facing NHS services as weather gets more extreme.
Among the closures were 13 accident and emergency (A&E) departments, urgent treatment centres and minor injuries units. There were also 10 hospital wards, 10 surgical theatres, five maternity units and a neonatal intensive-care unit affected by flooding.
Many trusts did not provide information about how long each closure lasted. However, the 30 incidents where timespans were provided add up to the equivalent of more than 3,000 days – or eight years – of closures across NHS sites.
The infographic below provides a snapshot of some notable closures from the dataset.
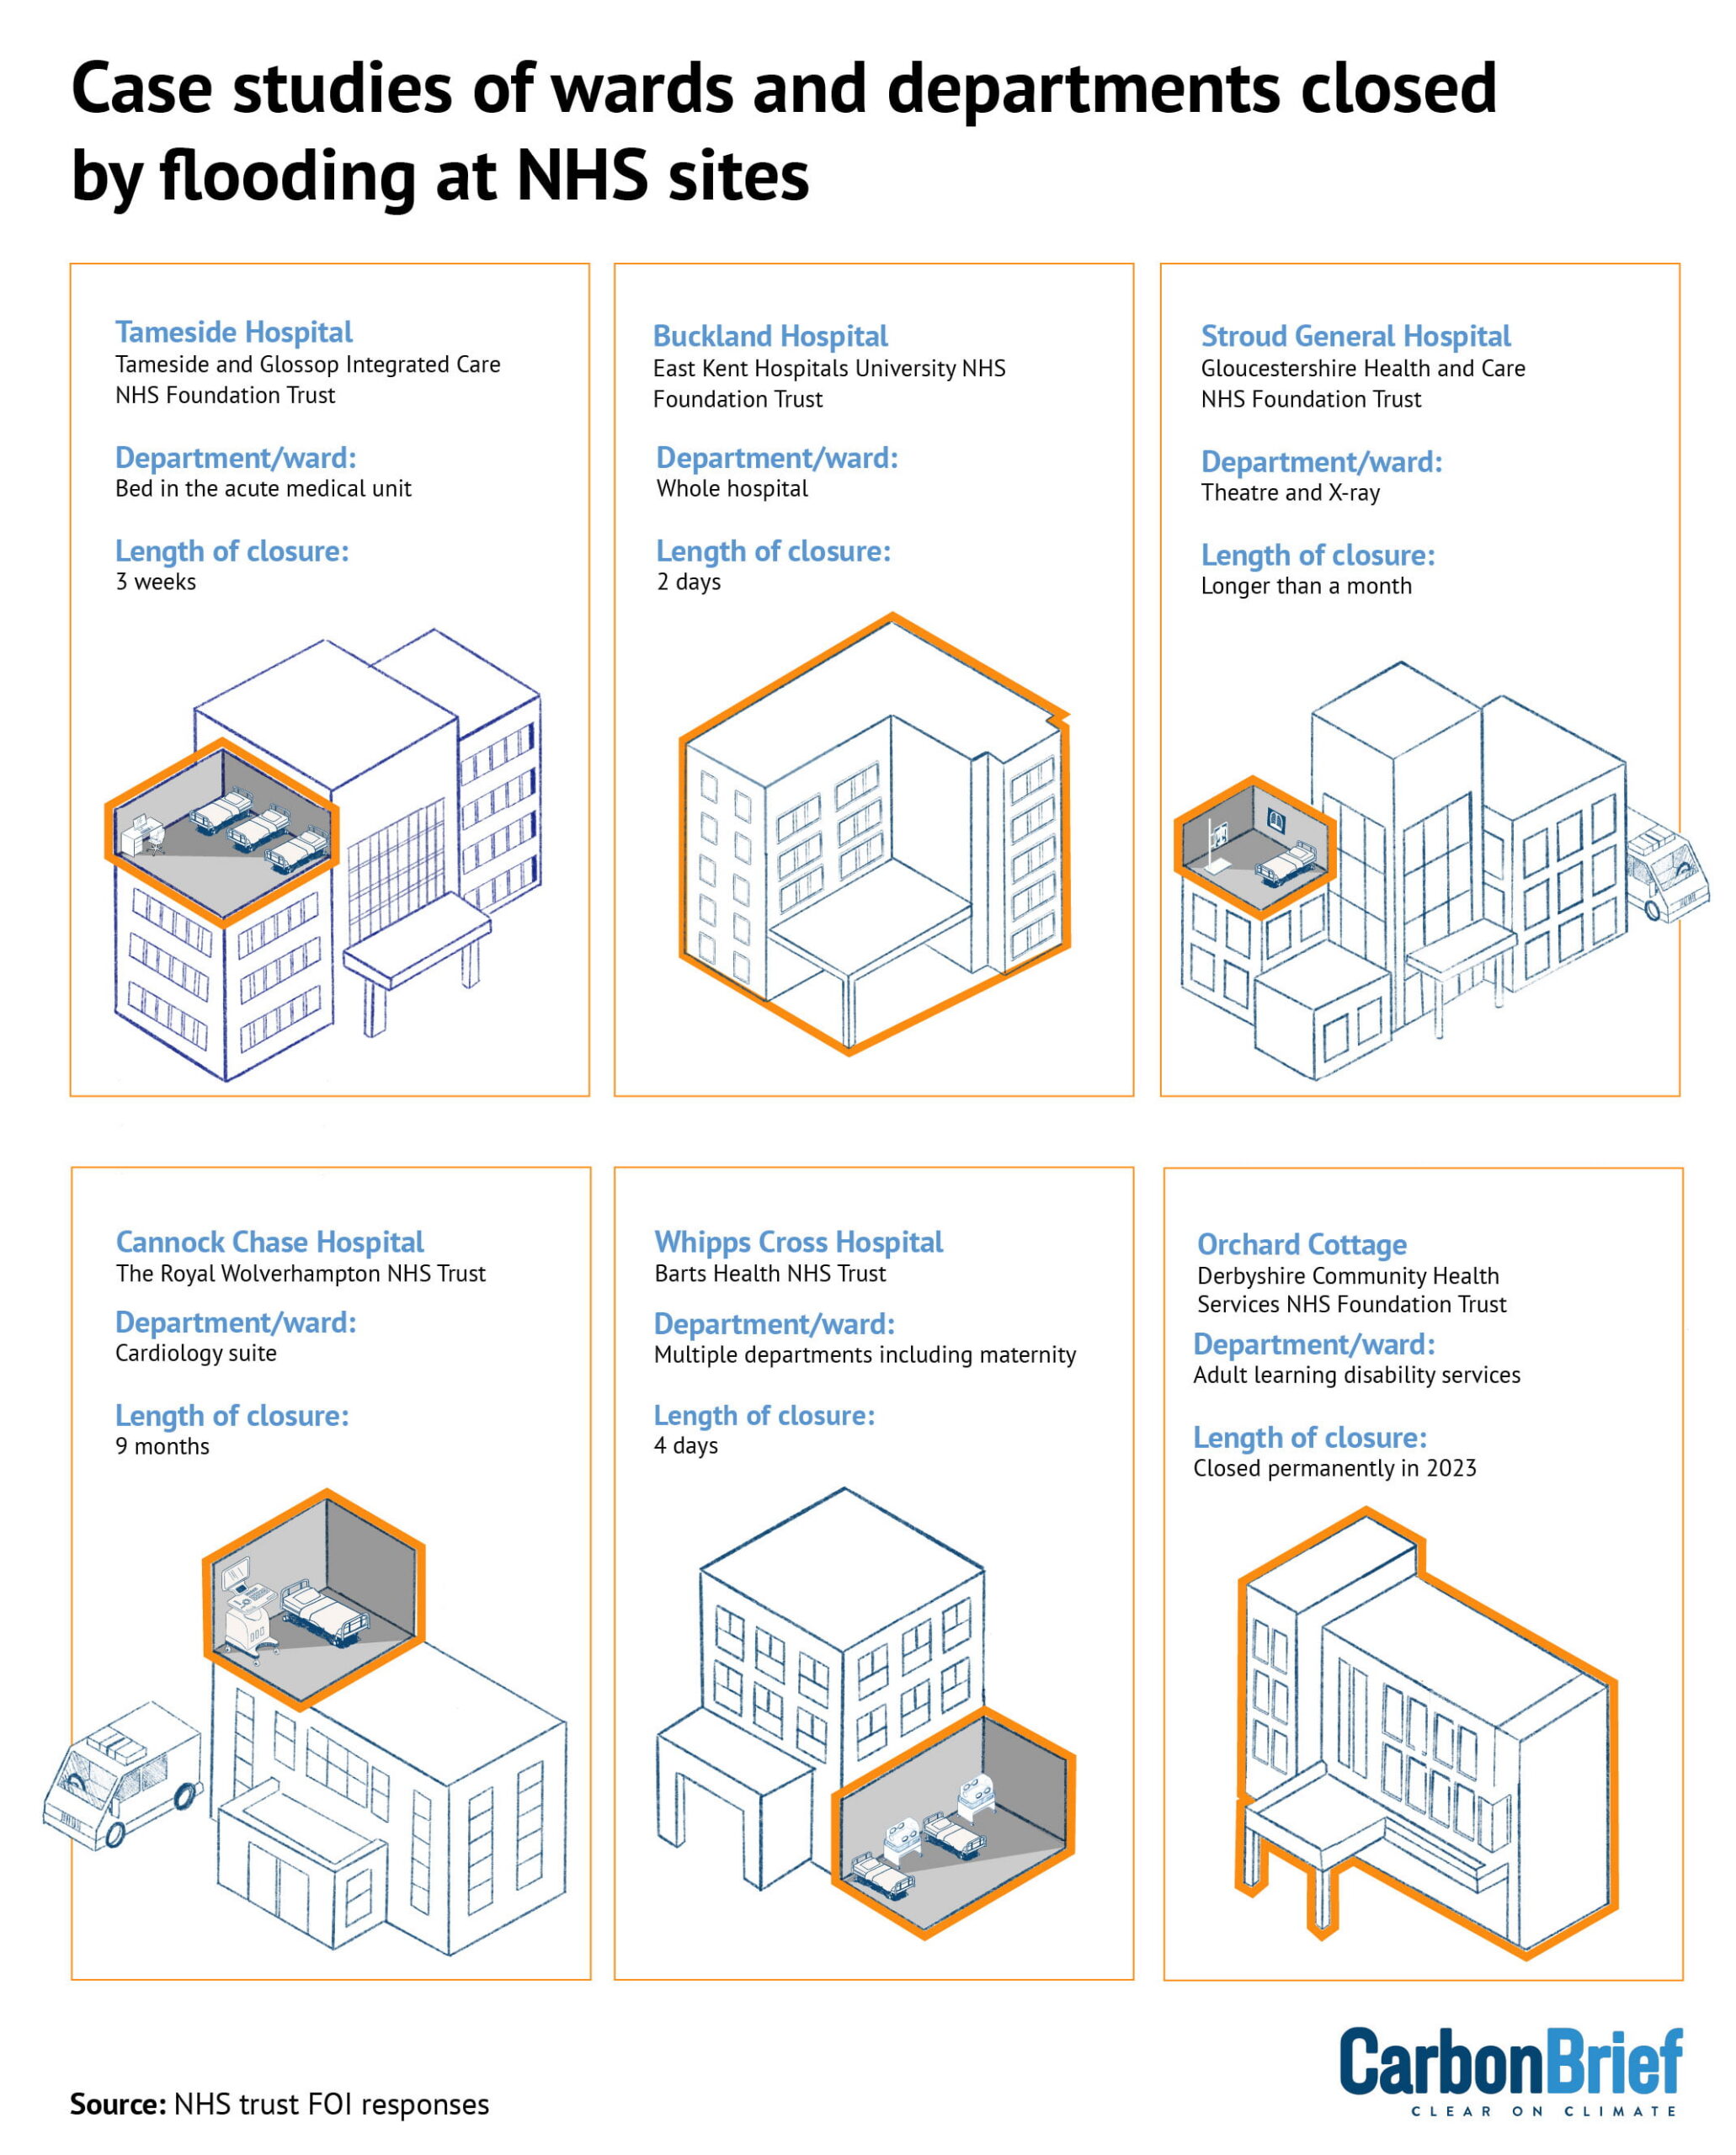
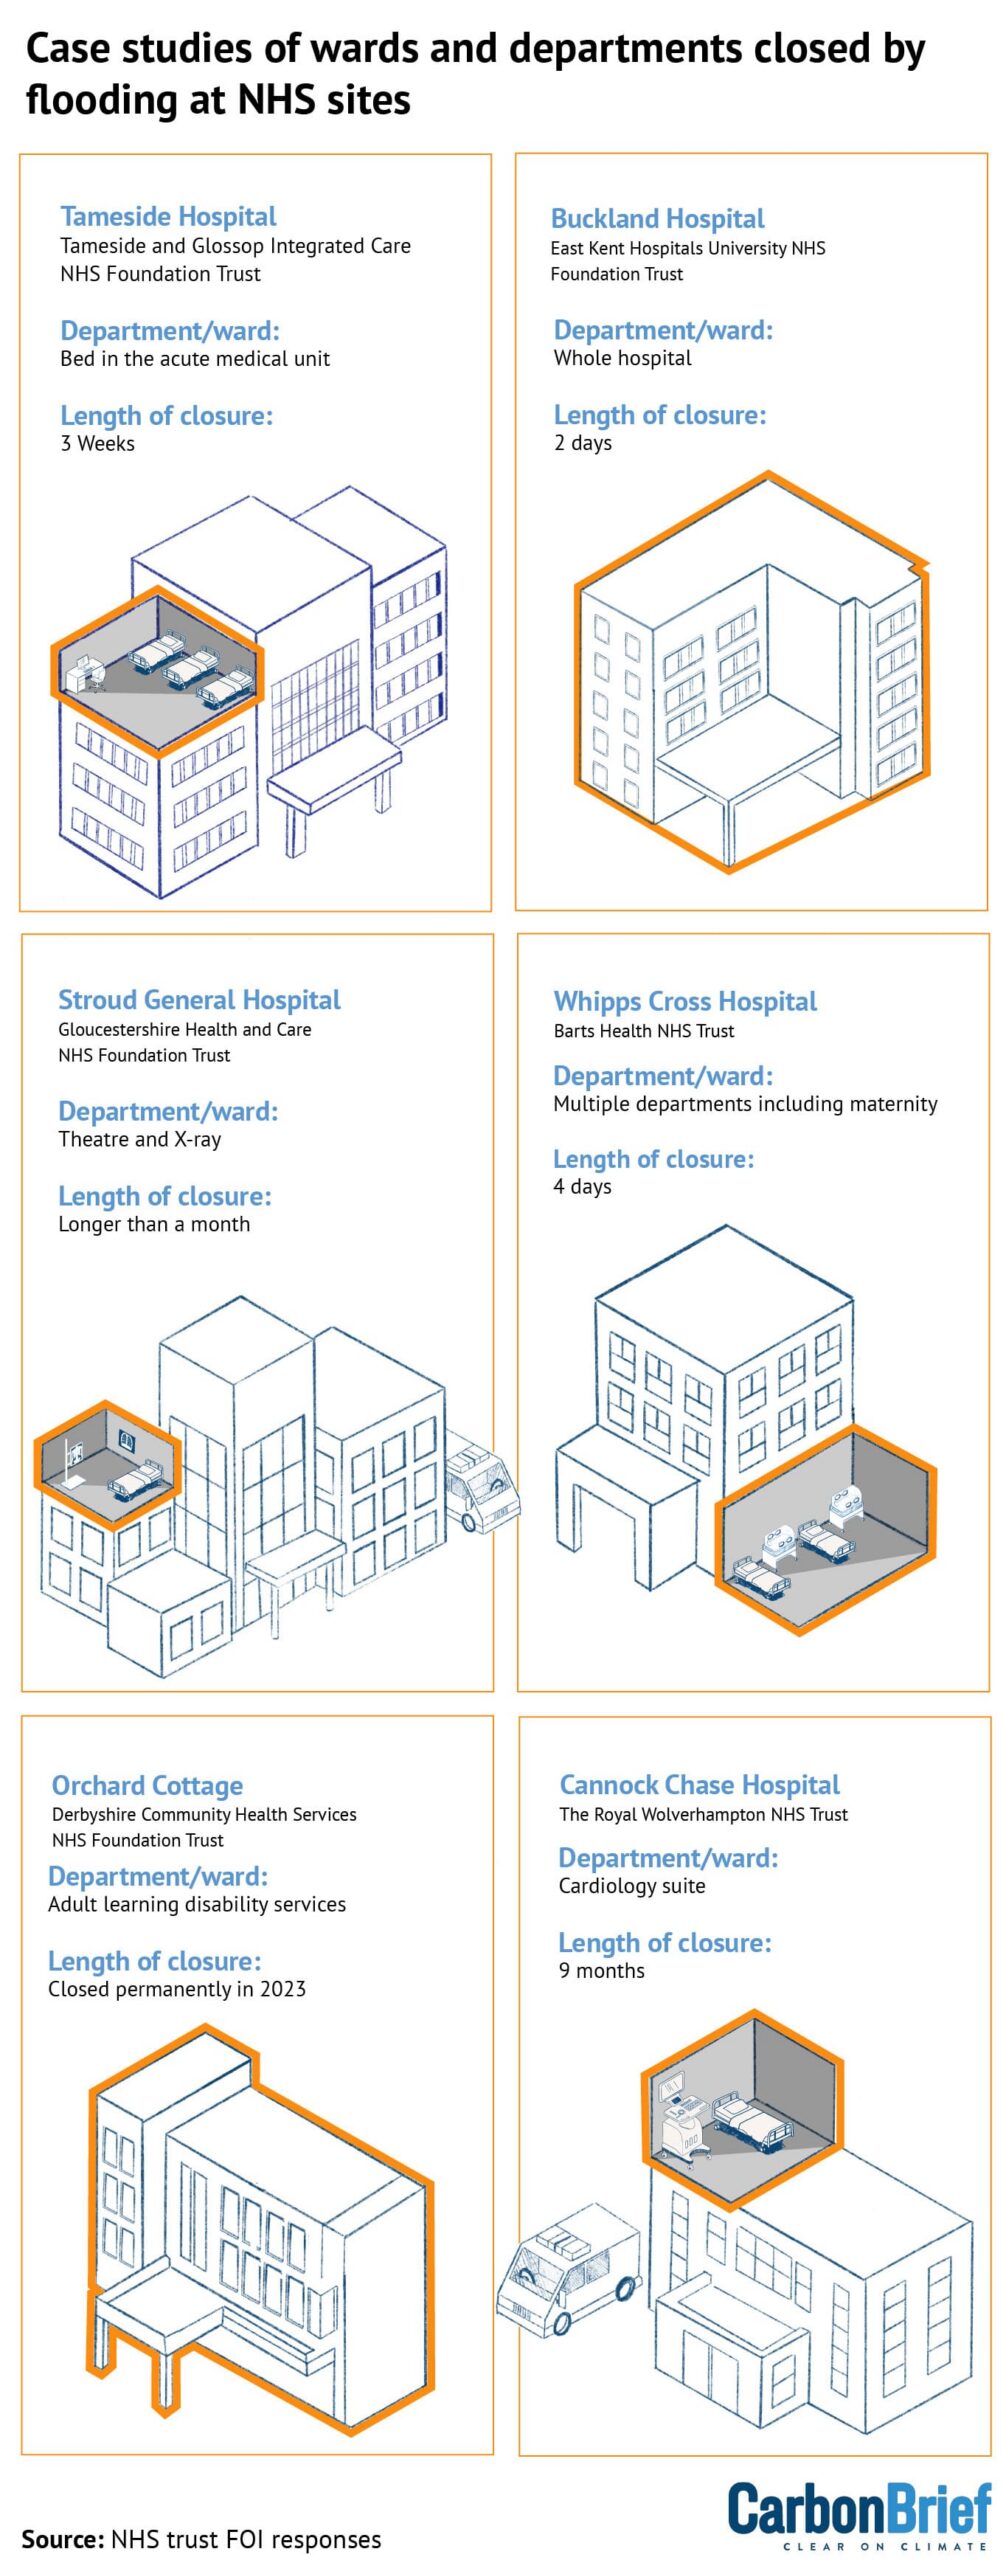
The entire Buckland Hospital site in Dover closed for two days in 2025 amid “exceptional rainfall” and flash floods. People seeking radiology, maternity and urgent-care services were told not to visit over the weekend and various clinical services were delayed or cancelled.
The NHS declared a “major incident” in 2021 when flood waters “caused power outages impacting multiple areas” at Whipps Cross Hospital in north-east London – including its maternity service – for four days. Neighbouring hospitals also flooded.
Some closures lasted far longer. In Stroud General Hospital, a surgical theatre was closed for two weeks and an X-ray facility for around two months after storm water overflowed into the building in 2023.
Several NHS trusts stressed that the flooding incidents they reported were localised – often resulting from roof leaks exacerbated by heavy rain – and resulted in minimal disruption. Sometimes, as with a cardiology suite in Cannock Chase Hospital, the service was moved and the trust says patient care was not disrupted.
However, the responses also showed the breadth of damage such events can cause, including rainwater “pouring onto expensive equipment” and floods triggering the long-term relocation of services.
For example, Orchard Cottage, a site that provided care for adults with learning disabilities in Derbyshire, experienced major flooding during Storm Babet in 2023 and was permanently shut down as a result.
Adaptation needs
The UK Health Alliance on Climate Change, a group of UK health organisations, concluded in a report in 2025 that, with flood risks projected to grow, there is an “urgent need for adaptation measures” across the nation’s healthcare facilities.
Government advisors at the Climate Change Committee have highlighted the need for flood resilience in UK hospitals, including flood barriers, waterproofed electricals and built-in redundancy for critical areas, such as theatres, labs and IT equipment.
There have been various measures at both government and NHS level intended to improve the resilience of medical facilities to climate-related hazards.
The UK’s national adaptation programme sets out expectations for NHS England to “adapt NHS infrastructure to extreme weather events”. All trusts must have “green plans” in place, which require climate change to be factored into infrastructure decisions, for example, through the creation of drainage systems or green spaces.
Yet, as it stands, three-quarters of UK doctors say their workplaces are not prepared for the impact of extreme weather and nearly half of healthcare workers report that extreme weather has disrupted NHS services in the past five years.
Many hospitals have outdated infrastructure – often predating the founding of the NHS – which was not designed to cope with climate change. Prof Hugh Montgomery, chair of intensive-care medicine at University College London, tells Carbon Brief:
“The hospitals themselves weren’t built for this weather any more than anything else is really – and of course it’s going to get worse, in an exponential function.”
Many of the FOI responses provided to Carbon Brief identified specific building defects, such as roof leaks, which led to the flooding incidents during periods of heavy rainfall. There is a huge – and growing – backlog of maintenance work at NHS hospitals that was estimated in 2024-25 to need repairs costing £15.9bn.
Chris Naylor, a senior fellow at the King’s Fund, a thinktank focusing on health policy, tells Carbon Brief:
“Dealing with some of the backlog maintenance would probably help with climate adaptation as well, because of leaky roofs and all the rest of it. But we do also need to be thinking specifically about climate adaptation within the NHS and making sure there is funding for that.”
Montgomery points out that with trusts “mostly bankrupt” and most hospitals running a deficit, the question remains how to fund such interventions. “They’re struggling to keep their heads above water and they’re losing money,” he says.
Dr Mark Harber, a consultant nephrologist and special adviser on climate change at the Royal College of Physicians, tells Carbon Brief that hospitals at least need to make plans for extreme weather. This is particularly important for patients in need of time-dependent and life-saving treatments, such as kidney dialysis and chemotherapy.
Harber notes that hospitals, supply chains and transport could all be disrupted by floods:
“You have to have plans in place to deal with that, even if the NHS can’t deal with the flooding risk per se.”
Carbon Brief asked NHS England – which is responsible for the majority of the trusts that reported flooding disruption – for comment, but had not received a response at the time of publication.
Methodology
The list of incidents reported by trusts can be viewed here.
Carbon Brief sent FOI requests to 120 English NHS trusts that have reported any incidents of flooding since 2021 in NHS England’s Estates Returns Information Collection (ERIC) dataset. This covers around 60% of all English NHS trusts.
Carbon Brief also filed FOI requests with all 42 of the health boards and trusts in Scotland, Wales and Northern Ireland, which are equivalent to English NHS trusts.
All trusts and health boards were asked for details of wards, departments or services that have been temporarily or permanently closed due to weather-related flooding, such as river flooding or heavy rainfall.
This matches the wording used to describe a flooding event in the ERIC system, which requires the reporting of all flood events “caused by external weather events” that trigger a risk assessment by staff. Such external events are distinct from floods caused by other issues that are not related to the weather, such as burst pipes.
In total, 14 trusts did not respond and many more said they did not hold the data requested. Some trusts provided data, but on further questioning stated that the data they provided covered all flooding events and it was not possible to say which were related to weather conditions. These cases have not been included in the final dataset.




The post Revealed: Floods have forced at least 67 closures at NHS hospitals since 2021 appeared first on Carbon Brief.
Revealed: Floods have forced at least 67 closures at NHS hospitals since 2021

Three countries have been named by the Paris Agreement’s compliance committee for failing to submit a nationally determined contribution (NDC) and repeatedly snubbing offers of help with their climate plans.
After months of internal debate over whether to identify serial non-responders, the Paris Agreement’s Implementation and Compliance Committee (PAICC) named the three countries which have failed to engage with it over their NDCs on Friday.
It named Democratic Republic of Congo, Senegal and North Korea in a footnote of its annual report, adding that it decided to name them “with a view to facilitating engagement”, adding that representatives of the three nations had been invited to its meeting in early 2027 “with the purpose of identifying any challenges and constraints”.
“The Committee noted the importance of Parties engaging with the Committee in a timely manner, while noting that some delays may be due to the national capabilities and circumstances of the Parties”, the report said.
-
Under US pressure, World Bank says it will back gas “where appropriate”
The US wants the World Bank to expand its gas support while climate campaigners are pushing for it to end – its head spoke this week of limited backing for the fossil fuel -
IPCC scientists vow to press on with climate reports despite political deadlock
After governments again failed to agree a timeline, nearly 120 IPCC authors pledged to complete their assessment on time and with full scientific rigour -
Paris Agreement committee snubbed over missing NDC climate plans
Many governments have still not submitted a nationally determined contribution to the UN, breaching a key requirement of the Paris Agreement

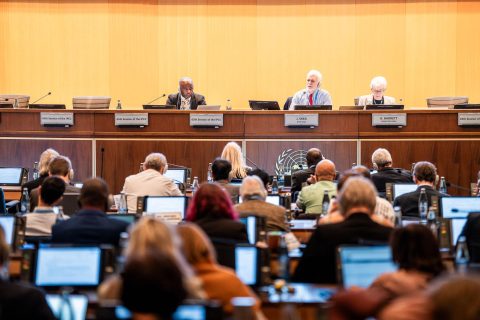

In July, PAICC said 12 countries had ignored its repeated attempts to discuss why they had not published an NDC as required every five years under the 2015 Paris accord.
Members of the committee had been divided over whether to name them, but at a September meeting decided to do so in their annual report to the annual climate COP summit.
By the time the report was published on Friday, only Congo, Senegal and North Korea “had not communicated an NDC or submitted a [Biennial Transparency Report] and had not yet responded to any of the Committee’s notifications, despite several reminders issued by the Committee in this regard”.
Rainforest and renewable energy ambitions
The silence from Congo and Senegal is notable because the former is home to much of the Congo Basin rainforest while the latter has sought billions of dollars in climate finance to support its renewable energy ambitions.
After Brazil, Congo has more rainforest than any country in the world. This forest, and the country’s peatlands, absorb huge amounts of greenhouse gas but are fast being lost to expanding farmland, charcoal production, logging and mining.
Senegal signed a Just Energy Transition Partnership with Canada and wealthy European nations in 2023, to help it meet its renewable energy targets under the-then government of Macky Sall. It was chair of the Least Developed Countries group between January 2022 and December 2023.

Tejas Rao, who is researching the PAICC as part of a doctoral thesis at Cambridge University, said the governments of the three countries should engage with the committee.
“Engagement costs these governments very little and the committee has shown it will listen,” he said.
“Silence leaves the committee with no basis to help, and it leaves the [governments] exposed to the narrative that they are simply disengaged,” he told Climate Home News.
Paris Agreement requirement
The 2015 Paris Agreement requires all parties to publish an NDC every five years outlining their emissions reduction targets, with each plan meant to be more ambitious than the country’s last NDC.
The latest set – the third round of plans, with new targets for 2035 – was due in February 2025. While most countries missed this deadline, all but around 30 – mostly small emitters but including Egypt, Vietnam and Argentina – have now submitted them.
Over the year, the PAICC – which is made up of government climate officials from developed and developing countries – has been communicating with governments that have not submitted NDCs and trying to overcome barriers to them doing so.
Some nations have cited exceptional circumstances as the reason for not submitting an NDC, a process that requires a significant amount of work in tracking emissions and consulting on how to curb them across the economy. For example, a letter from a Sudanese official to the PAICC, seen by Climate Home News, said that the country’s civil war had led to the suspension of its NDC preparation.
-
IPCC scientists vow to press on with climate reports despite political deadlock
After governments again failed to agree a timeline, nearly 120 IPCC authors pledged to complete their assessment on time and with full scientific rigour -
Under US pressure, World Bank says it will back gas “where appropriate”
The US wants the World Bank to expand its gas support while climate campaigners are pushing for it to end – its head spoke this week of limited backing for the fossil fuel -
Who shapes climate science? The equity question facing the IPCC
Early completion of the next global climate science assessment reports risks excluding research from the Global South, which is key to ensuring the findings are fair
The US and Iran are not signed up to the Paris Agreement and so do not have active NDCs, nor does Taiwan, which is not a UN member state.
Rao said that because the PAICC is “facilitative and non-punitive”, naming the countries “is meant to open a door, not close one – the invited consultation is the point”.
“In recent months, governments that explained their constraints, whether capacity, finance or domestic process, have been met with follow-up and support rather than sanction, and the number of silent governments has fallen sharply,” Rao said.
The post Paris Agreement committee names three countries snubbing it over NDCs appeared first on Climate Home News.
Paris Agreement committee names three countries snubbing it over NDCs