

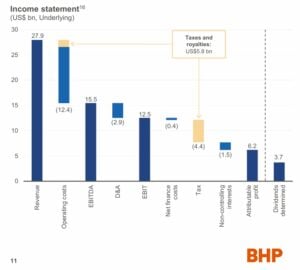
BHP Group delivered a strong first-half performance for FY26, confirming a major shift in global commodity markets. The world’s largest miner posted underlying attributable profit of $6.2 billion, up 22% year over year and broadly in line with forecasts. More importantly, copper has now become the company’s dominant earnings driver.
For the first time in its history, copper contributed 51% of BHP’s underlying EBITDA. This milestone reflects both higher production and stronger prices. It also signals that the long-anticipated structural tightness in copper markets is beginning to materialize.
CEO Mike Henry emphasized that BHP had positioned itself early for this moment. Over the past four years, the company lifted copper production by roughly 30%. That expansion now aligns with rising global demand tied to electrification, renewable energy, and digital infrastructure.
Copper Delivers Record Earnings as Prices Rise
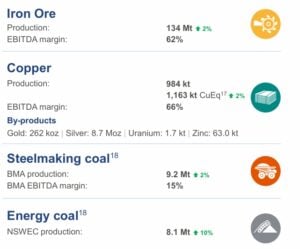
Copper earnings jumped in the first half. The division’s underlying EBITDA rose 59% to $8 billion. Higher prices, up about a third, helped drive the gain. Margins topped 60%, showing strong operations and favorable market conditions.
Strong output from Escondida in Chile, along with solid contributions from South Australia, boosted BHP’s results. As a result, the company raised its FY26 copper production guidance to 1.9–2.0 million tonnes. While some competitors lowered their forecasts, BHP went the other way, showing confidence in its operations.
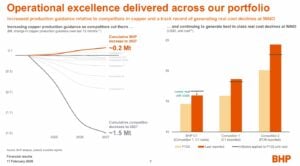
At the same time, better cost management improved profits. Unit costs dropped across major copper assets, helping cash flow while prices stayed high. The company’s internal operating system also kept operations running efficiently and productively.
Meanwhile, iron ore earnings edged higher but showed slower momentum. Demand from Chinese steel exports and manufacturing offset weakness in the country’s property sector. However, China’s broader growth has plateaued. That shift explains why copper, rather than iron ore, now anchors BHP’s earnings profile.
Growth Pipeline Expands Beyond Copper
Copper is driving earnings now, but BHP is also looking at long-term growth. The Jansen Stage 1 potash project is on track to start production by mid-2027. Costs were revised up to $8.4 billion. Once fully operational, each stage could generate about $1 billion in annual EBITDA.
BHP also has copper growth options in Chile, Argentina, Arizona, and South Australia. The company aims to reach around 2.5 million tonnes of copper-equivalent production per year by the mid-2030s. Growth is expected to stay steady through 2035.
Strategic moves are helping BHP’s position. Recent deals could free over $6 billion. This gives the company flexibility to invest in high-return copper projects.
Copper Market Turns Tighter Heading into 2026
The wider market also supports a positive outlook for copper. The International Copper Study Group (ICSG) says global mine supply growth slowed more than expected. Mine production is expected to rise only slightly in 2025. Refined production may grow very slowly, only at 0.9% in 2026, because of concentrate shortages.
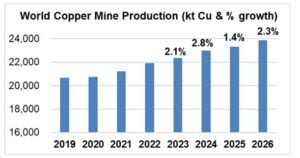
- As a result, the market, which had a surplus of 178,000 tonnes in 2025, could swing to a 150,000-tonne deficit in 2026. This is a big change from earlier forecasts that expected a surplus.
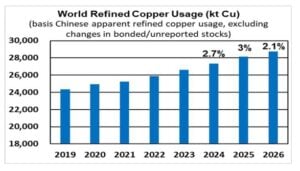
At the same time, demand keeps rising. Global refined copper usage could grow about 2% in 2026, reaching nearly 29 million tonnes. Asia continues to drive growth, even though Chinese consumption has slowed. Renewable energy, electric vehicles, grid upgrades, urbanization, and digital infrastructure all support long-term copper demand.
Copper Prices to Hold Above $12,000?
LME copper prices have fluctuated in early 2026. Prices fell from €13,327 per tonne on February 11 to €12,757 per tonne on February 16, showing short-term volatility. COMEX spot prices also dipped to $5.7710 per pound on February 12, down 3% daily but still up over 25% year-over-year. LME stocks rose slightly to 211,850 tonnes, signaling some inventory replenishment.
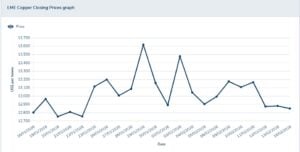
J.P. Morgan forecasts an average of $12,075 per tonne in 2026. Prices could reach $12,500/tonne in the second quarter. Tight inventories and supply disruptions make the first half of the year particularly bullish.
Data centers are adding to demand. J.P. Morgan says copper used in data center installations could hit 475,000 tonnes in 2026, up 110,000 tonnes from this year. While still a small part of global demand, it adds pressure to an already tight market.
Higher prices could push some buyers toward aluminum. However, analysts warn that substitution is slow. It won’t quickly ease copper shortages.
- CLICK HERE FOR: LIVE COPPER PRICES
BHP’s Strategic Advantage in a Structural Shift
For BHP, these trends back its long-term plan. Copper now makes up more than half of group earnings. The company increased production ahead of the market tightening. If prices stay above $12,000, margins could improve further.
Short-term volatility may continue. Slower growth in China or a weaker global economy could push prices down. On the other hand, mine disruptions or higher AI-related demand could push prices up.
Copper is vital for the energy transition. Electrification, decarbonization, and digitalization all need large amounts of the metal. With a projected deficit in 2026 and limited supply growth, the market fundamentals remain strong.
BHP’s results show more than a strong half-year. They highlight a bigger shift in commodities, where copper increasingly drives industrial growth and the clean energy transition.
The post Copper Drives BHP’s $6.2B Profit Surge in FY26 Half-Year Results appeared first on Carbon Credits.

EU carbon credit claims changed on 27 September 2026, the day the Directive (EU) 2024/825 began to apply across the European Union. The change is narrow. It changes how a company can talk about the credits it buys. A product can no longer be called neutral on the strength of compensation alone; however, every specific, evidenced statement about what a company measured, reduced, and funded stays fully available.

The post Promoting Improved Cooking Practices in Nigeria appeared first on Terrapass.



-
Climate Change1 year ago
Guest post: Why China is still building new coal – and when it might stop
-

 Greenhouse Gases2 years ago
嘉宾来稿:满足中国增长的用电需求 光伏加储能“比新建煤电更实惠”
-
Greenhouse Gases1 year ago
Guest post: Why China is still building new coal – and when it might stop
-

 Climate Change2 years ago
嘉宾来稿:满足中国增长的用电需求 光伏加储能“比新建煤电更实惠”
-

 Renewable Energy12 months ago
Sending Progressive Philanthropist George Soros to Prison?
-
Climate Change2 years ago
Bill Discounting Climate Change in Florida’s Energy Policy Awaits DeSantis’ Approval
-
Greenhouse Gases1 year ago
嘉宾来稿:探究火山喷发如何影响气候预测
-

 Climate Change2 years ago
Analysis: China’s CO2 falls 1% in Q2 2024 in first quarterly drop since Covid-19