


Carbon Footprint
Microsoft Signs 626,000-Tonne Carbon Removal Deal with Svante and Indigenous-Led North Star Project in Canada

Microsoft (MSFT stock) has signed a long-term carbon removal agreement that highlights both the scale and direction of the emerging carbon market. The company will purchase 626,000 tonnes of durable carbon dioxide removal (CDR) credits over 15 years from the North Star project in Saskatchewan, Canada.
This project is being developed by Svante Technologies Inc. in partnership with the Meadow Lake Tribal Council (MLTC), through their joint venture North Star Carbon Solutions LP.
The facility will use bioenergy with carbon capture and storage (BECCS) to remove CO₂ from the atmosphere and store it permanently underground. Notably, the project will be co-located at the existing MLTC Bioenergy Centre and powered by waste biomass from a nearby Indigenous-owned sawmill.
This makes it one of the first fully integrated, Indigenous-led BECCS projects in Canada and a landmark deal in Microsoft’s growing carbon removal portfolio.
Indigenous-Led Carbon Project Sets New Benchmark in Canada
The North Star project stands out not just for its technology, but also for its ownership model. It is expected to be Canada’s first major Indigenous-owned, high-quality carbon removal project. The Meadow Lake Tribal Council, which represents several First Nations communities, plays a central role in both ownership and development.
This structure ensures that economic benefits stay within the local community. During construction, the project is expected to create around 50 jobs. Once operational, it will support a smaller but steady workforce while also boosting demand for nearby businesses. As a result, the project delivers both climate and economic value.
Equally important, the facility will rely on an existing industrial ecosystem. The MLTC Bioenergy Centre already generates renewable energy using wood waste.
That waste comes from the NorSask Forest Products sawmill, which is owned by MLTC and supplied through sustainably managed forests. This close integration reduces costs, improves efficiency, and strengthens the project’s environmental credibility.
Phillip Goodman, Director of Carbon Removal Portfolio, Microsoft, said:
“We’re pleased to work with North Star Carbon Solutions and Meadow Lake Tribal Council to help advance high-quality, durable carbon dioxide removal. To meet our climate goals, we need to help scale solutions that deliver durable storage and are backed by rigorous monitoring and verification. This agreement supports an Indigenous-led collaboration that enables the infrastructure needed to bring durable carbon removal online in Canada, thus creating a pathway for additional projects over time.”
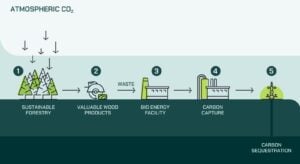
How the North Star BECCS System Works
The North Star facility uses BECCS, a technology widely seen as critical for achieving net-zero emissions. It combines renewable energy production with carbon capture to deliver negative emissions.
- In this system, trees first absorb CO₂ from the atmosphere as they grow. When these trees are processed for wood products, leftover biomass is used as fuel to generate energy.
- Normally, this process would release carbon back into the air. However, in this case, the CO₂ is captured before it can escape.
- The captured carbon is then compressed, transported, and injected deep underground into a secure geological formation.
This ensures long-term storage, often lasting hundreds or even thousands of years. Continuous monitoring systems track the stored carbon to ensure safety and permanence.
Here’s a representation of the BECCS process:
A Fully Integrated “Source-to-Sink” Model
From the process explained above, it’s clear that one of the most important features of the North Star project is its fully integrated design. It connects every step of the carbon removal process, from biomass supply to permanent storage.
This end-to-end system improves efficiency and reduces uncertainty. It also strengthens the credibility of the carbon credits produced.
Significantly, Svante will fund the project through its early stages, supporting development until a final investment decision is made. Commercial operations are expected to begin in early 2029.
Reliable Carbon Removal, Verified and Transparent
At full capacity, the facility is expected to capture up to 90,000 tonnes of CO₂ annually. Over the 15-year contract period, this will translate into the delivery of 626,000 tonnes of verified carbon removal credits to Microsoft.
All credits will follow strict monitoring, reporting, and verification (MRV) standards, ensuring transparency and quality.
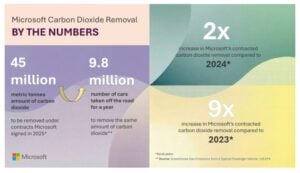
Microsoft Scales Up Carbon Removal Strategy
This agreement is part of Microsoft’s broader push to scale carbon removal. The company has rapidly increased its purchases over the past few years, signaling a shift from small pilot projects to large, long-term commitments.
In 2023, Microsoft contracted roughly 5 million tonnes of carbon removal. By 2024, that number rose to 22 million metric tons. In 2025, the target surged further to around 45 million tonnes, as announced by the company. This sharp increase shows how quickly the company is building a diversified carbon removal portfolio.
Importantly, Microsoft does not rely on a single technology. Instead, it spreads its investments across multiple pathways, including BECCS, direct air capture, and mineralization. This approach reduces risk while supporting the development of different solutions.
Recent agreements reflect this strategy. These include multi-million-tonne deals with BECCS facilities in the United States and Europe. Together, they position Microsoft as one of the most influential buyers in the global carbon removal market.
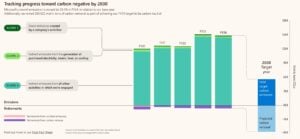
Rising Emissions Make Carbon Removal Essential
Despite its climate commitments, Microsoft faces a growing emissions challenge. The company’s total emissions have increased by more than 30% compared to 2020 levels. This rise is largely driven by the rapid expansion of data centers, cloud services, and AI infrastructure.
These operations require vast amounts of energy and materials, making it difficult to cut emissions quickly. As a result, carbon removal has become a key part of Microsoft’s strategy.
However, the company is clear about its priorities. It focuses first on reducing emissions through efficiency and clean energy. Carbon removal is used only for emissions that cannot be eliminated.
This approach supports Microsoft’s ambitious net-zero goals. The company aims to become carbon negative by 2030 and aims to run on 100% renewable electricity and eliminate all historical emissions by 2050.
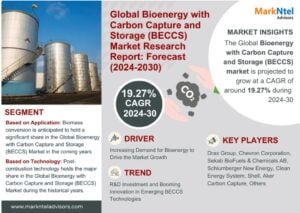
BECCS Market Gains Momentum
The North Star deal also reflects growing interest in BECCS technology. While still at an early stage, the global BECCS market is expanding rapidly. Analysts expect it to grow at a CAGR of around 19.27% from 2024 to 2030 as governments and companies seek reliable carbon removal solutions.
BECCS is particularly valuable because it can deliver durable removals. Unlike some nature-based solutions, which may face risks like fires or land-use changes, BECCS stores carbon permanently underground. This makes it attractive for companies looking for high-quality credits.
According to the International Energy Agency, BECCS could play a major role in climate mitigation. It may contribute up to 15% of the emissions reductions needed by 2100 to limit global warming to 2°C.
At the same time, challenges remain. Concerns about biomass sourcing, land use, and storage safety continue to shape the debate. Even so, projects like North Star aim to address these issues through sustainable sourcing and rigorous monitoring.
North Star Marks a New Era in Carbon Markets
In conclusion, the Microsoft–North Star agreement highlights how quickly the carbon removal market is evolving. Large buyers are now committing to long-term deals that help bring new projects to life.
At the same time, the project sets a new benchmark for inclusive climate action. Indigenous ownership ensures that local communities benefit directly from the energy transition.
As demand for durable carbon removal continues to grow, more projects like North Star are likely to emerge. These developments will play a critical role in helping companies meet climate targets while building a scalable, high-integrity carbon market.
In that sense, this deal is more than just a contract. It is a clear signal that carbon removal is moving from concept to reality—and becoming a core part of global climate strategy.
The post Microsoft Signs 626,000-Tonne Carbon Removal Deal with Svante and Indigenous-Led North Star Project in Canada appeared first on Carbon Credits.

SHEIN, the global online fashion and lifestyle retailer, has taken a new step in cutting the climate impact of its logistics. The company signed an agreement with DHL Group to use DHL’s GoGreen Plus service. This service allows corporate customers to support the use of sustainable aviation fuel (SAF) in air cargo operations.
SAF is blended into regular jet fuel to reduce carbon emissions from flights. This move is part of SHEIN’s broader work to explore low‑carbon solutions for its air transport footprint.
Mustan Lalani, SHEIN’s Head of Sustainability, remarked:
“Working with partners such as DHL allows us to better understand how sustainable aviation fuel solutions may be incorporated into air cargo logistics. Initiatives like this are part of SHEIN’s broader efforts to explore how emerging approaches across the aviation sector may contribute to addressing carbon emissions associated with air transport.”
What Sustainable Aviation Fuel Is: Cutting Emissions at the Source
DHL’s GoGreen Plus service gives customers lifecycle emissions reductions from SAF. It uses recognized accounting and certification methods. This means SHEIN can include a share of SAF‑related emissions reductions in its corporate reporting.
The collaboration follows earlier deals. In 2025, SHEIN signed a memorandum of understanding with Lufthansa Cargo to explore sustainable air freight technologies and fuel use.
Sustainable aviation fuel comes from renewable or low-carbon sources. These include used cooking oil, agricultural waste, and non-fossil carbon materials. Compared with conventional jet fuel, SAF can cut lifecycle greenhouse gas emissions by up to 80%. This is because SAF feedstocks carry less net carbon when burned, considering their origin and life cycle.
Air transport remains a significant source of emissions as global trade and e‑commerce grow. SAF is one of the few scalable solutions available today that can work with existing aircraft engines and fuel infrastructure. It reduces emissions at the source rather than offsetting them after the fact.
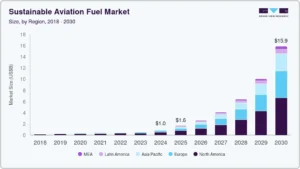
SAF is still a small part of global aviation fuel. However, demand and investment are rising due to the industry’s push for net-zero goals. The chart below shows how much SAF is necessary to meet the air transport net-zero target.

Growing Market for SAF: A $16 Billion Industry by 2030
The global sustainable aviation fuel market is expanding rapidly. A recent report by Grand View Research estimates the market was worth US$1.04 billion in 2024. It projects that the industry could reach US$15.85 billion by 2030, growing at a 57.5% compound annual growth rate (CAGR) from 2025 to 2030.
This growth is driven by several factors:
- Rising corporate and airline decarbonization targets,
- Stronger environmental regulations,
- Supportive government policy, and
- Increasing investment in SAF technologies.
Airlines and logistics providers are under pressure to cut emissions and invest in cleaner fuel alternatives.
Bio-based SAF comes from plants, waste oils, or renewables. It leads the market since it blends easily with jet fuel, needing few changes to aircraft.
Despite strong projected growth, SAF still accounts for less than 1% of global jet fuel use today. Industry groups, like the International Air Transport Association (IATA), estimate that SAF will supply about 0.7% of aviation fuel by 2025. This is due to slow production growth. By 2030, SAF production ranges from 17 to 20 Mt.

Governments in some regions are introducing mandates to increase SAF usage. For example, the UK requires airlines to blend at least 2% SAF starting in 2025, rising to 10% by 2030 and 22% by 2040. These rules aim to spur SAF production and adoption.
- SEE MORE: Heathrow Boosts 2026 Sustainable Aviation Fuel (SAF) Incentive 2% Above UK Government Mandate
SHEIN’s Sustainability Goals and Progress
SHEIN has publicly committed to reducing its environmental impact and aligning with climate science goals. The company’s science‑based, net‑zero target has been approved by the Science Based Targets initiative (SBTi). Under this plan, SHEIN aims to reach net‑zero greenhouse gas emissions across its value chain by 2050.
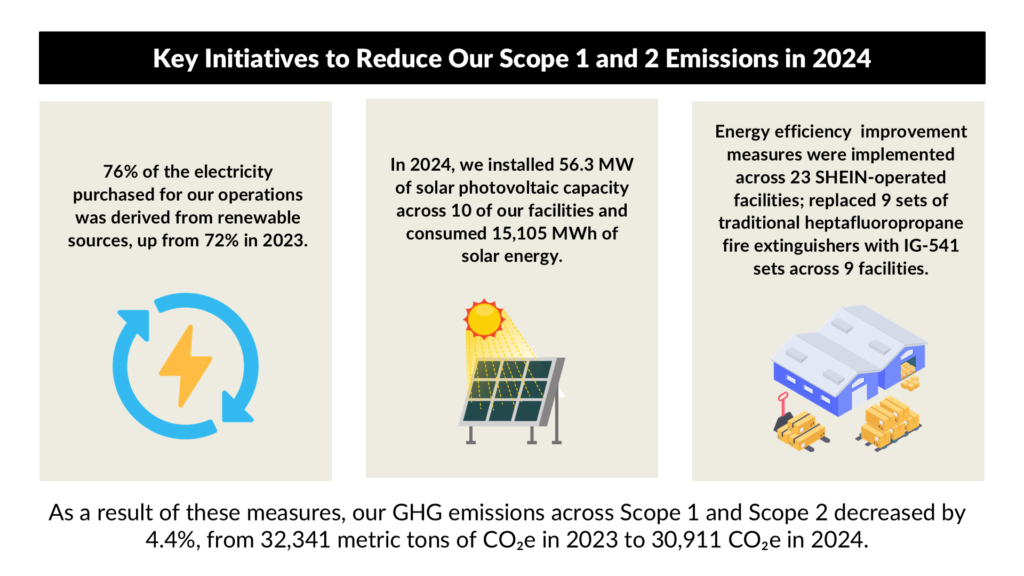
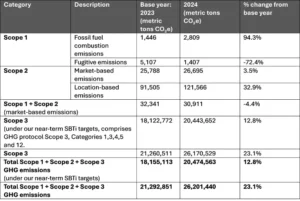
The approved targets include reducing Scope 1 and 2 emissions by 42% by 2030 and reducing Scope 3 emissions by 25% by 2030. SHEIN also plans to source 100% renewable electricity by 2030 as part of its energy transition.
SHEIN developed a decarboniZation roadmap in 2024 with support from external sustainability consultants. This roadmap guides the company’s emissions reduction efforts and is designed to align with the Paris Agreement’s goal of limiting warming to 1.5 °C.
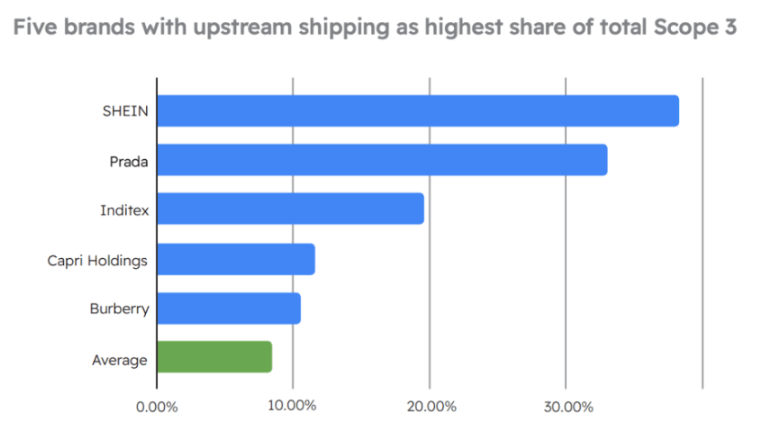
The logistics footprint — especially Scope 3 emissions from transportation and deliveries — is a major contributor to SHEIN’s overall emissions profile. Exploring low‑carbon fuels like SAF is a practical step in addressing these emissions categories.
Pilots, Traceability, and Carbon Accounting
DHL’s GoGreen Plus service lets customers increase the share of SAF blended into the fuel used in its air cargo network. Under the SHEIN agreement, partners like logistics providers, airlines, and certification frameworks team up. They work to allocate emissions reductions clearly for SHEIN’s reports.
SHEIN’s SAF initiatives include pilot programmes with cargo partners. In 2025, SHEIN procured 187.3 tonnes of SAF for use on 14 Atlas Air charter flights. This reduced an estimated 579.1 tonnes of CO₂ equivalent emissions compared with conventional aviation fuel.
The company is also participating in a SAF pilot in China alongside China National Aviation Fuel (CNAF) and the Second Research Institute of Civil Aviation of China. SHEIN plans to procure SAF through Air China Cargo, using traceability systems to document SAF usage and related emissions benefits.
Moreover, SHEIN joined the World Economic Forum’s Green Fuel Forward campaign. This campaign works to speed up SAF adoption in the Asia-Pacific region. It does this by building capacity, raising awareness, and encouraging collaboration.
Limited Supply, High Costs, Big Potential
Sustainable aviation fuel holds promise but also faces hurdles. Current SAF production capacity is limited, and costs remain significantly higher than conventional jet fuel. This makes widespread adoption difficult for many companies and airlines.
Because SAF is still a small part of the global aviation fuel supply, its current emissions impact is modest. SHEIN acknowledges that the emissions reductions from its initial SAF activities are limited relative to its total air transport footprint. But these pilots will help build experience and partnerships for broader future deployment.
Looking ahead, SAF market growth could ramp up as production capacity rises and regulatory and corporate demand increase. With strong annual growth rates, more companies might add SAF to their supply chains. This helps them meet climate goals and satisfy stakeholders.
For SHEIN, expanding SAF use through partnerships like DHL’s GoGreen Plus could help the company gain operational insights, shape emissions accounting frameworks, and position itself as a participant in emerging low‑carbon logistics solutions.
The post SHEIN Teams Up with DHL to Cut Air Cargo Emissions with Sustainable Fuel appeared first on Carbon Credits.

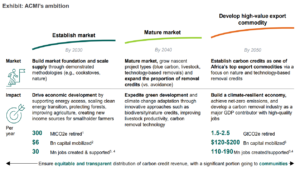
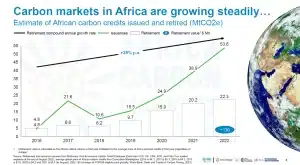
Africa’s carbon markets are growing fast. Governments, companies, and global institutions are paying more attention to the continent’s carbon credit potential. Estimates from a renewable energy company’s research arm, Axina Group, show Africa’s carbon market could reach $100 billion by 2030 and grow even more over time.
This growth depends on strong policies and good market systems. Countries that control how carbon credits are made, verified, and sold—called sovereign carbon markets—can capture more value. This also helps them reach climate goals.
The Africa Carbon Markets Initiative (ACMI) sets a clear roadmap. It aims to produce 300 million carbon credits per year by 2030, growing to 1.5 billion credits per year by 2050. This could make Africa one of the world’s largest carbon credit producers.
Global organizations, including the World Bank, support this view. They point to Africa’s natural resources and improving policies as key reasons for growth.
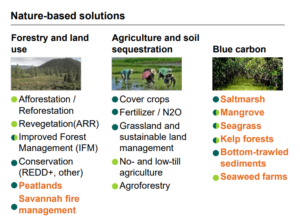
Africa’s Green Gold: Forests, Wetlands, and Carbon Sinks
Africa has huge natural carbon sinks. These include tropical forests, wetlands, and grasslands. They absorb carbon dioxide from the air, which forms the basis for carbon credits.
Tropical forests alone absorb 1.1–1.5 billion tonnes of CO₂ each year. Millions of hectares of land can also be restored. Projects like reforestation and improved land use create carbon credits. They also improve soil, water, and biodiversity, and provide jobs for local communities.
Nature-based solutions are expected to play a big role. Globally, they could deliver up to one-third of the emissions reductions needed by 2030. Africa has a large share of this opportunity. But today, the continent still produces a small part of global carbon credits, indicating there is room for strong growth.
Several companies and platforms are shaping Africa’s carbon market by developing projects and linking them to buyers. For example, Africa Carbon Partners develops large nature‑based projects that protect forests and generate verified credits across West and Central Africa.
Moreover, ZeroCarbon Africa connects smallholder farmers to global carbon markets with real‑time tracking and fair pricing. Meanwhile, Climera uses blockchain technology to increase transparency in carbon credit issuance and tracking.
Other regional platforms like SB Power Africa and PanAfricaCarbon offer project development and trading services. In addition, global certification bodies like Verra support many African projects by certifying carbon credits under established standards.
From Voluntary Markets to Sovereign Systems
Most African carbon projects now operate in voluntary carbon markets (VCMs). Companies buy credits to offset emissions they cannot eliminate. But Africa accounts for only 9–11% of retired carbon credits in recent years.
Sovereign carbon market systems can change this, with governments taking a central role. They set rules, approve projects, and manage sales. This improves transparency and ensures projects meet national climate goals, also called Nationally Determined Contributions (NDCs) under the Paris Agreement.
Countries such as Kenya, Nigeria, and Gabon are already building national carbon strategies. These strategies aim to capture more value locally. Projects often include rules that share revenue with governments and communities. This can fund local services, climate projects, and economic development.
The AFRICA RISING 2026 report by Axina Group projects specific national revenue from carbon-related assets using sovereign systems. For example:
- Ghana could generate $1.8 billion annually by 2030
- Nigeria could capture over $400 million annually
- Tanzania could reach over $120 million annually
- Mozambique and Uganda also show potential for substantial carbon-linked revenue
These figures illustrate how sovereign systems can keep capital on the continent while encouraging local reinvestment and community benefits.
$100B Carbon Opportunity and Millions of Jobs
Carbon markets are expanding worldwide. The global carbon market reached about $949 billion in 2023. Voluntary carbon markets alone could grow to $10–40 billion by 2030. Carbon removal markets could reach $100 billion per year by 2030–2035, driven by industries like technology, finance, and aviation.
Africa’s projected $100 billion market by 2030 would make it one of the fastest-growing regions. High-quality carbon credits are in demand as companies try to reach net-zero emissions.
Carbon markets can also create many jobs. The ACMI estimates 30 million jobs by 2030, rising to over 110 million by 2050. Jobs include forest restoration, renewable energy projects, land management, and monitoring.
More notably, carbon finance can attract private investment. Many African countries have funding gaps for climate projects. Carbon markets offer a way to bring in private capital.
Revenue from carbon credits can also support communities. At $50 per tonne, nature-based projects could generate $15 billion annually. At $100 per tonne, this could rise to $57 billion. These projects create millions of jobs while helping the environment.
By integrating sovereign systems, individual countries can capture larger shares of these revenues. The AFRICA RISING 2026 report highlights that, with proper frameworks, countries like Ghana, Nigeria, and Tanzania could earn hundreds of millions to billions annually from carbon assets. This shows the economic value of combining policy, technology, and natural resources.
How Africa Could Lead Globally
Africa has a unique advantage. It has large carbon sinks and relatively low historical emissions compared to developed regions. This means it can grow carbon projects while still meeting climate targets.
If ACMI and country-level strategies succeed, Africa could become a major global supplier of carbon credits. Companies worldwide will need these credits to meet net-zero goals.
Nature-based carbon projects also deliver co-benefits. They improve soil, water, and biodiversity. They support rural livelihoods and local economies. This makes carbon markets a climate and development tool at the same time.
Trust, Fairness, and the Rules of the Game
However, challenges remain. Market integrity is key: Buyers need to trust that credits represent real, permanent emissions reductions.
There are concerns about fairness. Critics warn of “carbon colonialism,” where wealthy countries benefit more than local communities. Policies must ensure communities get a fair share of revenue.
Also, policy gaps exist. Many countries lack clear rules for carbon markets, which can scare investors. Infrastructure and technical tools, such as land management systems and data monitoring, are still developing. Carbon prices vary depending on project type and quality, adding uncertainty.
To succeed, African governments need strong laws, clear policies, and transparent systems. Partnerships with international organizations can build technical expertise. Monitoring, reporting, and verification (MRV) systems are crucial to ensure credibility.
A Defining Decade Ahead for Africa’s Carbon Markets
Africa’s carbon market is at a turning point. The next ten years will shape how the sector grows and how much it benefits the economy and climate.
If plans succeed, Africa could produce hundreds of millions of carbon credits annually. This would support global climate goals, attract investment, create jobs, and drive sustainable development.
The market’s size depends on policy, pricing, and execution, but demand for carbon credits is rising. Africa has the natural resources to meet that demand. With the right systems, the continent can turn its carbon potential into a long-term economic and climate advantage.
The post Africa’s $100B Carbon Opportunity: How Sovereign Markets Could Lead the World appeared first on Carbon Credits.

Cropped 8 April 2026: Iran war drives up food prices | Two nature talks conclude | Return of UK’s tallest bird

India withdraws bid to host COP33 climate talks

Best of Sustainability In Your Ear: Plastic Bank’s David Katz on Grassroots Recycling Solutions
-
Climate Change8 months ago
Guest post: Why China is still building new coal – and when it might stop
-
Greenhouse Gases8 months ago
Guest post: Why China is still building new coal – and when it might stop
-

 Greenhouse Gases2 years ago
嘉宾来稿:满足中国增长的用电需求 光伏加储能“比新建煤电更实惠”
-
Climate Change2 years ago
Bill Discounting Climate Change in Florida’s Energy Policy Awaits DeSantis’ Approval
-

 Climate Change2 years ago
嘉宾来稿:满足中国增长的用电需求 光伏加储能“比新建煤电更实惠”
-
Climate Change Videos2 years ago
The toxic gas flares fuelling Nigeria’s climate change – BBC News
-

 Renewable Energy6 months ago
Sending Progressive Philanthropist George Soros to Prison?
-

 Carbon Footprint2 years ago
US SEC’s Climate Disclosure Rules Spur Renewed Interest in Carbon Credits