

Greenland is closing in on three decades of continuous annual ice loss, with 1995-96 being the last year in which the giant ice sheet grew in size.
With another melt season over, Greenland lost 105bn tonnes of ice in 2024-25.
The past year has seen some notable events, including ongoing ice melt into the month of September – well beyond the end of August when Greenland’s short summer typically draws to a close.
In a hypothetical world not impacted by human-caused climate change, ice melt in Greenland would rarely occur in September – and, if it did, it would generally be confined to the south.
In this article, we explore how Greenland’s ice sheets fared over the 12 months to August 2025, including the evidence that the territory’s summer melting season is lengthening.
(For our previous analyses of Greenland’s ice cover, see coverage in 2024, 2023, 2022, 2021, 2020, 2019, 2018, 2017, 2016 and 2015.)
Surface mass balance
The seasons in Greenland are overwhelmingly dominated by winter.
The bitterly cold, dark winter lasts up to ten months, depending on where you are. In contrast, the summer period is generally rather short, starting in late May in southern Greenland and in June in the north, before ending in late August.
Greenland’s annual ice cycle is typically measured from 1 September through to the end of August.
This is because the ice sheet largely gains snow on the surface from September, accumulating ice through autumn, winter and into spring.
Then, as temperatures increase, the ice sheet begins to lose more ice through surface melt than it gains from snowfall, generally from mid-June. The melt season usually continues until the middle or end of August.
Over this 12-month period, scientists track the “surface mass balance” (SMB) of the ice sheet. This is the balance between ice gains and losses at the surface.
To calculate ice gain and losses, scientists use data collected by high-resolution regional climate models and Sentinel satellites.
The SMB does not consider all ice losses from Greenland – we will come to that later – but instead provides a gauge of changes at the surface of the ice sheet.
According to our calculations, Greenland ended the year 2024-25 with an overall SMB of about 404bn tonnes. This is the 15th highest SMB in a dataset that goes back 45 years, exceeding the 1981-2010 average by roughly 70bn tonnes.
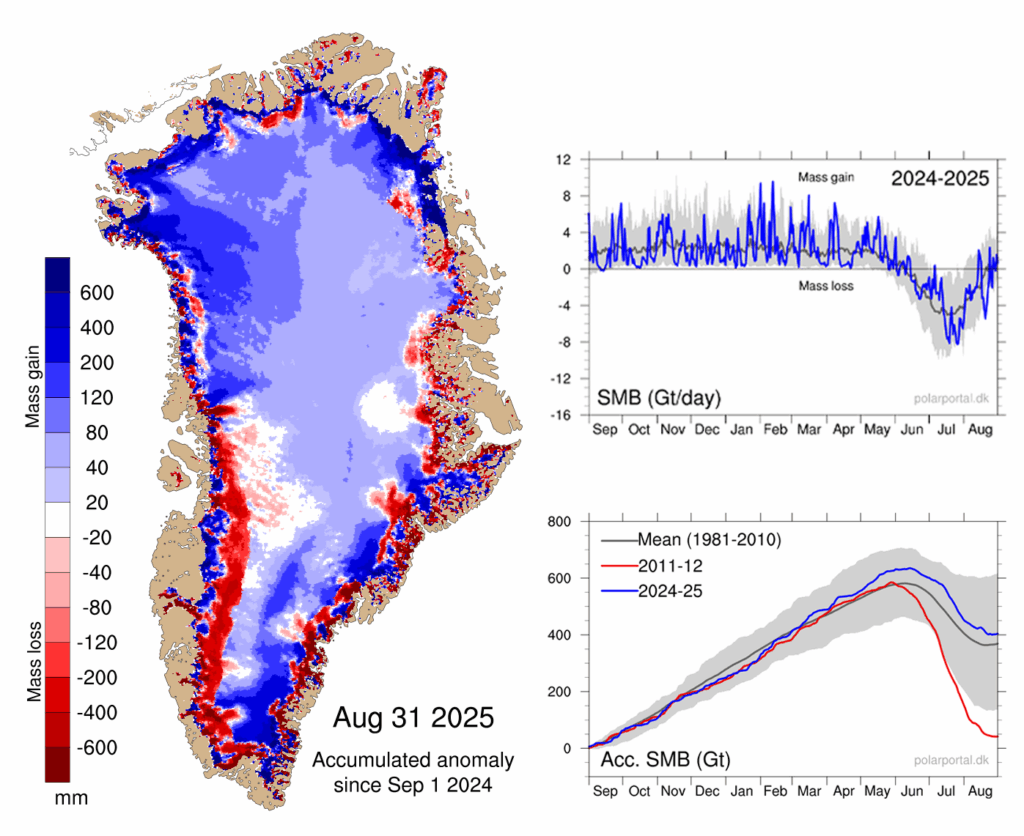
This year’s SMB is illustrated in the maps and charts below, based on data from the Polar Portal.
The blue line in the upper chart shows the day-to-day SMB. Large snowfall events become visible as “spikes”. The blue line in the lower chart depicts the accumulated SMB since 1 September 2024. In grey, the long-term average and its variability are shown. For comparison, the red line shows the record-low year of 2011-12.
The map shows the geographic spread of SMB gains (blue) and losses (red) for 2024-25, compared to the long-term average.
It illustrates that southern and north-western Greenland had a relatively wet year compared to the long-term average, while there was mass loss along large sections of the coast, in particular in the south-west. The spikes of snow and melt are clearly visible in the graphs on the right.
Lengthening summer
Scientists have traditionally pinned the start of the “mass balance year” in Greenland to 1 September, given that this is when the ice sheet typically starts to gain mass.
However, evidence has started to emerge of a lengthening of the summer season in Greenland – as predicted some time ago by climate models.
The start of the 2024-25 mass balance year in Greenland saw ice melt continuing into September. This included a particularly unusual spike in ice melt in the northern part of the territory in September as well as all down the west coast.
In a world without human-caused climate change, ice melt in September would be very rare – and generally confined to the south.
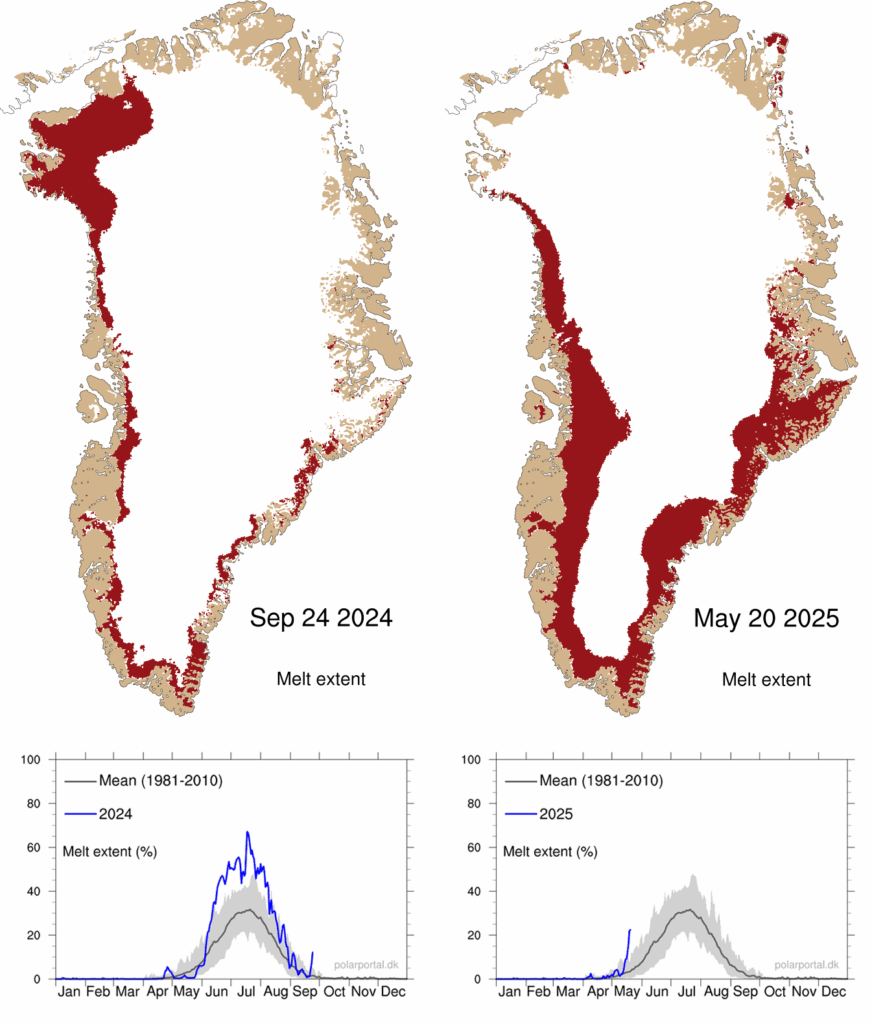
Greenland also saw an early start to the summer melt season in 2025. The onset of the melting season, defined as the first of at least three days in a row with melting over more than 5% of the ice sheet, was on 14 May. This is 12 days earlier than the 1981-2025 average.
The maps below show the extent of melt (red shading) across the ice sheet on 24 September 2024 (left) and 20 May 2025 (right). The blue lines in charts beneath show the percentage melt in 2024 (left) and 2025 (right), up to these dates, compared to the 1981-2010 average (grey).
The melt season began with a significant spike of melting across the southern part of the ice sheet. This happened in combination with sea ice breaking up particularly early in north-west Greenland, allowing the traditional narwhal hunt to start much earlier than usual.
Surface melt
The ablation season, which covers the period in the year when Greenland is losing ice, started a little late. The onset of the season – defined as the first of at least three days in a row with an SMB below -1bn tonnes – began on 15 June, which is two days later than the 1981-2010 average.
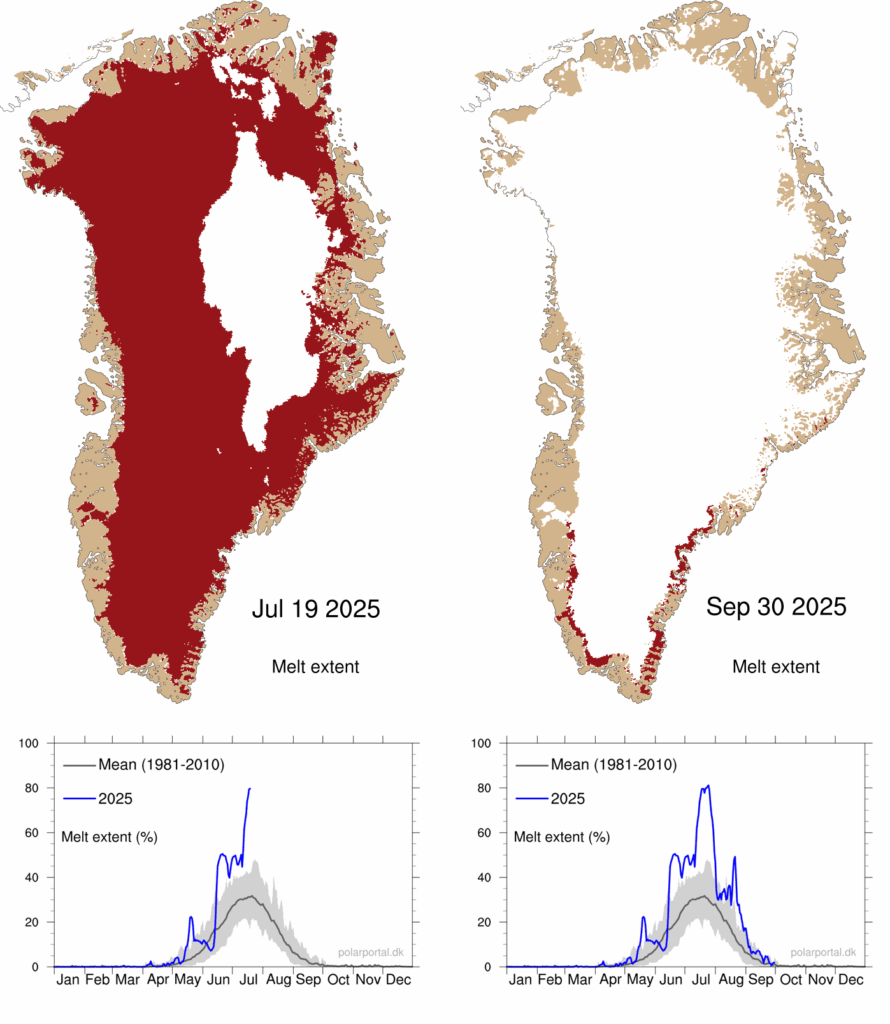
Overall, during the 2025 summer, a remarkably large percentage of the ice sheet was melting at once. This area was larger than the 1981-2010 average for three and a half months (mid-June to end of September).
In mid-July, melting occurred over a record area. For three days in a row, melting was present over more than 80% of the area of the ice sheet – peaking at 81.2%. This is the highest value in our dataset, which started in 1981.
The red shading in the maps below shows the extent of melting across Greenland on 19 July (left) and 30 September (right) 2025. The charts beneath show the daily extent of melting through 2025 (blue line), up to these dates, compared to the 1981-2010 average.
Snowfall
However, the SMB is not just about ice melt.
There was a lack of snowfall in the early winter months (September to January), particularly in south-east Greenland, which is typically the wettest part of the territory. The months that followed then saw abundant snow, which brought snowfall totals up closer to average by the start of summer.
A cold period at the end of May and in June protected the ice sheet from excessive ice loss. Melt then continued rather weakly until mid-July.
This was followed by strong melting rates in the second half of July and again in mid-August.
Overall, with both ice melt and snowfall exceeding their historical averages for the year as a whole, the SMB of the Greenland ice sheet ended above the 1981-2010 average.
These increases in snowfall and melt are in line with what scientists expect in a warming climate. This is because air holds more water vapour as it warms – leading to more snowfall and rain. Warmer temperatures also lead to more ice melt.
Total mass balance
The surface mass balance is just one component of the “total” mass balance (TMB) of the Greenland ice sheet.
The total mass balance of Greenland is the sum of the SMB, the marine mass balance (MMB) and basal mass balance (BMB). In other words, it brings together calculations from the surface, sides and base of the ice sheet.
The MMB measures the impact of the breaking off – or “calving” – of icebergs, as well as the melting of the front of glaciers where they meet the warm sea water. The MMB is always negative and has increased towards more negative values over the last decades.
BMB refers to ice losses from the base of the ice sheet. This makes a small negative contribution to the TMB.
(The only way for the ice sheet to gain mass is through snowfall.)
The continued mass loss observed in Greenland is primarily due to a weakening of the SMB – caused by rising melt combined with insufficient compensation of lost ice through snowfall.
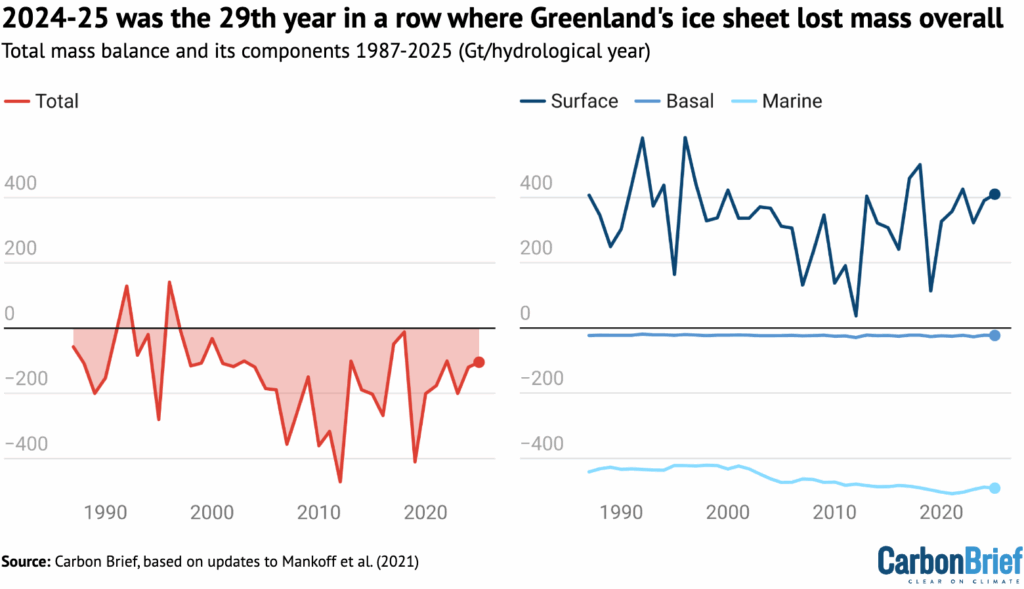
The figure below shows how much ice the Greenland ice sheet has lost (red) going back to 1987, which includes the SMB (dark blue), MMB (mid blue) and BMB (light blue). The analysis, which uses data from three models, is based on 2021 research published in Earth System Science.
Despite a relatively high SMB, high calving rates meant that Greenland lost 105bn tonnes of ice over the 12-month period.
This means that 2024-25 was the 29th year in a row with a Greenland ice sheet overall mass loss. As the chart shows, Greenland last saw an annual net gain of ice in 1996.
Satellite data
The mass balance of the Greenland ice sheet can also be measured by looking at the Earth’s gravitational field, using data captured by the Grace and Grace-FO satellite missions – a joint initiative from NASA and the German Aerospace Center.
The Grace satellites are twin satellites that follow each other closely at a distance of about 220km, which is why they are nicknamed “Tom and Jerry”. The distance between the two depends on gravity – which is, in turn, related to changes in mass on Earth, including ice loss.
Therefore, the distance between the two satellites, which can be measured very precisely, can be used to calculate loss of mass from the Greenland ice sheet.
Overall, the satellite data reveals that Greenland’s ice sheet lost around 55bn tonnes of ice over the 2024-25 season.
There is reasonably good agreement between the Grace satellite data and the model data, which, as noted above, finds that 105bn tonnes of ice was lost in Greenland over the same period.
However, the alignment of the two datasets – which are fully independent of each other – becomes more clear once a longer time period is considered.
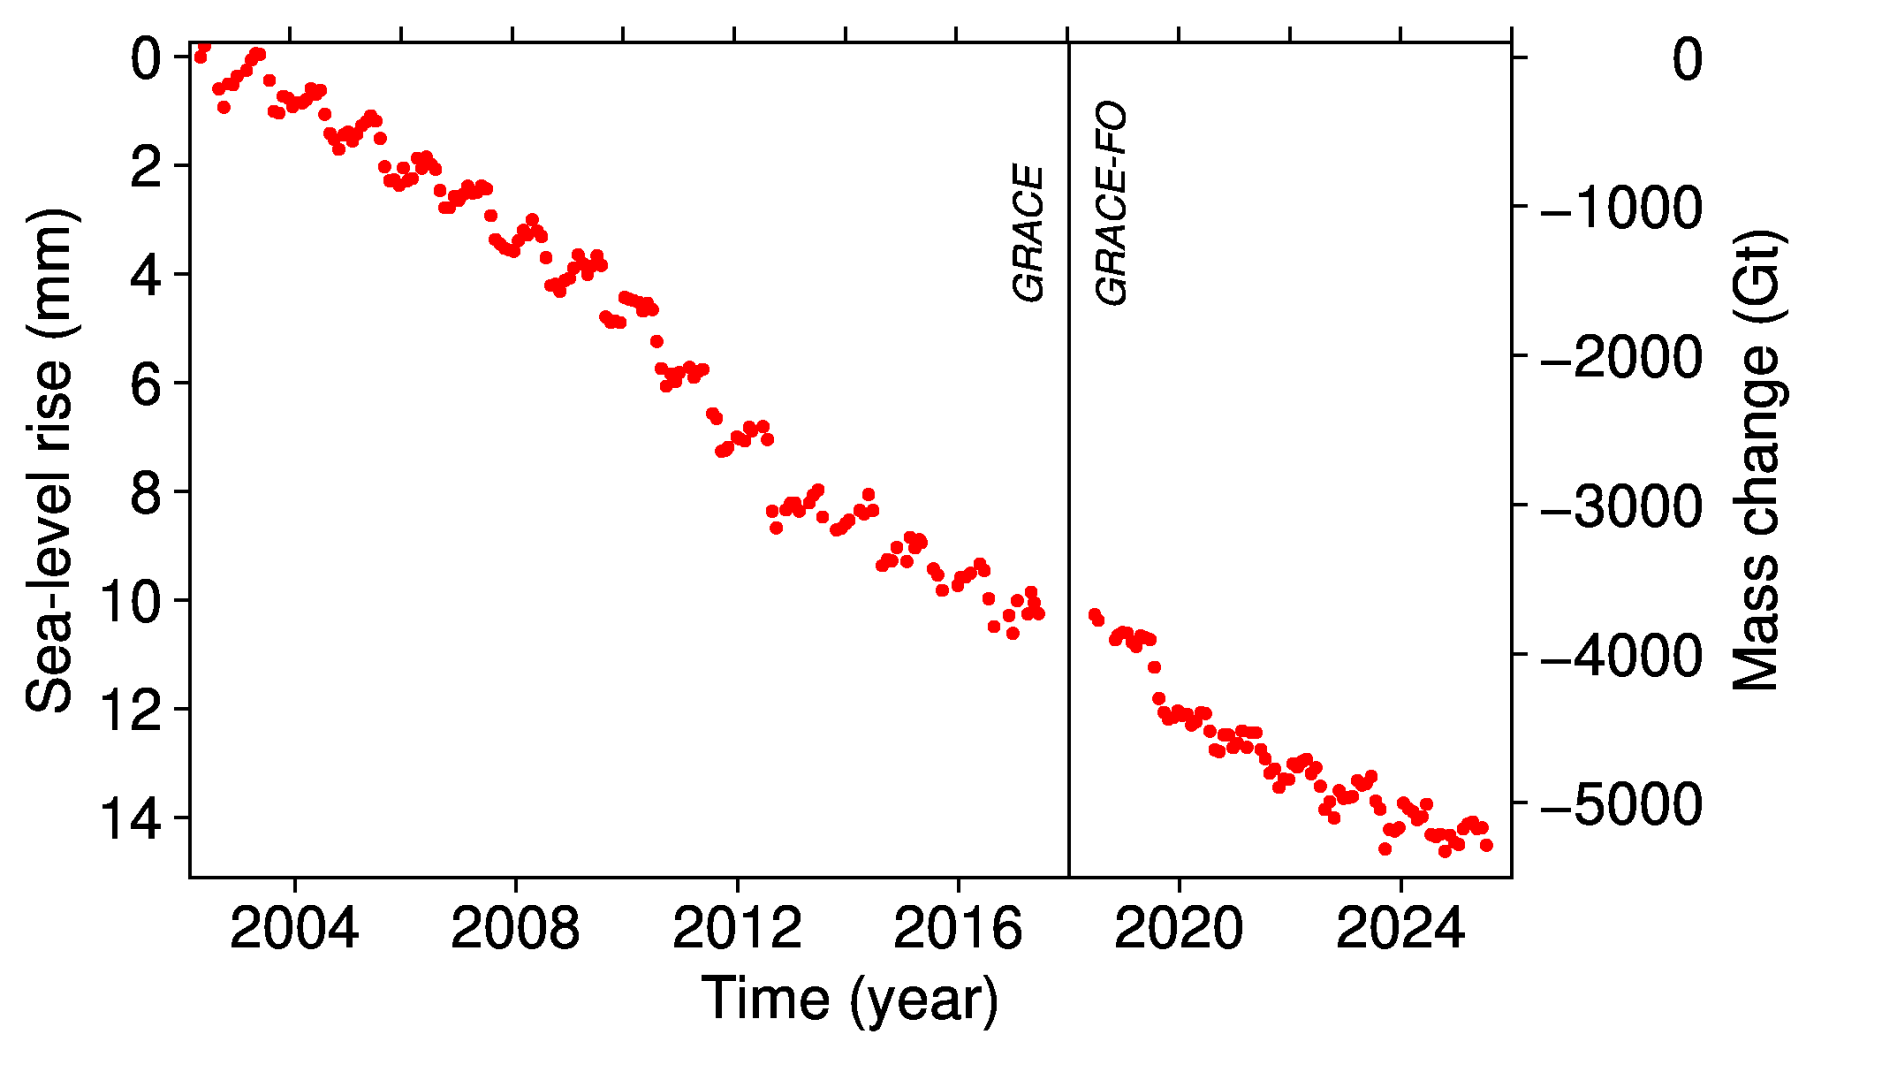
In the 22-year period between April 2002 and May 2024, the Grace data shows that Greenland lost 4,911bn tonnes of ice. The modelling approach, on the other hand, calculates that 4,766bn tonnes of ice was lost.
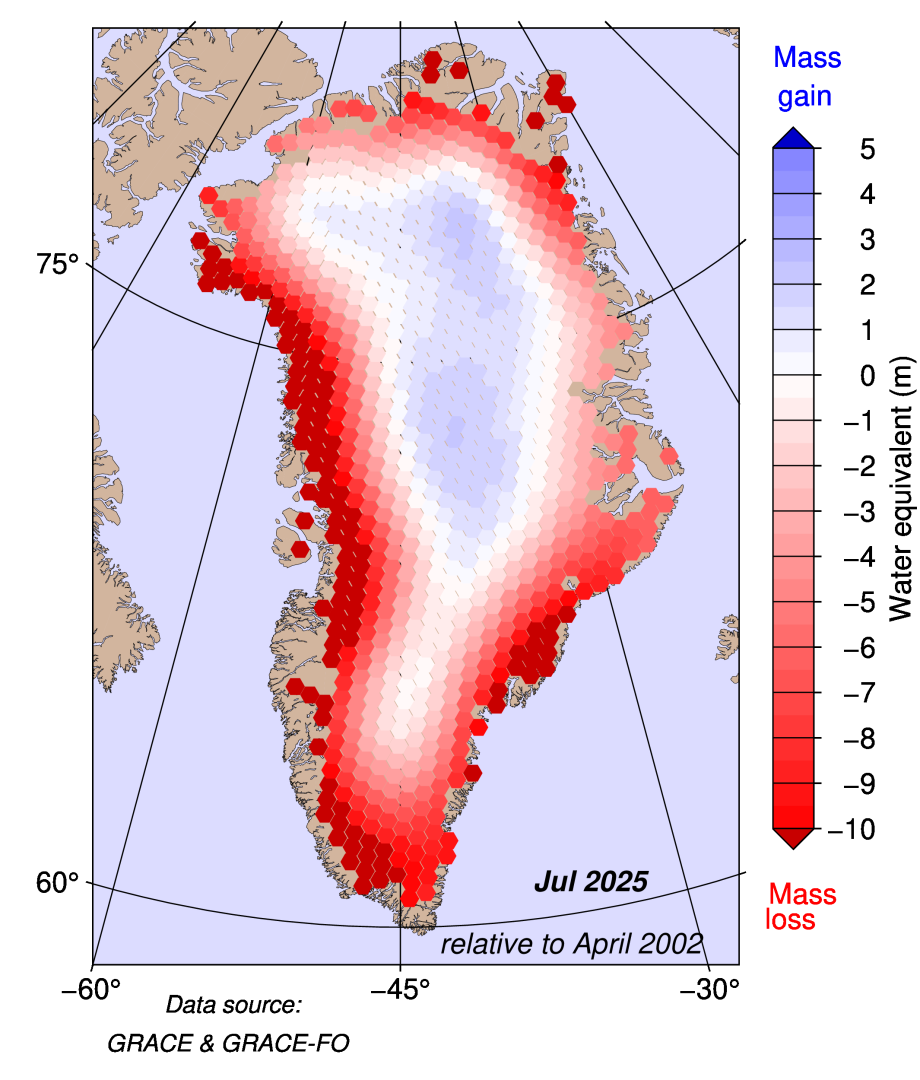
The figure below shows gain and loss in the total mass of ice of the Greenland ice sheet, calculated using Grace satellite measurements. It reveals that, over the past 23 years, there has been mass loss in the order of several metres along the coasts of Greenland, with the most significant losses seen on the western coast. Over the central parts of the ice sheet, there has been a small mass gain.
The lower figure shows the contribution of Greenland mass change to sea level rise over the last 23 years, according to the satellite data. It illustrates that more than 5,000bn tonnes of ice have been lost over the time period – contributing to roughly 1.5cm of sea level rise.
Warm over Europe and North America, cool over Greenland
As always, the weather systems across the northern hemisphere play a key role in the melt and snowfall that Greenland sees each year.
As in previous years, multiple heatwaves were observed in southern Europe and North America over the summer of 2025.
And, just like in 2024, there was only modest heat in northern Europe – with the notable exception of Arctic Scandinavia – with a comparably cool and rainy July followed by a warmer and sunnier August.
The high-pressure weather systems that bring heatwaves have a wide-ranging impact on weather extremes across the northern hemisphere.
Strong blocking patterns over North America and Europe were repeatedly present in the course of the summer of 2025. In such a blocked flow, the jet stream – fast-moving winds that blow from west to east high in the atmosphere – is shaped like the Greek capital letter Omega (Ω).
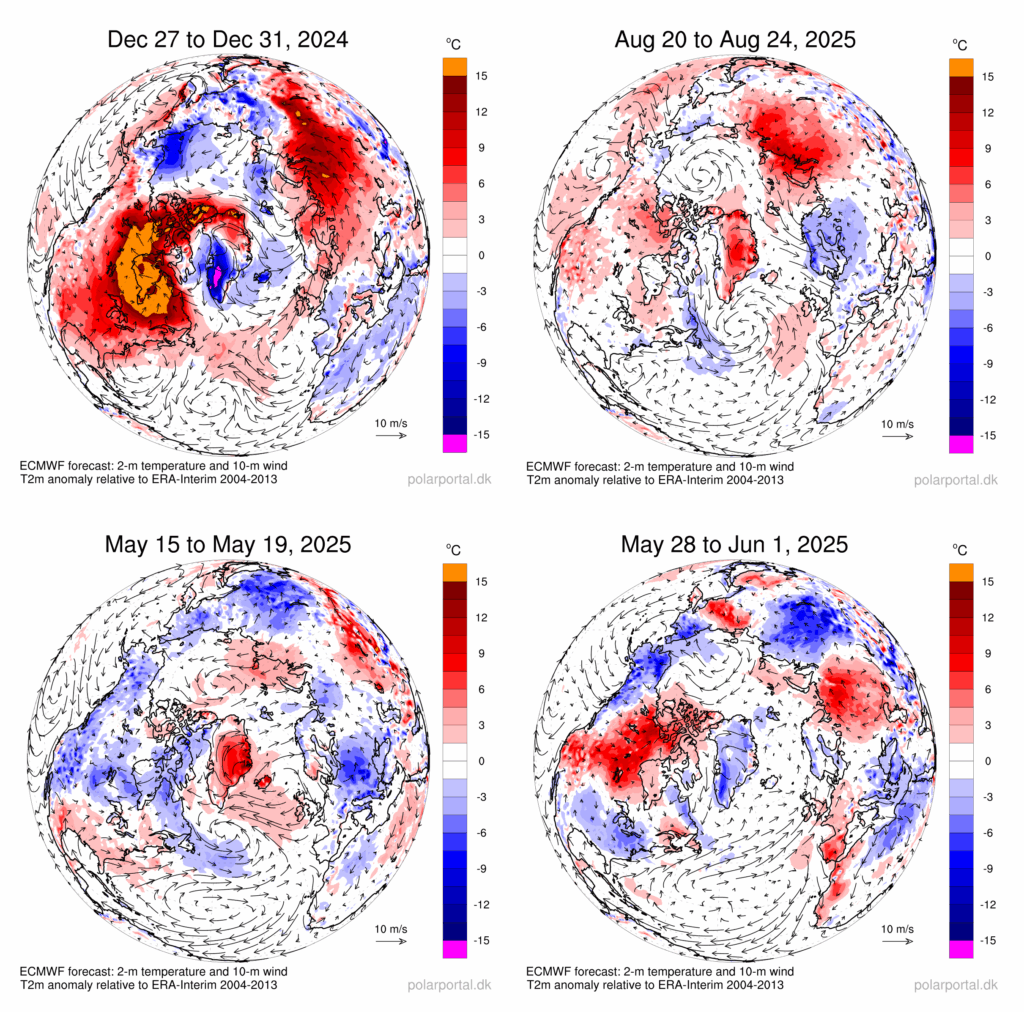
The jet stream bulged up to the north over Canada and northern Europe. West and east of these ridges, low pressure troughs were found at both “feet” of the Omega. One of these troughs was located over Greenland (top left panel in next figure).
This resulted in widespread heat near the cores of these high-pressure systems, fuelling fires in several countries, including large wildfires in Canada. Smoke from these wildfires reached Greenland and Europe in late May.
Unlike in previous years, no heavy precipitation events were observed near the “feet” of the Omega.
If the Omega pattern is displaced by half a wavelength, the opposite – warm over Greenland, with cool continents – is also possible.
This circulation pattern occurred in August 2025 and is shown in the top right panel of the figure below. The bottom panel depicts the large temperature variability in May 2025.



The post Guest post: How the Greenland ice sheet fared in 2025 appeared first on Carbon Brief.

Drought and heatwaves occurring together – known as “compound” events – have “surged” across the world since the early 2000s, a new study shows.
Compound drought and heat events (CDHEs) can have devastating effects, creating the ideal conditions for intense wildfires, such as Australia’s “Black Summer” of 2019-20 where bushfires burned 24m hectares and killed 33 people.
The research, published in Science Advances, finds that the increase in CDHEs is predominantly being driven by events that start with a heatwave.
The global area affected by such “heatwave-led” compound events has more than doubled between 1980-2001 and 2002-23, the study says.
The rapid increase in these events over the last 23 years cannot be explained solely by global warming, the authors note.
Since the late 1990s, feedbacks between the land and the atmosphere have become stronger, making heatwaves more likely to trigger drought conditions, they explain.
One of the study authors tells Carbon Brief that societies must pay greater attention to compound events, which can “cause severe impacts on ecosystems, agriculture and society”.
Compound events
CDHEs are extreme weather events where drought and heatwave conditions occur simultaneously – or shortly after each other – in the same region.
These events are often triggered by large-scale weather patterns, such as “blocking” highs, which can produce “prolonged” hot and dry conditions, according to the study.
Prof Sang-Wook Yeh is one of the study authors and a professor at the Ewha Womans University in South Korea. He tells Carbon Brief:
“When heatwaves and droughts occur together, the two hazards reinforce each other through land-atmosphere interactions. This amplifies surface heating and soil moisture deficits, making compound events more intense and damaging than single hazards.”
CDHEs can begin with either a heatwave or a drought.
The sequence of these extremes is important, the study says, as they have different drivers and impacts.
For example, in a CDHE where the heatwave was the precursor, increased direct sunshine causes more moisture loss from soils and plants, leading to a drought.
Conversely, in an event where the drought was the precursor, the lack of soil moisture means that less of the sun’s energy goes into evaporation and more goes into warming the Earth’s surface. This produces favourable conditions for heatwaves.
The study shows that the majority of CDHEs globally start out as a drought.
In recent years, there has been increasing focus on these events due to the devastating impact they have on agriculture, ecosystems and public health.
In Russia in the summer of 2010, a compound drought-heatwave event – and the associated wildfires – caused the death of nearly 55,000 people, the study notes.

The record-breaking Pacific north-west “heat dome” in 2021 triggered extreme drought conditions that caused “significant declines” in wheat yields, as well as in barley, canola and fruit production in British Columbia and Alberta, Canada, says the study.
Increasing events
To assess how CDHEs are changing, the researchers use daily reanalysis data to identify droughts and heatwaves events. (Reanalysis data combines past observations with climate models to create a historical climate record.) Then, using an algorithm, they analyse how these events overlap in both time and space.
The study covers the period from 1980 to 2023 and the world’s land surface, excluding polar regions where CDHEs are rare.
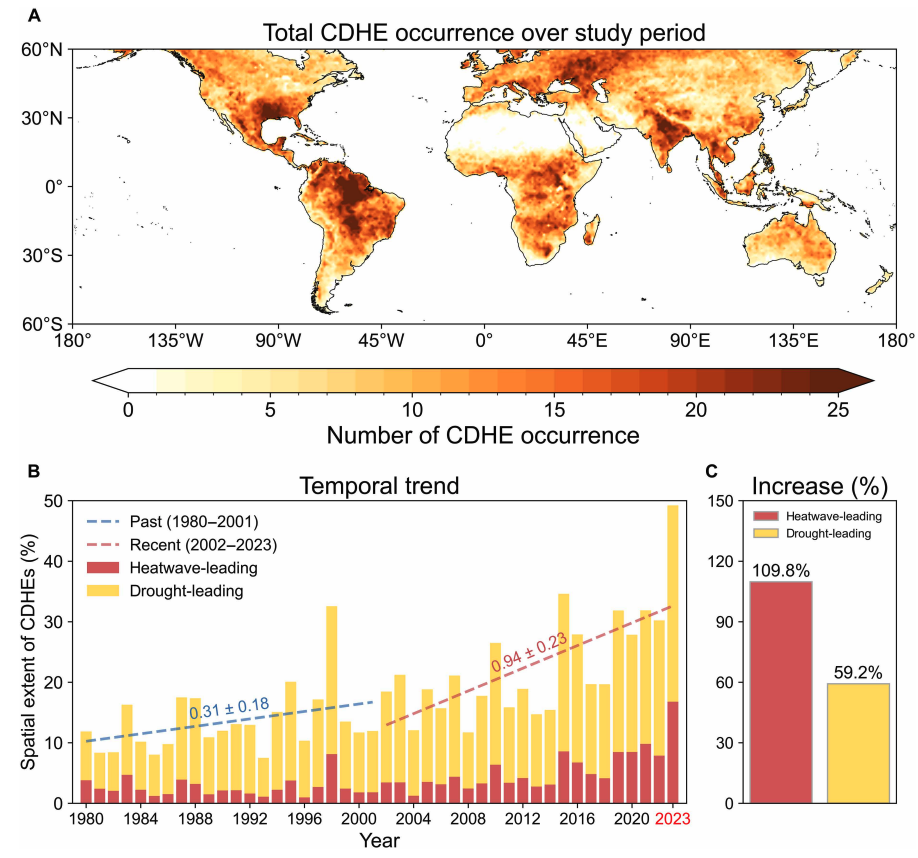
The research finds that the area of land affected by CDHEs has “increased substantially” since the early 2000s.
Heatwave-led events have been the main contributor to this increase, the study says, with their spatial extent rising 110% between 1980-2001 and 2002-23, compared to a 59% increase for drought-led events.
The map below shows the global distribution of CDHEs over 1980-2023. The charts show the percentage of the land surface affected by a heatwave-led CDHE (red) or a drought-led CDHE (yellow) in a given year (left) and relative increase in each CDHE type (right).
The study finds that CDHEs have occurred most frequently in northern South America, the southern US, eastern Europe, central Africa and south Asia.
Threshold passed
The authors explain that the increase in heatwave-led CDHEs is related to rising global temperatures, but that this does not tell the whole story.
In the earlier 22-year period of 1980-2001, the study finds that the spatial extent of heatwave-led CDHEs rises by 1.6% per 1C of global temperature rise. For the more-recent period of 2022-23, this increases “nearly eightfold” to 13.1%.
The change suggests that the rapid increase in the heatwave-led CDHEs occurred after the global average temperature “surpasse[d] a certain temperature threshold”, the paper says.
This threshold is an absolute global average temperature of 14.3C, the authors estimate (based on an 11-year average), which the world passed around the year 2000.
Investigating the recent surge in heatwave-leading CDHEs further, the researchers find a “regime shift” in land-atmosphere dynamics “toward a persistently intensified state after the late 1990s”.
In other words, the way that drier soils drive higher surface temperatures, and vice versa, is becoming stronger, resulting in more heatwave-led compound events.
Daily data
The research has some advantages over other previous studies, Yeh says. For instance, the new work uses daily estimations of CDHEs, compared to monthly data used in past research. This is “important for capturing the detailed occurrence” of these events, says Yeh.
He adds that another advantage of their study is that it distinguishes the sequence of droughts and heatwaves, which allows them to “better understand the differences” in the characteristics of CDHEs.
Dr Meryem Tanarhte is a climate scientist at the University Hassan II in Morocco, and Dr Ruth Cerezo Mota is a climatologist and a researcher at the National Autonomous University of Mexico. Both scientists, who were not involved in the study, agree that the daily estimations give a clearer picture of how CDHEs are changing.
Cerezo-Mota adds that another major contribution of the study is its global focus. She tells Carbon Brief that in some regions, such as Mexico and Africa, there is a lack of studies on CDHEs:
“Not because the events do not occur, but perhaps because [these regions] do not have all the data or the expertise to do so.”
However, she notes that the reanalysis data used by the study does have limitations with how it represents rainfall in some parts of the world.
Compound impacts
The study notes that if CDHEs continue to intensify – particularly events where heatwaves are the precursors – they could drive declining crop productivity, increased wildfire frequency and severe public health crises.
These impacts could be “much more rapid and severe as global warming continues”, Yeh tells Carbon Brief.
Tanarhte notes that these events can be forecasted up to 10 days ahead in many regions. Furthermore, she says, the strongest impacts can be prevented “through preparedness and adaptation”, including through “water management for agriculture, heatwave mitigation measures and wildfire mitigation”.
The study recommends reassessing current risk management strategies for these compound events. It also suggests incorporating the sequences of drought and heatwaves into compound event analysis frameworks “to enhance climate risk management”.
Cerezo-Mota says that it is clear that the world needs to be prepared for the increased occurrence of these events. She tells Carbon Brief:
“These [risk assessments and strategies] need to be carried out at the local level to understand the complexities of each region.”




The post Heatwaves driving recent ‘surge’ in compound drought and heat extremes appeared first on Carbon Brief.
Heatwaves driving recent ‘surge’ in compound drought and heat extremes
Greenhouse Gases
DeBriefed 6 March 2026: Iran energy crisis | China climate plan | Bristol’s ‘pioneering’ wind turbine
Welcome to Carbon Brief’s DeBriefed.
An essential guide to the week’s key developments relating to climate change.
This week
Energy crisis
ENERGY SPIKE: US-Israeli attacks on Iran and subsequent counterattacks across the Middle East have sent energy prices “soaring”, acc