

The UK’s solar farms and rooftops generated more electricity than ever before in the first five months of 2025, as the country enjoyed its sunniest spring on record.
The figures, revealed in new Carbon Brief analysis, show that the nation’s solar sites have generated a record 7.6 terawatt hours (TWh) of electricity during January to May 2025.
This is some 42% higher than the 5.4TWh generated in the same period last year, as well as marking a much larger 260% increase in the past decade.
Solar hit a new half-hourly record of 13.2 gigawatts (GW) on 6 April and, for the first time, accounted for more than 10% of monthly electricity generation in two consecutive months (April and May).
The solar electricity generated in 2025 to date has avoided the need to import gas costing around £600m, which would have released 6m tonnes of carbon dioxide (MtCO2) when burned.
However, solar was still only the UK’s sixth-largest source of electricity in 2025 to date, after gas (37TWh), wind (33TWh), imports (18TWh), nuclear (15TWh) and biomass (8.0TWh).
Although this year’s solar high was partly driven by the record sunniest spring, it was also aided by rising capacity, which reached 20.2GW in 2024, up by 2.3GW from 17.9GW a year earlier.
Solar capacity is set to reach at least 45GW by 2030 as part of the government’s ambition to decarbonise the power sector and become a “clean-energy superpower”.
(This article refers to the UK throughout, but the electricity generation data only covers the island of Great Britain. Northern Ireland is part of the all-Ireland electricity system.)
Solar record
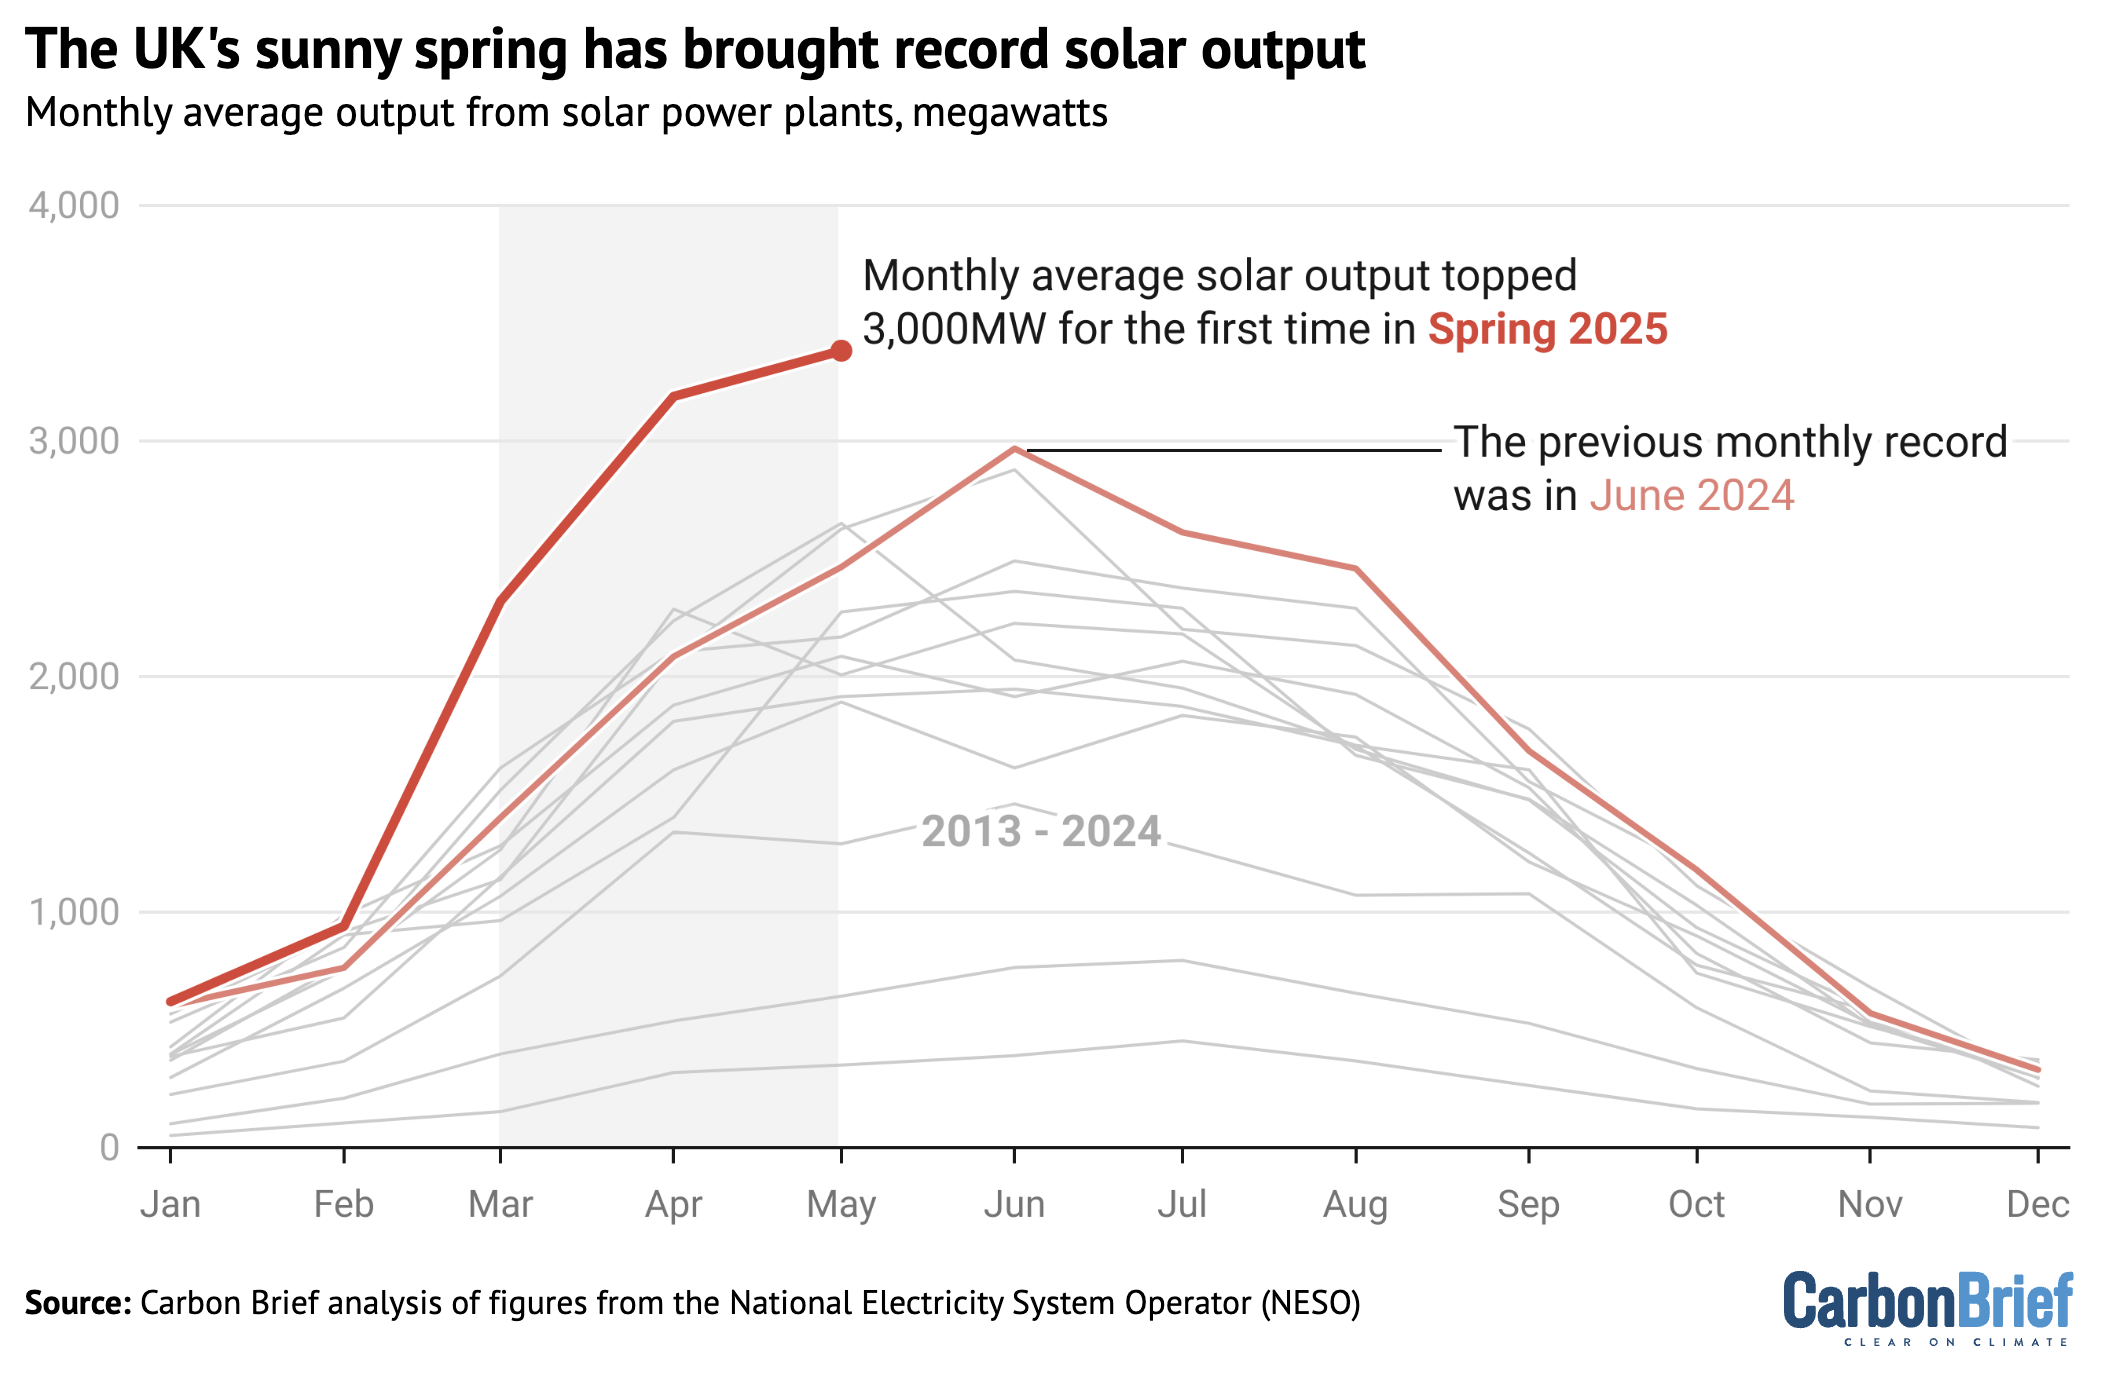
The leap in solar output in 2025 saw generation reaching a record 7.6TWh in the first five months of the year, up 42% year-on-year.
Electricity output from UK solar installations saw particularly big jumps in March – where the 2,320 megawatts (MW) average was up 66% from a year earlier – and in April (3,189MW, up 53%).
There was a more modest 37% year-on-year increase in May 2025 – the country’s second-sunniest May on record – with average output reaching a new monthly high of 3,383MW.
The amount of electricity generated from solar also hit a new high of 2.5TWh in May 2025, beating April 2025’s 2.3TWh into second place. The previous record of 2.1TWh was set in June 2024.
The figure below shows the average monthly output of the UK’s solar capacity, in MW. Output dips in the short, dark days of winter and generally peaks with the longer daylight hours in June.
(The differences between installed electricity generating capacity, actual power output at any given moment and the amount of electricity generated per hour/day/month/year can cause confusion. The UK’s installed solar capacity reached 20GW at the end of last year. This is the maximum amount of power that could theoretically be produced at one time. In practice, the maximum power output recorded to date is 13GW and the average across a full month reached just over 3GW in May, generating 2.5TWh of electricity.)
The electricity generated by the UK’s solar panels in the first five months of 2025 – at 7.5TWh – is enough to have offset the need for around 16TWh of imported gas.
Buying this gas would have cost around £600m – based on recent average wholesale prices – and burning it would have resulted in roughly 6MtCO2, adding nearly 2% to total UK emissions.
The 16TWh of avoided gas imports is equivalent to 10% of the UK’s net gas imports in the same period last year – or around 10 individual Q-Max liquified natural gas (LNG) tankers, the largest currently available.
(For comparison, the UK only took 24 LNG deliveries during April to September 2024, according to data provider Argus. Figures for the first five months of last year are not available.)
The total amount of electricity generated by solar determines how many deliveries of imported gas can be avoided each month, as well as how far the power sector can cut its emissions.
In total, solar accounted for 11.6% of UK electricity generation in May 2025, only the fourth time it has ever breached the 10% threshold, after June 2023, June 2024 and April 2025.
(Solar topped 10% of monthly global electricity generation for the first time in April this year.)
However, the impact on the electricity market depends more closely on the hour-to-hour and day-to-day variations in solar generation due to the weather, seasons and diurnal cycles.
The highest UK solar output on record was reached at 13:00 on 6 April, when the technology was delivering 13.2GW of power and meeting 40% of demand for that half-hour period.
Sunniest spring
The UK saw 653 hours of sunshine in the period from 1 March to 31 May 2025, making it the sunniest spring since records began in 1910, according to the Met Office.
This total is 43% higher than the average for 1961-90. Before this year, the previous record for the sunniest spring had been set in 2020, when there were 626 sunshine hours.
UK sunshine hours have been on an increasing trend, particularly since the 1980s, according to Met Office analysis for Carbon Brief and illustrated in the chart below, which does not cover 2025.
The analysis found that, on average, spring months had been around 15% sunnier over the past decade than during the reference period from 1961-90.
(The analysis put this trend down to a combination of natural variability, changing circulation patterns and possible human influence from shifts in aerosol pollution.)
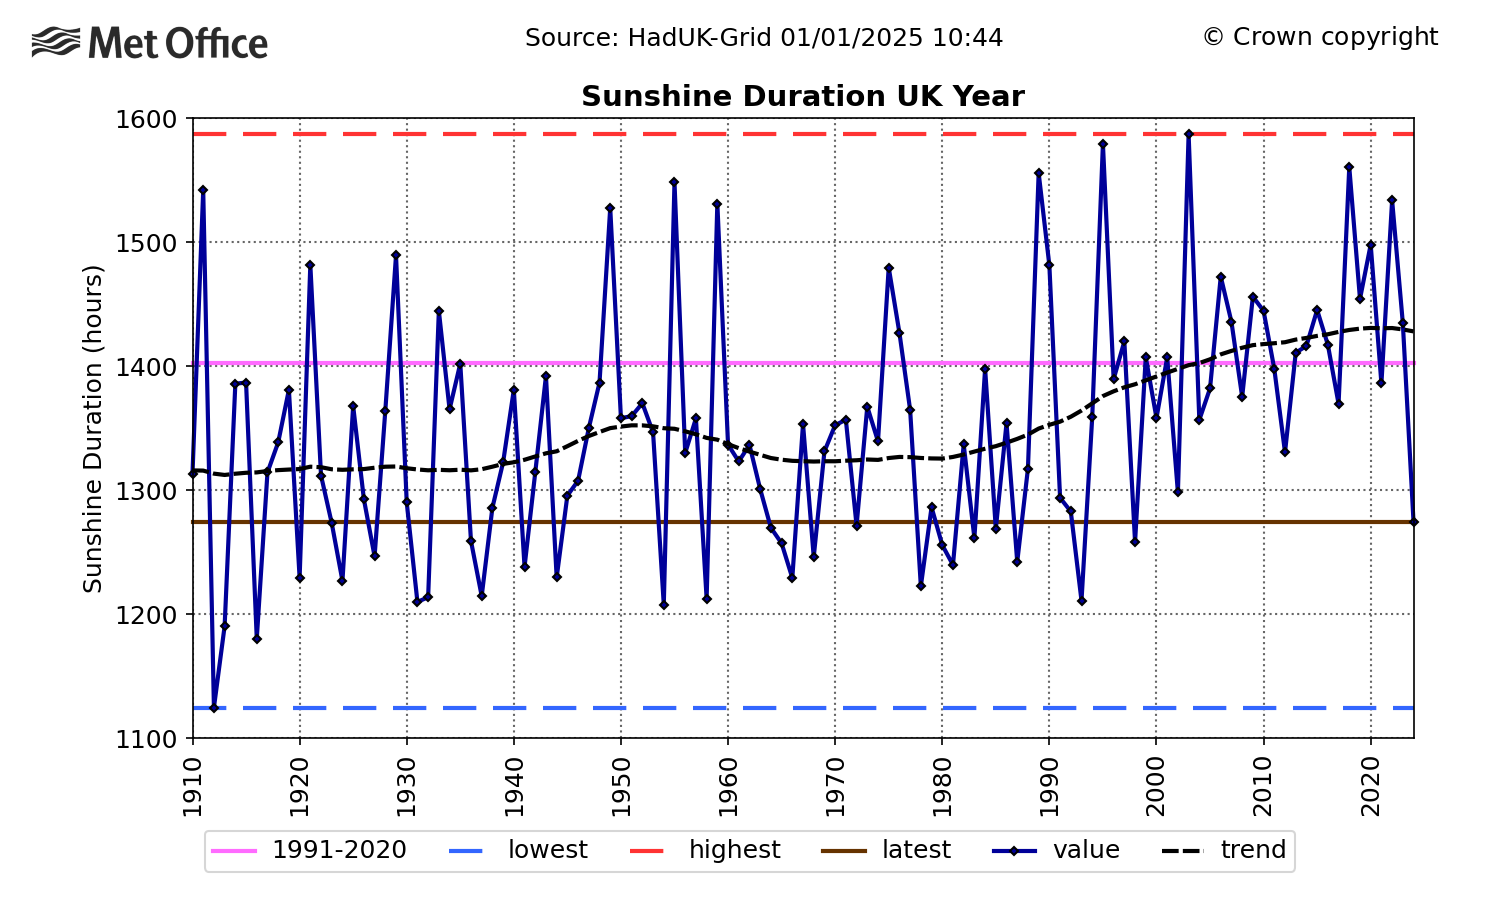
In a statement announcing the sunniest spring, Met Office scientist Emily Carlisle said: “Seven of the top ten sunniest springs on record for the UK since 1910 have occurred since the year 2000.”
A further Met Office release notes that spring 2025 is not only the sunniest spring on record, but also the fourth-sunniest season overall, with only three summers having had more sunshine.
The extra sunshine this spring contributed to unusually high solar power output per unit of installed capacity, a metric known as the “capacity factor” of the UK’s solar plants.
The capacity factor is a percentage, showing the actual electricity generation relative to the maximum theoretical output, if the panels were working at full capacity all of the time.
Clean power
While sunny weather helped drive the new highs for solar this spring, the UK’s growing capacity also contributed to the records.
After stagnating at around 12-14GW for several years after the then-Conservative government’s decision to end subsidies for solar in 2015, the UK’s installed capacity has since leapt to 20.2GW as of the end of 2024.
Capacity has grown as prices have fallen – boosting the economic case for solar – and as projects with newer “contracts for difference” have started to get built.
Early 2025 has seen the strongest start to the year since 2012 in terms of new rooftop solar capacity. Moreover, the UK is expected to add 3-3.5GW of new solar capacity across 2025 as a whole, according to Solar Media Market Research, up from the 2.3GW added in 2024.
Since taking office last July, energy secretary Ed Miliband has approved around 3GW of new solar capacity at giant sites, including the 500MW Heckington Fen and 500MW Gate Burton schemes.
The government is targeting 45-47GW of solar by 2030 as part of its “mission” to become a “clean-energy superpower”, which aims to have low-carbon sources meeting 100% of UK electricity demand and at least 95% of generation in the country.
Before then, the National Energy System Operator (NESO) is aiming to run the electricity system without fossil fuels for a short period, at some point this year.
Since setting itself this target in 2019, NESO has been making preparations by contracting for zero-carbon sources of grid stability services. These include “inertia” and voltage control, which have traditionally only been offered by conventional fossil-fuel generators.
Only familiar to grid engineers, previously, these terms have recently seen widespread usage in media coverage and finger-pointing over April’s blackouts in Spain and Portugal.
The increase in electricity generation from variable sources, such as wind and solar, brings new technical and market-related challenges, including increasing periods of “negative pricing”.
However, the solutions to these challenges are well-known and already being implemented in the UK. These include the buildout of battery storage systems, increasing interconnector capacity linking the national grid to other countries and new sources of grid stability, such as flywheels.


The post Analysis: UK’s solar power surges 42% after sunniest spring on record appeared first on Carbon Brief.
Analysis: UK’s solar power surges 42% after sunniest spring on record

Next week, diplomats from around the world will descend on Yerevan, Armenia, to negotiate a series of decisions under the UN Convention on Biological Diversity (CBD).
Between 19 and 30 October, 196 parties will gather to hammer out the precise wording of the dozens of legal texts that make up the decisions under the Conference of the Parties (COP) to the CBD.
This year’s summit is particularly significant, as it marks the halfway point between the agreement of the Kunming-Montreal Global Biodiversity Framework and the deadline for achieving its targets.
The CBD has found that countries are currently not on track to meet 22 out of the framework’s 23 targets.
During the fortnight, delegates will also be negotiating decisions relating to the two supplemental protocols to the CBD: the Cartagena Protocol, which covers biosafety; and the Nagoya Protocol, which covers access and benefit-sharing for the use of genetic resources.
(The Cartagena and Nagoya Protocols, which are each governed by a “meeting of the parties”, or “MOP”, have fewer parties than the CBD as a whole, with 173 and 141, respectively.)
Carbon Brief is tracking the progress of countries towards consensus on dozens of negotiating texts using the interactive table below.
The tracker includes texts from the COP, as well as the MOPs for the Cartagena and Nagoya protocols. It also includes draft decisions from the most recent subsidiary body meetings, as these form the starting point for the negotiations in Yerevan.
The CBD has three subsidiary bodies: the subsidiary body on scientific, technical and technological advice (SBSTTA), the subsidiary body on implementation (SBI) and the subsidiary body on article 8(j) and other provisions (SB8J).
SB8J focuses on issues related to the Indigenous peoples and local communities. It was established at COP16 in Cali, Colombia, in 2024.
The first two columns of the interactive tracker list the topic of each agenda item and the relevant body, with subsequent columns including dates, page counts and links to the original documents.
The table is searchable and can be sorted using the arrows in the header.
Areas of disagreement in UN draft texts are denoted by square brackets. Counting the brackets in a particular iteration of a text therefore gives a sense of how far parties are from reaching consensus.
The bracket column is colour-coded, with dark green indicating a low number of brackets and red indicating a high number of brackets remaining.
Texts can also present parties with choices using “options” or alternatives (“alt”), which are counted together in the sixth column of the table.
The key discussions in Yerevan will centre around two agenda items in particular. The first is the global review, which will assess progress towards the GBF and make recommendations for accelerating action.
The second is finance, which can be separated into two parts: resource mobilisation and the financial mechanism. On resource mobilisation, biodiverse global south countries are likely to push for an increased amount of international finance for conservation.
Disagreement over the creation of the financial mechanism led to the suspension of COP16 in Cali in October 2024, as parties failed to find agreement on the mobilisation of finance before the end of the summit.
Global south countries want the establishment of a separate financial mechanism under the control of the CBD; global north countries largely prefer to maintain the existing mechanism, which sits under the Global Environment Facility.
At the resumed session of COP16 in Rome in early 2025, countries agreed on a roadmap that would lead to the establishment of a permanent mechanism.
related

Analysis: Lula presidency saved at least 20,000km2 of Brazilian Amazon since 2022
Why land-use emissions have fallen by a third this century – in six charts

Analysis: 84% of nations miss deadline to identify ‘nature-harming’ subsidies by 2025

UK withdraws millions in funding from world’s second-largest rainforest in Congo
The post Interactive: Tracking negotiating texts at the COP17 biodiversity summit appeared first on Carbon Brief.
Interactive: Tracking negotiating texts at the COP17 biodiversity summit
A beacon of love
On an outer island of Fiji, two thousand nautical miles from Sydney, is a shining light of hope and resilience for our troubled world.
The island of Kioa is home to a Tuvaluan community who migrated from their atoll of Vaitupu in the late 1940s. It is a land of warm hearts, big smiles, and deep cultural roots; a place where the sound of a conch still summons the island together, where islanders paddle out to fish in carved outrigger canoes, and healthy happy children walk barefoot to school.
Here, culture is life. Kioans live sustainably through their traditional knowledge and practices. The island is alive with song, dance and the rhythms of a life tied to the tides, the winds, and the seasons.

Facing the future
Greenpeace has been lucky to have a relationship with Kioa for a number of years now, and we are continually learning from this remarkable community.
Last week, as part of our Voyaging Oceania project, we returned to the island. Our purpose was twofold —- to carry messages from the island to leaders gathering in Nadi this week for the Pacific Pre-COP, and to support the Kioa community in their efforts to improve water security for the island.
Unlike Tuvalu itself, with its eight atolls, Kioa is a mountainous, forested and richly fertile island. It will remain habitable far into the future. Kioans did not initially migrate from Vaitupu due to climate change, but the move was prophetic. They now have a lifeboat.
However, even Kioa faces challenges on our rapidly warming planet, in particular when it comes to water. Climate change is shifting once reliable rainfall patterns. On top of this, the island is already feeling the effect of this year’s intensifying El Niño event, which for Fiji means reduced rainfall and prolonged dry spells.
Right now, fresh water has to be carefully rationed, and is only available for a few hours a day. During last week’s visit aboard our campaigning ship Oceania, Greenpeace was privileged to work with the Kioa community on a new solar-powered water distribution project for the island.
Designed and led by the island, the project involves using a solar pump to move water from a reliable source to a storage tank and then using gravity to distribute the water around the village.
It was a lesson in how local knowledge and ingenuity can be the backbone of today’s climate solutions. To build a dam around the source, the local community knew the exact spot where they could gather gravel at low tide to mix with the cement. They took only what was needed, knowing that all resources must be carefully conserved. Kioa has no roads and no machinery, and it was an all-of-island effort to carry the materials up to the project site, including many heavy bags of sand and rock.
Such projects truly bring to life the vision of a resilient, locally-led, fossil fuel free Pacific.