Connect with us

Published

on

The planet is heating up more quickly than ever before.

For decades, greenhouse gas emissions caused by human activity have been building up in the atmosphere and trapping ever-higher levels of heat.

The resulting asymmetry between incoming solar energy and energy radiated back out into space – known as “Earth’s energy imbalance” – provides a direct measure of the extent to which humans are disrupting the Earth’s climate system.

This imbalance is growing and in 2025 its 10-year average reached a record high, indicating that global temperatures could increase at even higher rates in the future.

This is among the headline findings of the latest “indicators of global climate change” (IGCC) report, published in the journal Earth System Science Data, which tracks changes in the climate system on an annual basis.

The report, now in its fourth iteration, has been produced by dozens of scientists from around the world.

Its findings are designed to fill the gap between Intergovernmental Panel on Climate Change (IPCC) science reports, which are published every 5-7 years.

In this article, we unpack the IGCC report, which explores how human activity is driving a growing energy imbalance and why monitoring systems to track global climate are so crucial.

(For more on previous IGCC reports, see Carbon Brief’s coverage in 2023, 2024 and 2025.)

Greenhouse gas emissions remain at an all-time high

Global greenhouse gas emissions are continuing to increase, mostly as a result of the use of fossil fuels. However, deforestation, agriculture and industrial processes also play an important role.

Glossary
CO2 equivalent: Greenhouse gases can be expressed in terms of carbon dioxide equivalent, or CO2e. For a given amount, different greenhouse gases trap different amounts of heat in the atmosphere, a quantity known as… Read More

Over the most recent decade (2015-24), emissions stood at the equivalent of 54.6bn tonnes of carbon dioxide equivalent (GtCO2e) per year. In 2024, the most recent year for which we have complete data, emissions reached 56.8GtCO2e.

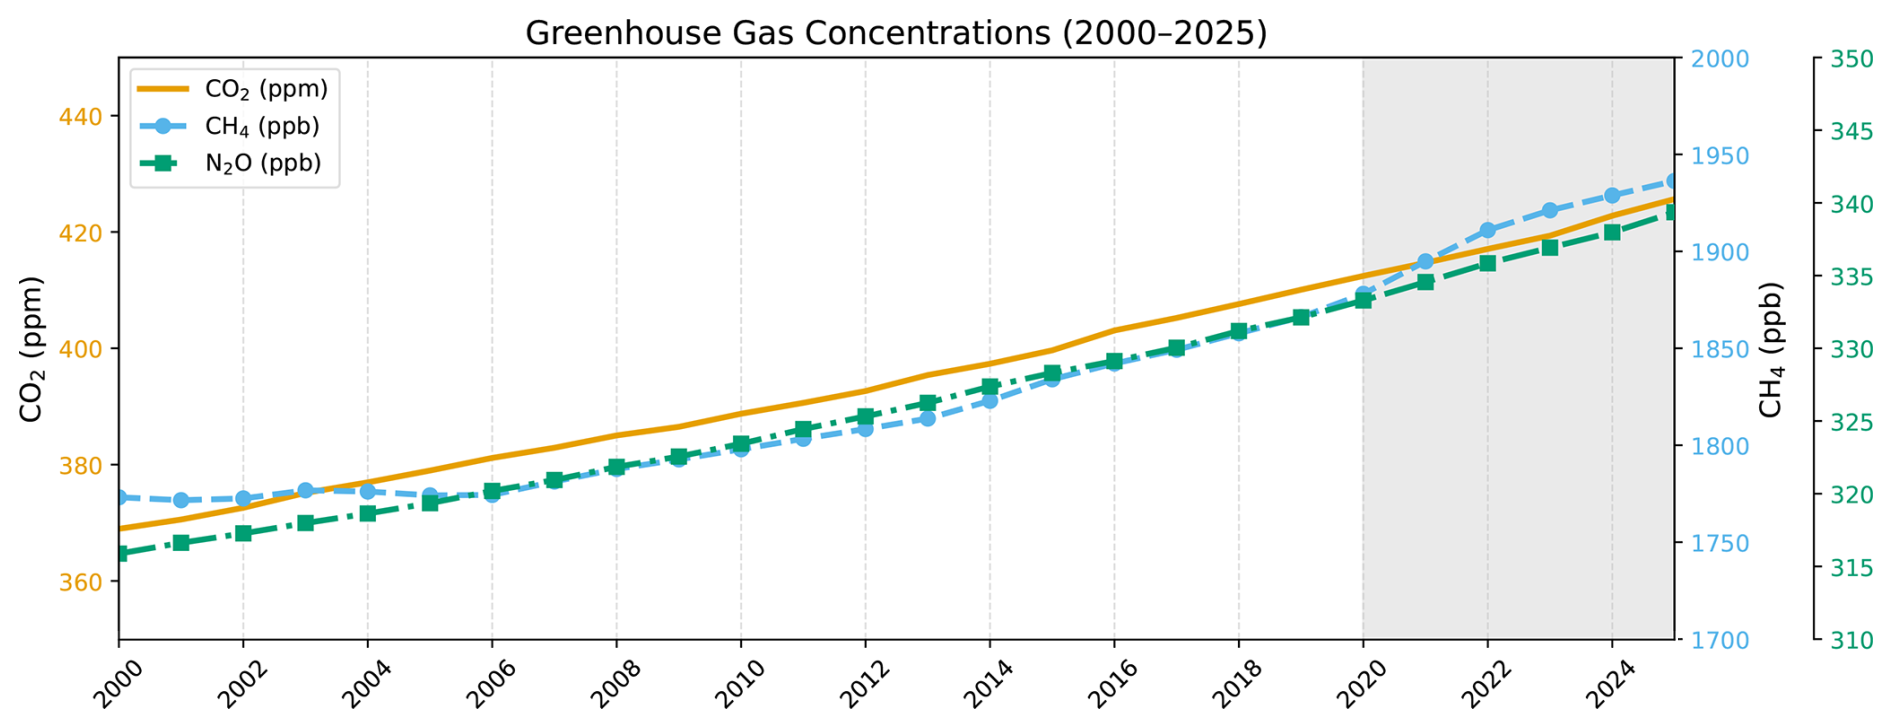
As the chart below shows, these emissions have pushed up atmospheric levels of CO2, methane and nitrous oxide. In 2025, concentrations of these gases reached 425.6 parts per million (ppm), 1936.3 parts per billion (ppb) and 339.4ppb, respectively.

This represents a rise of 3.8%, 3.8% and 2.2%, respectively, since the 2019 levels reported in the IPCC’s sixth assessment report (AR6).
Atmospheric concentrations of CO2
Atmospheric concentrations of CO2 (yellow), methane (blue) and nitrous oxide (green) over 2000-25. The grey-shaded region represents continuing changes since AR6. Note the different vertical scales for each gas. Credit: Forster et al. (2026)

At the same time, declines in emissions of aerosols such as sulphur dioxide, partly as a result of efforts to tackle air pollution, are increasing the Earth’s energy imbalance. This is because aerosols have a cooling effect on the Earth’s climate, counteracting warming from CO2 and other greenhouse gas emissions.

(Tackling sulphur dioxide, alongside other particulate emissions, remains critical because the immediate health and environmental damage they cause far outweighs their short-term cooling effect on the climate.)

The Earth’s energy imbalance is rising rapidly

The Earth’s energy imbalance has long been recognised as a key indicator of how the climate is being affected by human activities.

However, it is only in the last few decades that scientists have been able to record temperature changes deep enough in the ocean to accurately quantify it.

Earth’s energy imbalance measures how quickly excess heat is accumulating in every part of the Earth system, primarily in the ocean, but also in land, ice and atmosphere.

Through this accumulation of heat, the energy imbalance influences the rate of sea level rise and ice melt across the world, as well as increasing the frequency and intensity of extreme weather events, such as storms, floods and droughts.

Without human influence, the Earth’s energy imbalance would be close to zero.

But, as greenhouse gas emissions have built up in the atmosphere, the imbalance has been growing since the 1970s. Recent increases to Earth’s energy imbalance have outpaced those projections made by climate models — indicating the planet could see more warming than expected in the future.

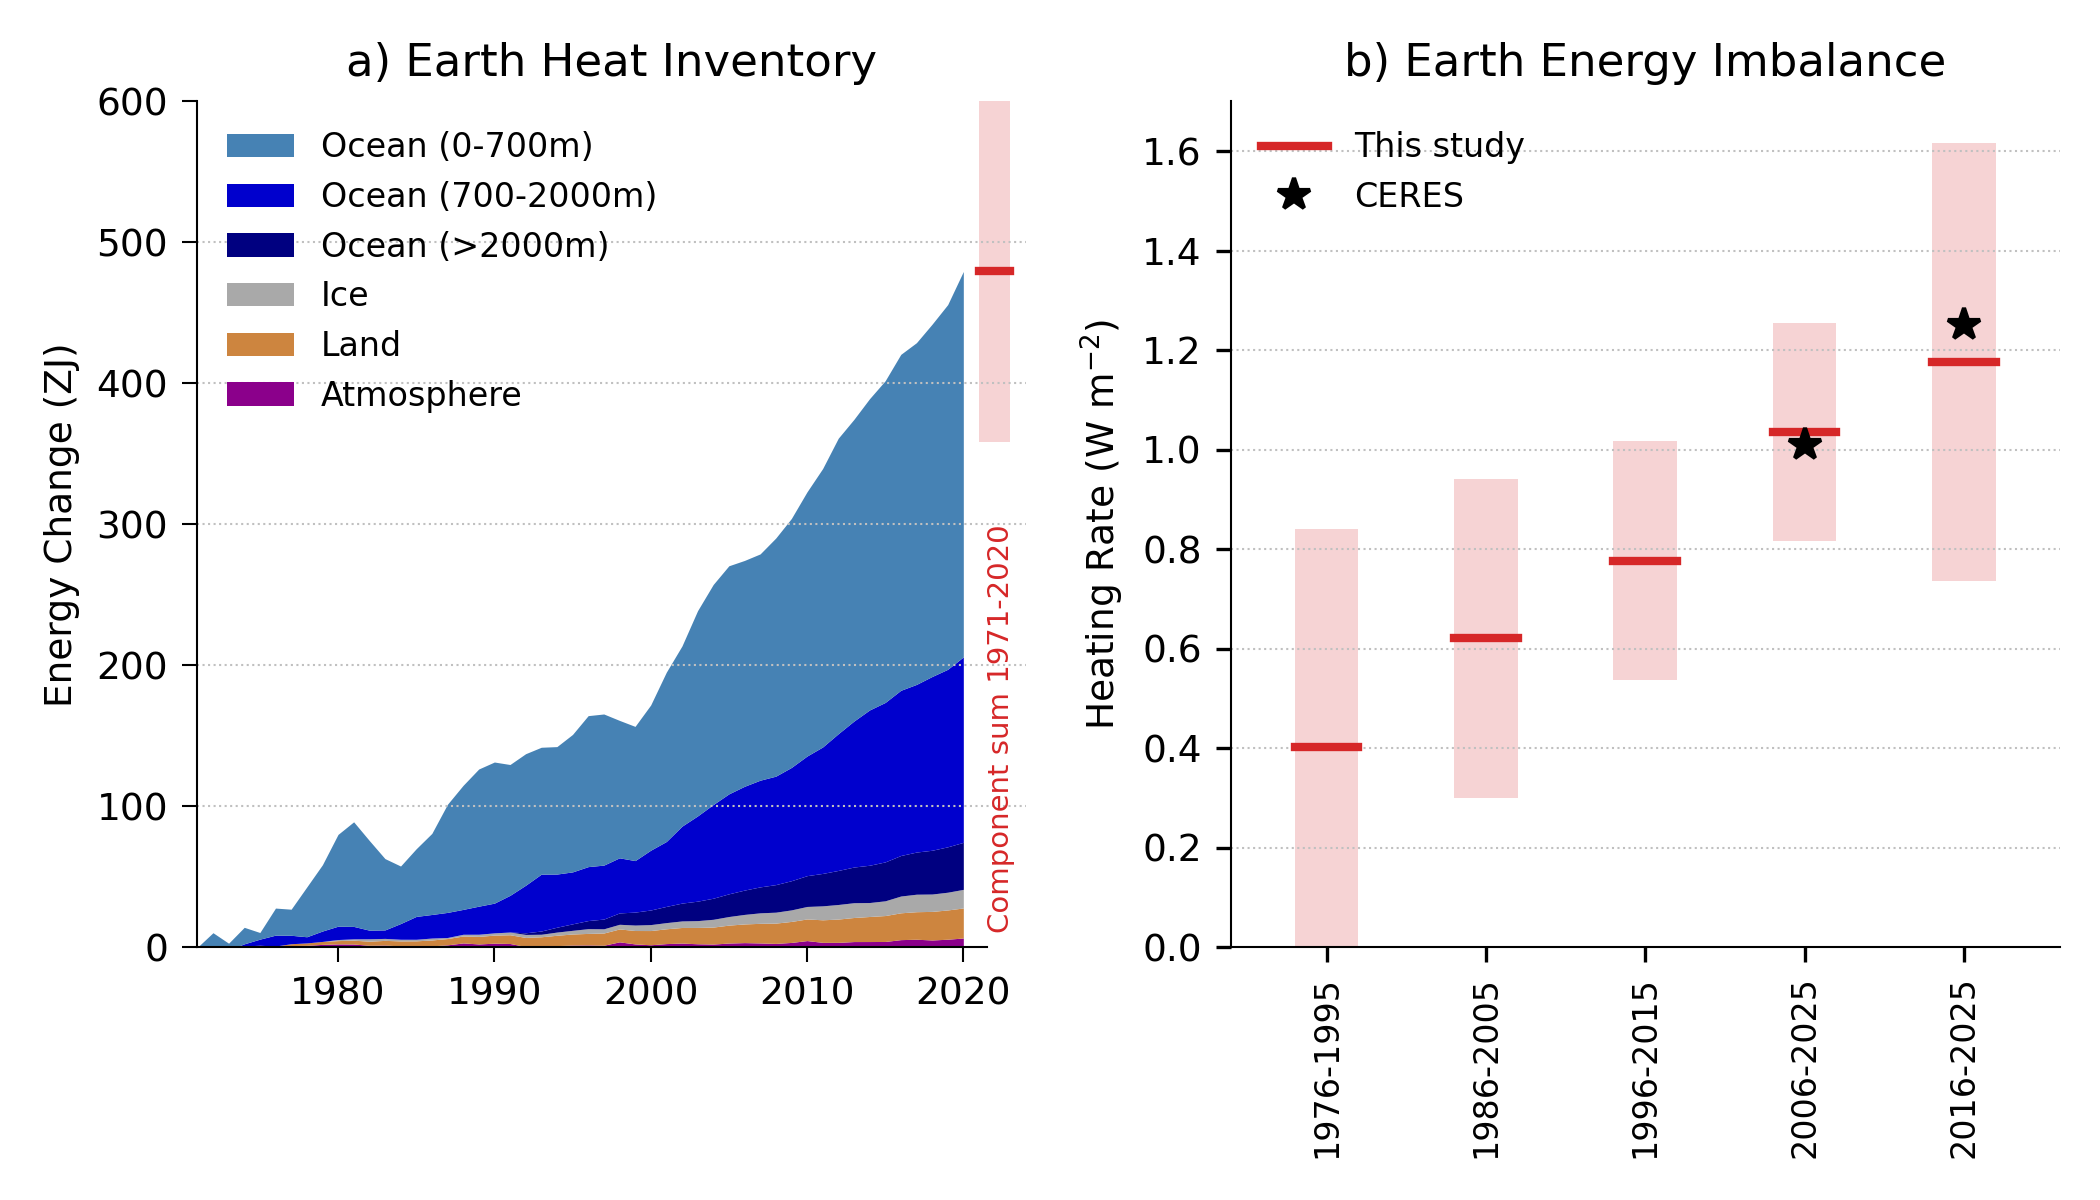
As the right-hand chart below shows, the imbalance is now at a record high, having more than doubled over the past two decades.

It has increased by around 40% since 2019, from an average 0.79 watts per square metre (Wm2) over 2006-18, according to IPCC AR6, to 1.12Wm2 over 2013-25.

The left-hand chart shows how heat is accumulating in the ocean (blues), ice (grey), land (orange) and atmosphere (purple).
 Observed changes in the Earth heat inventory
Left: Observed changes in the Earth heat inventory for the period 1971-2020. Right: Estimates of the Earth energy imbalance for successive overlapping 20-year periods and the most recent decade (right). Shaded regions indicate the very likely range (90-100 % probability), while the stars show the CERES (NASA Clouds and the Earth’s Radiant Energy System) estimates for comparison. Credit: Forster et al. (2026)

Global temperature rise

The excess heat building up in the climate system from the energy imbalance is pushing up global temperatures at a record rate of 0.27C per decade.

We estimate that human-induced warming – the amount of observed global surface

temperature increase attributable to both the direct and indirect effects of human activities – reached 1.37C in 2025. This has risen from 1.0C in 2017, as reported in IPCC AR6.

While natural variability in the climate system – such as El Niño or La Niña events – can also influence temperatures year-to-year, the upward temperature trend we are seeing is being driven by the persistent imbalance in energy.

We now expect global temperatures to exceed the Paris Agreement limit of 1.5C above pre-industrial levels around the year 2030.

This is significant because 1.5C has been identified as the critical dividing line between manageable climate risks and catastrophic, potentially irreversible damage to global ecosystems and human societies.

Heat accumulating throughout the Earth system

While heat is accumulating throughout the Earth system, it is not being distributed evenly around the globe.

Since the 1970s, around 90% of this heat has been taken up by the ocean, affecting marine ecosystems, ocean circulation patterns, sea level rise and climate extremes.

For example, the number of marine heatwave days – periods of unusually high sea surface temperatures – has more than tripled globally since the early 1990s. The year 2025 alone saw 65 days of marine heatwaves – meaning they occurred, on average, more than one day a week.

Meanwhile, the cryosphere – the portion of the Earth made up of frozen water, including glaciers, ice sheets and permafrost – is experiencing widespread ice loss and thawing in response to the growing energy imbalance. This affects ecosystems, sea level rise and infrastructure in polar and high-latitude regions.

Rapid warming has also resulted in record extreme temperatures over land, with average maximum temperatures for any single day over 2016-25 around 1.92C above pre-industrial levels). This is an increase of almost half a degree compared to the previous decade (2006-15).

Sea level rise and the energy imbalance

Sea level rise provides one of the clearest long-term signals of a changing planet.

It is closely linked to Earth’s energy imbalance. As heat accumulates in the ocean, water expands, raising sea levels. Meanwhile, a warming land and atmosphere means addition of water to the oceans through melting of glaciers and ice sheets, also adding to sea level rise.

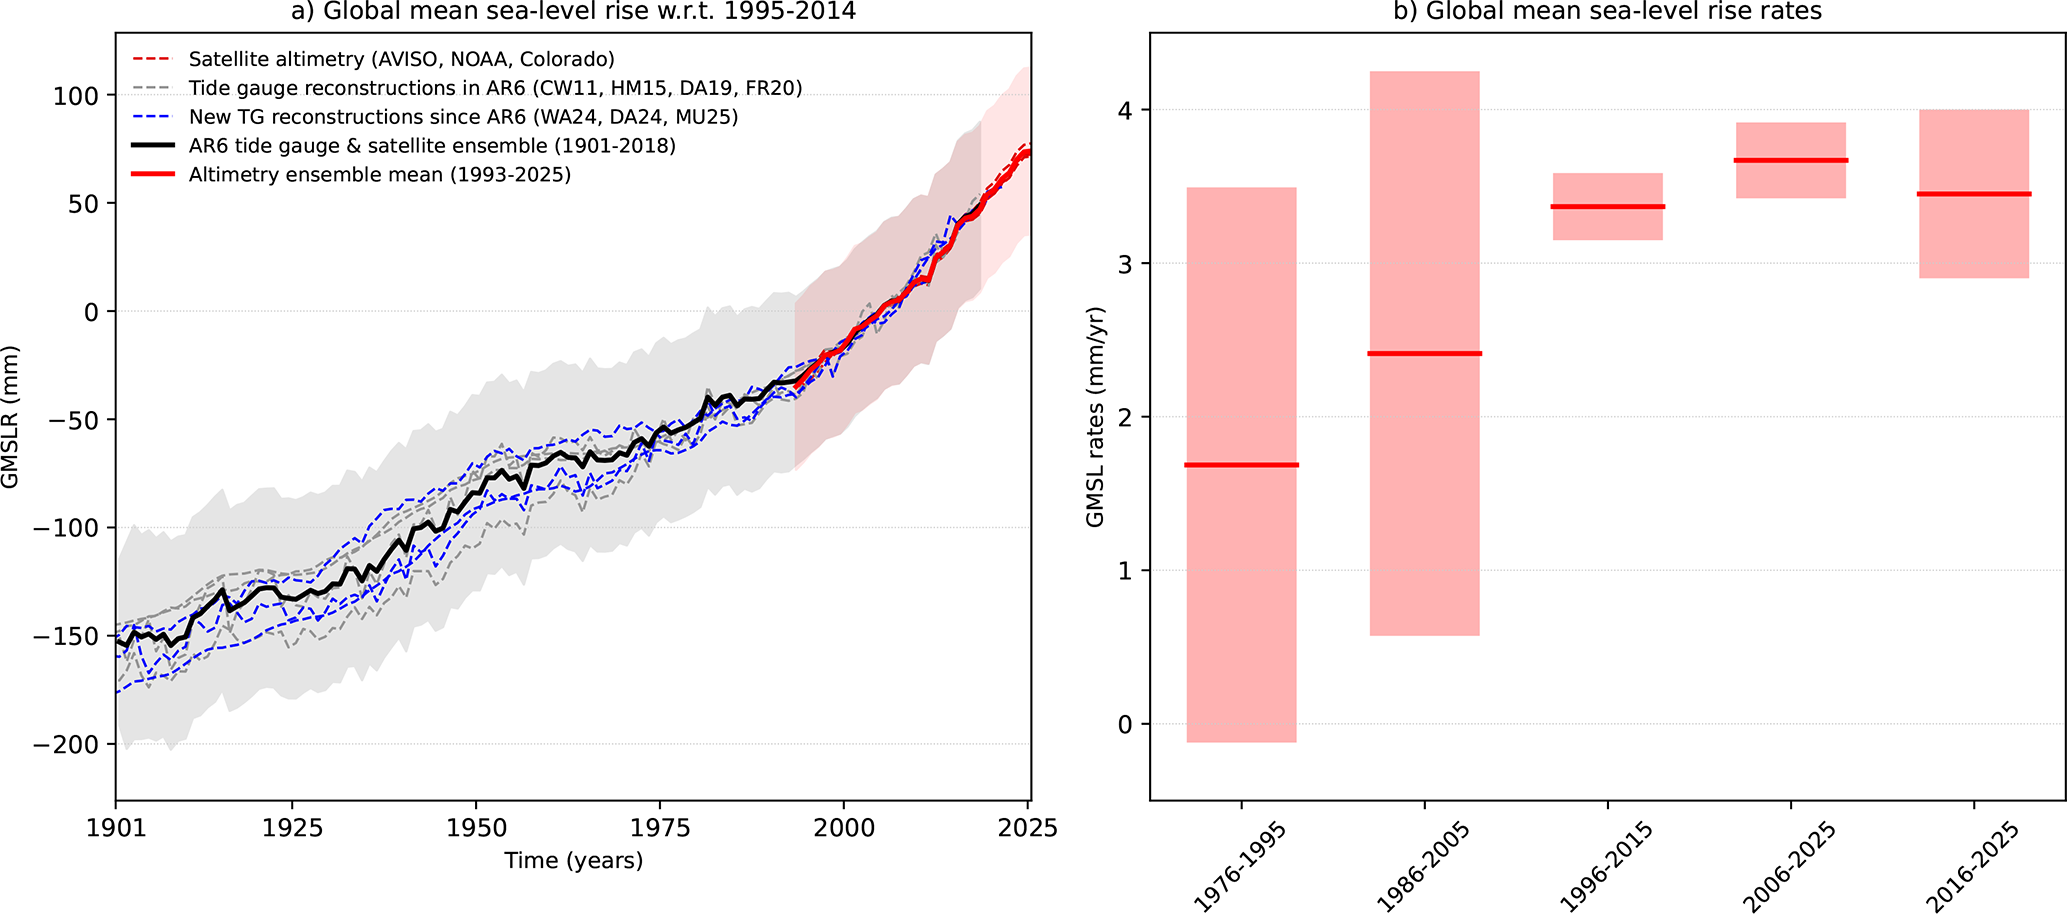
Over the long-term, sea levels have been rising, on average, at a rate of around 1.8mm per year since 1901, totalling a record 23cm in 2025. This is increasing the risk of coastal flooding, erosion and habitat loss in many low-lying areas around the world.

This rise can be seen in the left-hand chart below, which shows observed global sea level changes from tide gauges (grey and blue dashed lines) and satellites (red dashed lines) since 1901. The solid lines indicate the average across multiple datasets.

Sea level rise is accelerating consistent with the observed increase in Earth’s energy imbalance. Over 2006-25, sea levels have risen at a rate of 3.67mm per year – more than double the rate of 1.69mm per year seen over 1976-95.

This increasing rate is shown in the right-hand figure below, which shows four successive overlapping 20-year periods and the most-recent decade.

(Last year’s transition from El Niño to weak La Niña conditions affected global rainfall patterns and led to a small and temporary fall in global average sea level in 2025. This explains the slight decrease in rate of sea level rise for the most recent decade, which is affected more than the 20-year period 2006-25.)
Global average sea level rise over 1901-2025
Left: Global average sea level rise over 1901-2025, relative to a 1995-2014 baseline. Individual timeseries are shown with dashed lines, while the black solid line shows the average (from tide gauges and satellites) used in AR6 and the solid red line shows the 1993-2025 average from satellites. Right: Global mean sea-level rates (in mm per year) for four successive overlapping 20-year periods and the most-recent decade. The shading indicates the very likely range. Credit: Forster et al. (2026)

The bigger picture

Despite greenhouse gas emissions not increasing as rapidly as in the 2000s, this year’s IGCC findings continue to show how far and how fast the climate is changing due to human activity.

A significant increase in decarbonisation efforts in the second half of this decade is required to slow down the rate of human-caused warming and limit the escalation of climate risks and impacts.

These findings, like many others produced by scientists across the globe, rely on international expertise, partnership and the maintenance and availability of global climate datasets and the global observing programmes that underpin them.

This year’s edition of IGCC used more than 40 global datasets produced by research teams around the world, including the NASA satellite record of the Earth’s energy imbalance and the ARGO deep ocean float network.

However, a number of long-term monitoring programmes could be threatened by funding decisions made by governments around the world, most notably the Trump administration in the US.

Local meteorological data and weather balloon measurement programmes in many countries have declined in recent years, especially in Africa, the west Pacific and South America. This reduces scientists’ ability to monitor and understand key indicators of climate change.

This is not just an issue for climate science. Many of these observations are key to weather forecasts and systems that provide early warning for extreme weather. For example, media reports have suggested that recent reductions in weather balloon measurements in Alaska led to a lack of warnings for a recent winter storm.

The continuity and integrity of the climate observations that scientists use to understand how the climate is changing depends on effective and sustained coordination by international organisations, such as the Global Climate Observing System, the World Meteorological Organization and World Climate Research Programme.

Without this data and its coordination, future assessments will be much more difficult at a time when urgent climate action is needed.

The post Guest post: How a record-high ‘energy imbalance’ is driving global warming appeared first on Carbon Brief.

Guest post: How a record-high ‘energy imbalance’ is driving global warming

Continue Reading

Climate Change

Marine Parks Explained

Published

on

Australia’s network of marine parks is the largest in the world, covering more than half (52%) of Australia’s Commonwealth waters. You could be forgiven for assuming that a marine park is much like a national park on land: a highly protected place where people can enjoy nature while conservation efforts help habitats recover and wildlife thrive. You wouldn’t expect someone to bulldoze a national park, so why should they be allowed to bottom trawl in a marine park?

The reality is that not all marine parks are equally protected. Australia’s Marine Parks Network is divided into different zoning categories, with each zone determining which activities are permitted and the level of protection provided.

More than half of the Commonwealth Marine Parks Network allows industrial activities like oil and gas mining, and industrial fishing.

Our survival, and the survival of our planet, depends on the ocean. The ocean produces more oxygen than all of our forests combined, sustains communities and regulates the earth’s temperature. It’s home to wondrous wildlife and important ecosystems like coral reefs and kelp forests.

We love our big blue backyard

Australia’s ocean is teeming with life that is found nowhere else on earth. Schools of colourful fish, vibrant coral reefs, endemic shark nurseries, pods of dolphins, families of whales, playful seal pups and threatened Jurassic-era turtles call Australian waters home.

Since time began, from the turquoise waves to the deep blue, the ocean has connected our shorelines and communities, fed us, guided us and grounded us. We are intrinsically connected to our big blue backyard – more than 85% of us live within 50km of the shoreline. For tens of thousands of years, people have lived in harmony with the ocean and the wildlife within it, caring for and being sustained by its rich waters. Australia’s waters are some of the most unique and abundant places on Earth but our Marine Parks Network is falling short to properly protect them. 

Australia’s marine parks aren’t living up to their name

© Greenpeace / Harriet Spark

The Australian Commonwealth Marine Parks Network covers commonwealth waters 5.5km from the coast. The network is divided into 7 regional management areas, overall the network contains 60 marine parks. Zoning types determine what activities are allowed in each area. Over half of the network allows industrial activities, risking our most precious and threatened ocean wildlife.

Within many of our marine parks, destructive industries are allowed to fish, trawl, dig and mine using barbaric and cruel methods. Here are some of the zones explained:

  • Bottom Trawling: Special Purpose (trawl) zones allow bottom trawling. This covers 10 marine parks totalling almost 13 million hectares. Bottom trawlers bulldoze the seafloor with weighted nets, deforesting our underwater forests; a cruel, indiscriminate and inefficient way to fish.
  • Other Industrial Fishing: Includes “Habitat Protection Zones, ““Multi Use Zones” and “Special Purpose Zones.” Fishing methods vary from park to park but many marine parks in these zones allow industrial fishing like longlining. Longlining involves setting lines that can be 100km long, bristling with deadly hooks designed to catch a specific fish species. But longlining is not a selective method of fishing – significant numbers of sharks, rays, turtles, dolphins and seabirds can be harmed or killed as bycatch in the process.
  • Oil and Gas Mining: Many “Special Purpose” and “Multi Use” zones allow seismic blasting and oil and gas mining. 30 marine parks or 65 million hectares of Australia’s highest conservation value areas for ocean wildlife are open for mining and exploration of oil and gas.
  • Ocean Sanctuaries: National Park and Sanctuary zones are fully and highly protected marine parks designed to conserve wildlife and their habitat, where fishing, mining, and other industrial activities are not allowed.

Industrial fishing is one of the biggest threats to the ocean

Marine parks on the east coast that allow bottom trawling. 10 marine parks across the whole network allow bottom trawling totalling almost 13 million hectares of ocean habitat for precious wildlife.

In May, Greenpeace Australia Pacific sailed our campaigning vessel Oceania through some of Australia’s most beautiful and threatened marine parks. Our crew visited Jervis and Hunter marine parks to document their beauty, showcase what’s at risk and aim to expose the industrial fishing activities in these protected waters. Both of these marine parks allow bottom trawling and longlining methods of industrial fishing.

Industrial fishing is ripping the ocean apart across the planet. Longlining, also known as longline fishing, is an industrial fishing method that involves the use of a fishing line with thousands of baited hooks. These fishing lines can stretch over 100 kilometers in length and are set to capture a fish species, often tuna or billfish species. But it is not a selective method of fishing  and often results in significant bycatch. This includes a range of non-target species like sharks, rays, sea turtles, marine mammals, and seabirds which are often injured or killed as bycatch.

Bottom trawling involves dragging heavy weighted nets along the ocean floor. This fishing method is popular with commercial fishing companies, because it makes it easy to catch large quantities of fish in one go. But it also damages the seafloor, releasing carbon and can kill or injure non-target ocean life like coral, fur seals, dolphins and seabirds. You may have watched the reality of bottom trawling (and the benefits of ocean sanctuaries) in Ocean with David Attenborough, if not, add it to your watch list!  

Fully protected ocean sanctuaries that ban industrial fishing and mining can protect ocean wildlife and underwater wonderlands for generations to come. Vast, robust sanctuaries create blue havens where ocean wildlife are safe from nets and hooks, and can truly rest, recover, thrive and replenish out into the surrounding waters. Ocean sanctuaries ensure a healthy ocean full of life.

A once-in-a-decade chance to fix what’s falling short

We have a unique opportunity to turn the tide.

The Australian Government is asking for your feedback on how our Commonwealth Marine Parks Network is managed. This is our once-in-a-decade chance to protect ocean wildlife, ban industrial fishing and create more ocean sanctuaries.

As part of the review the Government is asking for submissions from the public to hear from you on what improvements are needed to better protect our vast network of marine parks. Writing a submission is a powerful way to influence government decisions and create real change.

This is the moment to ban industrial activities like bottom trawling and oil and gas mining. But only if they hear from YOU. Add your name!

Greenpeace is calling on the Australian government to:

1. Ban industrial activities from Australia’s Marine Parks Network: Ban industrial activities, such as industrial fishing, seismic blasting and oil and gas mining, from Australia’s marine parks.

2. Create more ocean sanctuaries: Increase fully protected sanctuaries in Australia’s marine parks based on science principles.

3. Connect Australia’s Marine Parks Network to the High Seas: mCreate seascape connectivity by linking Australian marine parks to new high seas ocean sanctuaries.

References

Substantiation that more than half of the Marine Parks Network permits industrial activity comes from a peer-reviewed systematic literature review (Phillips et al. 2025, PLOS One, https://doi.org/10.1371/journal.pone.0307324). The study found that within the Commonwealth Marine Parks Network specifically, “all zones are considered partially protected areas, meaning areas where extractive activities are permitted, except ‘Pink zones’ (Preservation Zones; IUCN Ia) and ‘Green Zones’ (IUCN II).” In other words, every Commonwealth marine park zone type other than the network’s strict no-take sanctuary and national park zones (IUCN Ia and II) permits some form of extractive industrial activity. Since no-take zones are the minority zone type across the network by area, this supports the conclusion that the majority of the network’s area is zoned to permit industrial activity.

DCCEEW Australian Marine Parks spatial dataset (https://fed.dcceew.gov.au/datasets/erin::australian-marine-parks/explore), filtered by zone type. This confirms that 38.43% of the network’s area is zoned as Sanctuary or National Park zones (IUCN Ia and II). These are the no-take categories excluded from the peer-reviewed study’s definition of partially protected/industrial-permitting zones. The remaining 61.57% of the network falls within the zone categories the study classifies as permitting industrial activity (per The MPA Guide definition of “industrial” applied in Phillips et al. 2025), directly corroborating the peer-reviewed finding with current Commonwealth-specific spatial data.

For further information on activities permitted within the Marine Parks Network Zoning, you can refer to the Management Plans zoning and rules for each Marine Parks Network area, for example: Temperate East, Coral Sea, North.

Marine Parks Explained

Continue Reading

Climate Change

Report: Trawling the Bottom Line

Published

on

A new report from Greenpeace Australia Pacific advocates for the closure of bottom trawling in Australia’s Commonwealth Marine Parks Network. Bottom trawling continues to be a pervasive threat to ocean life in Australia, with 10 marine parks totalling almost 13 million hectares, allowing bottom trawling.

Australia’s network of marine parks, which is the biggest in the world, covers more than half (52%) of Australia’s Commonwealth domestic waters, but not all parks are created equal. Australia’s Marine Parks Network is divided into different zoning categories, with each zone determining which activities are permitted and the level of protection provided. More than half of the Marine Parks Network allow industrial activities like industrial fishing and oil and gas mining. This includes zoning types that allow destructive fishing by longliners and bottom trawlers, who pillage underwater wonderlands, rip up coral and indiscriminately and violently catch any animal in their path, including turtles, seals and dolphins, all within areas labelled a marine park.

The Federal government has commenced a review into the majority of Australia’s Commonwealth Marine Parks Network management plans. This presents an opportunity to ban industrial activities from our marine parks and create more ocean sanctuaries.

Australia’s waters are some of the most unique and abundant places on earth, and are a global hotspot of biodiversity. Vibrant coral reefs and wondrous wildlife like endangered turtles, dolphins, and whales, some found nowhere else on earth, call Australia’s waters home. 

Australia’s network of marine parks is the biggest in the world. It covers 52 per cent of Australia’s domestic waters, but more than half of the network allows destructive, extractive industries like seismic blasting, industrial fishing and oil and gas mining. Longliners and bottom trawlers frequent these marine parks, looking for fish but catching everything in their path. 

In May 2026, Greenpeace Australia Pacific’s campaigning vessel Oceania traveled to Jervis Bay Marine Park and Hunter Marine Park to document their beauty, the wildlife under threat and aim to expose the industrial fishing activities in these so called protected waters.

Greenpeace is calling on the federal government to ban industrial activities from the marine parks network, create more fully protected ocean sanctuaries and connect the network to new high seas ocean sanctuaries.

Report: Trawling the Bottom Line

Continue Reading

Climate Change

Sewing and Painting the Future

Published

on

The iconic Greenpeace ship hosts community and family activities over the weekend from 27-30 April, including banner-making workshops and tours of the ship, culminating in a community paddle out for the climate and ocean at South Beach.
© Harriet Spark / Grumpy Turtle Film / Greenpeace

The banner drop is a distinctive part of the Greenpeace repertoire.

The moment of the unfolding is intrinsically dramatic. It is the reveal; when the moral and scientific truth of a situation is unveiled to the world. The wrong is being labelled—not through a written submission, or a social media post, or a statement in a meeting—but in words emblazoned in real physical space, chosen and occupied with precision, for all to see. There is jeopardy and transgression. And there are consequences—for the activists and for Greenpeace, as well as for the target of the communication. One of the reasons the banner remains such an effective tool in our toolbox is because of its undeniable clarity in cutting through, driving change and accountability in a way that few other tactics can. It is naming the wrong: in giant, clear letters.

We’ve hung these massive messages at environmental crime scenes, corporate headquarters, and iconic landmarks; on government buildings, ships and planes—in locations all around the world, for years.

My own memories unfurl even as I write this, but because the campaign to stop Woodside at Scott Reef is so pressing, what immediately springs to mind are two of our banners in that campaign: one on a crane outside their Perth HQ, and another on some of their corroding industrial junk at sea. What about you? Is there a particular banner that you picture when you think of Greenpeace?

The banners can attract global attention, but they have quiet beginnings. Each one is made by hand, often by volunteers. It is the invisible labour behind each spectacular public moment. One of the key pieces of equipment in our workshop at Rainbow Warrior House is the sewing machine. Sometimes our workshop is full of people and noise; at others it is quiet, the only sound being the gentle, purposeful, whir and buzz of a banner being sewn. It is usually our warehouse manager, Kieran Holmes, on the tools, head over the machine, carefully pouring over the raw canvas or tarp as the banner takes shape. Kieran’s one of those people who seems to be able to turn his hand to almost anything, but you wouldn’t know it because he’s old-school modest. In addition to being incredibly skilled, Kieran’s an all-round beaut human to have in the heart of our headquarters; never too busy to take the time to show a newcomer, or curious visitor, around his domain. 

Once the banner is sewn up, the lettering needs to be outlined. This is done on a magnetic wall—a fit-for-purpose feature at Rainbow Warrior House, where the banner is held up with magnets, and the edges of the letters neatly traced from a projection.

Next comes the painting. It usually starts late in the afternoon, sometimes going into evenings and weekends, with volunteers, staff, mates crowded around, brushes in hand. It is a calming meditative feeling of shared purpose, giving each letter its visual heft, the colour building power and presence with each stroke.

Then you stand back, stretch, and look at the message, now ready.

S A V E S C O T T R E E F

Throughout history, every great push for social change has required some form of invisible labour; preparation in the form of quiet things seldom seen, but vital. It is the enabling work of love instantiated in action. And of course, so much of the time it has been women who have done this labour, so that the men could get the chance to make the speeches and stand on the podiums. The inaugural Greenpeace voyage to stop nuclear testing in 1971 had a male-only crew, but wouldn’t have happened without the ideas and work of women behind the scenes.

It is what we do together, after all, that changes the world. Sometimes that work happens on a stage, a ship on the wild seas, or up the side of a building. But mostly, it is the hidden diligence of those who care and contribute to all the enabling work that makes a change once thought impossible, inevitable. It is Kieran at his sewing machine. It was Dorothy Stowe doing the administrative work of the ‘Don’t Make A Wave Committee’ that became Greenpeace.

When we think of social change, it is the sturm and drang that we remember. The drop of the banner, the chant of the crowd, the raising of the new flag. But look behind the curtain, and there’ll be a crew of people who are taking responsibility for the administration, the sewing and the painting, making the food, checking the bus timetables, getting stuff done. And behind them are even more handsinvisibly donating time and trust; the financial, material and expert resources that make it all possible. There’s love, camaraderie and know-how at every stage.

We are social and cooperative creatures by nature. And we human beings have been stitching for millenia, sewing the possibilities of our common future. Political and corporate bullies and algorithmically manipulative platforms would have us forget this, and abandon who we are. But we should be in no doubt that the brighter prospects for ourselves and life on earth continue to be stitched and painted; collaboratively and with love, by the diligent hands of millions of people who care, each day, in every community and city across the world.

With Love,

David


Q & A

I always get great questions when interviewing prospective new team members. One that came up again recently was: “Is Greenpeace actually one organisation?”

Around the world, people know Greenpeace by our one global name, united by a shared mission: securing an Earth capable of nurturing life in all its magnificent diversity, with a particular focus on climate and biodiversity. Behind the scenes, though, we’re organised as a network of 25 legally autonomous national and regional offices, including Greenpeace Australia Pacific, working alongside Greenpeace International.

That structure gives us the best of both worlds: we work together leveraging the power of a global network on the issues that matter most, while each office remains legally independent and deeply connected to the communities, cultures and political realities where we’re embedded. Local knowledge informs global action, and global collaboration strengthens and supports local campaigns.

It’s a model that has enabled Greenpeace to take on some of the world’s biggest challenges for over five decades–while withstanding challenges and attacks from governments and corporations. Global enough to tackle global problems, local enough to understand our communities and the natural places we love.

If you’re curious to learn more, you can read about the Greenpeace Global Network structure here.

Sewing and Painting the Future

Continue Reading

Trending

Copyright © 2022 BreakingClimateChange.com