
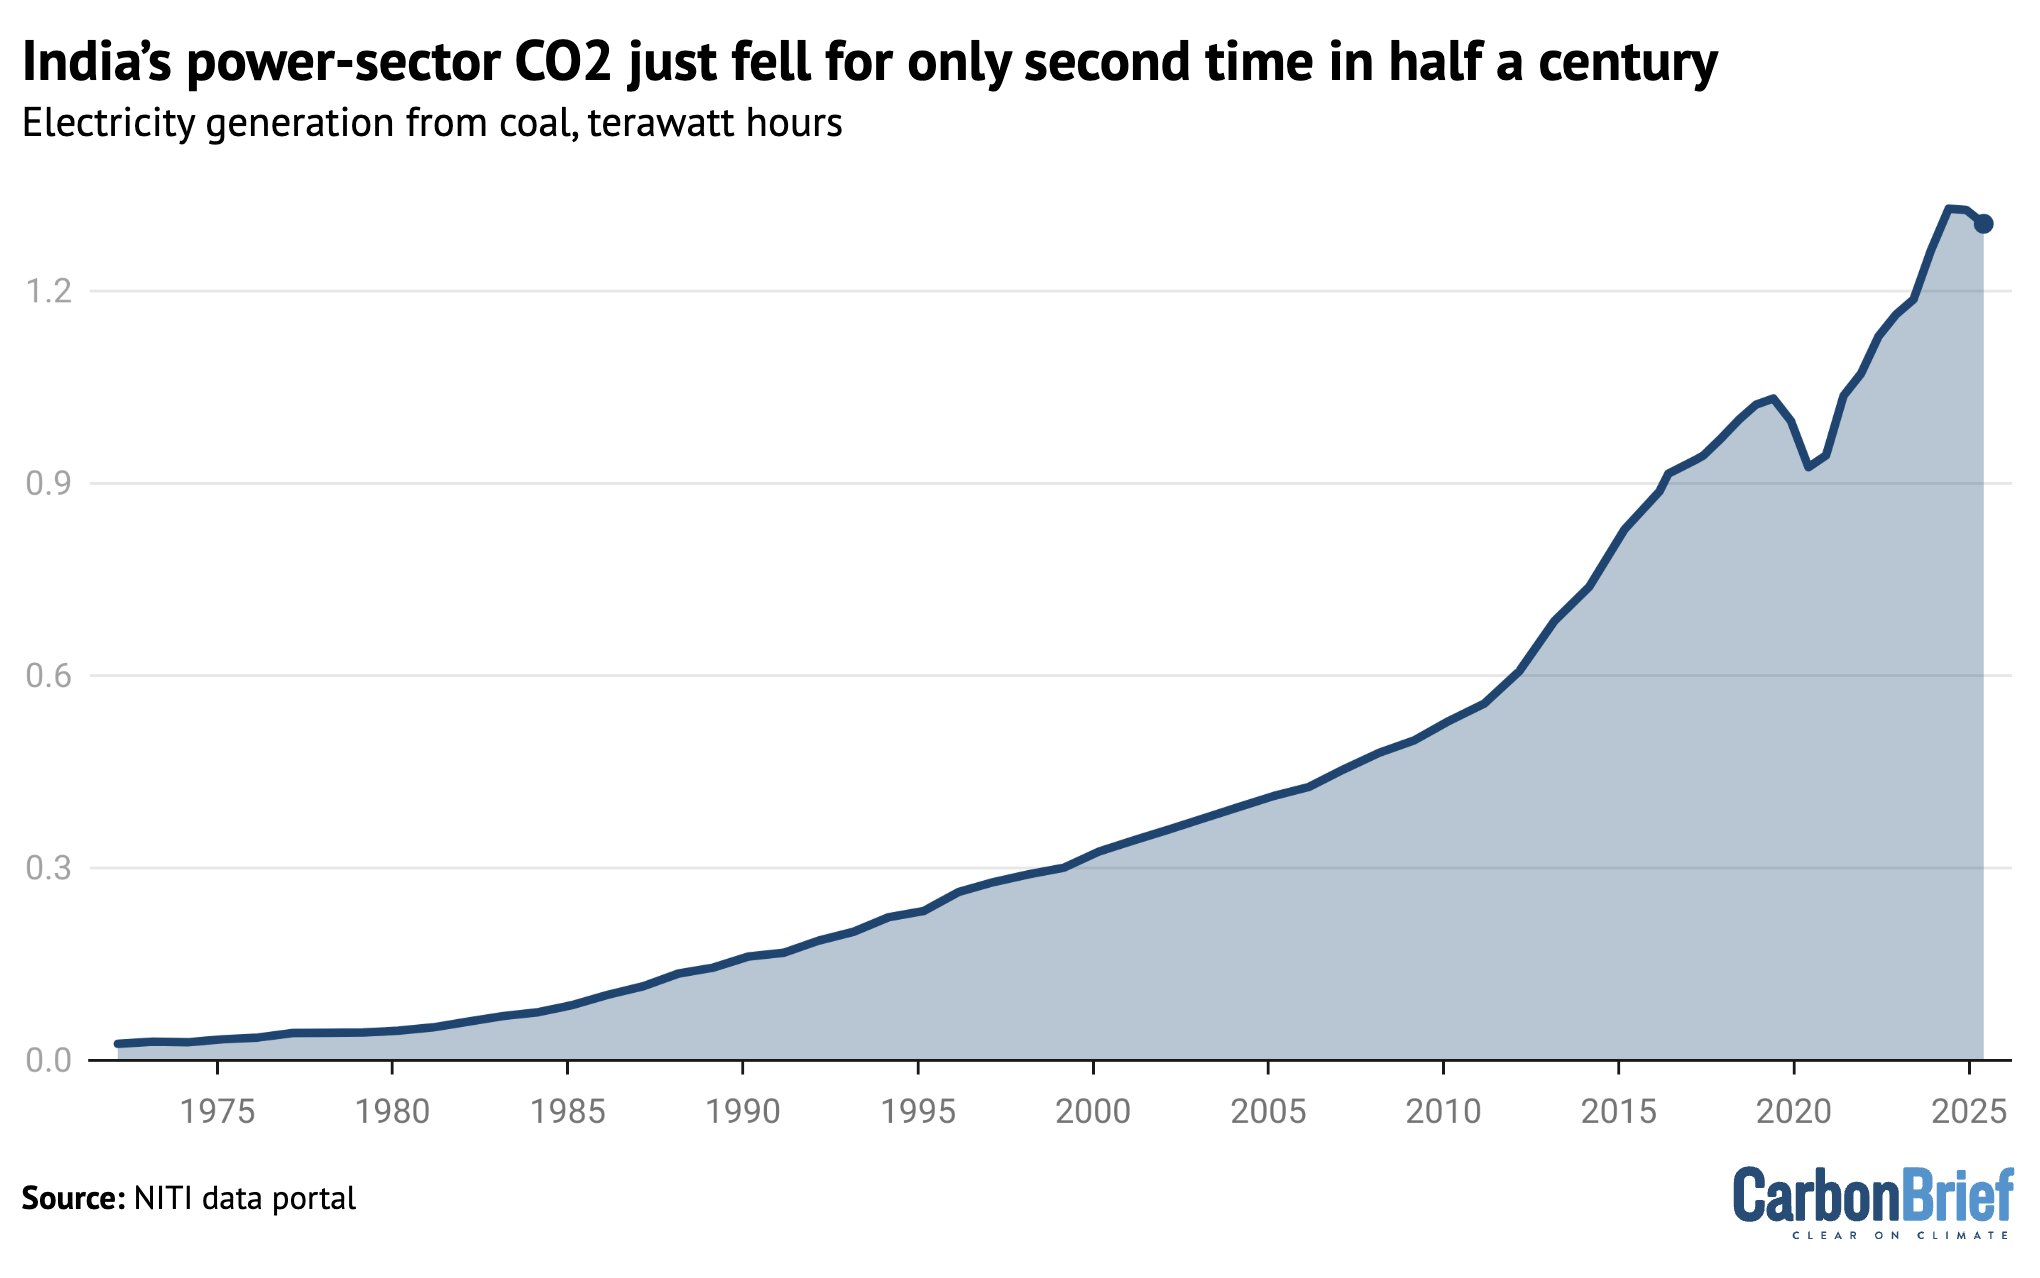
India’s carbon dioxide (CO2) emissions from its power sector fell by 1% year-on-year in the first half of 2025 and by 0.2% over the past 12 months, only the second drop in almost half a century.
As a result, India’s CO2 emissions from fossil fuels and cement grew at their slowest rate in the first half of the year since 2001 – excluding Covid – according to new analysis for Carbon Brief.
The analysis is the first of a regular new series covering India’s CO2 emissions, based on monthly data for fuel use, industrial production and power output, compiled from numerous official sources.
(See the regular series on China’s CO2 emissions, which began in 2019.)
Other key findings on India for the first six months of 2025 include:
- The growth in clean-energy capacity reached a record 25.1 gigawatts (GW), up 69% year-on-year from what had, itself, been a record figure.
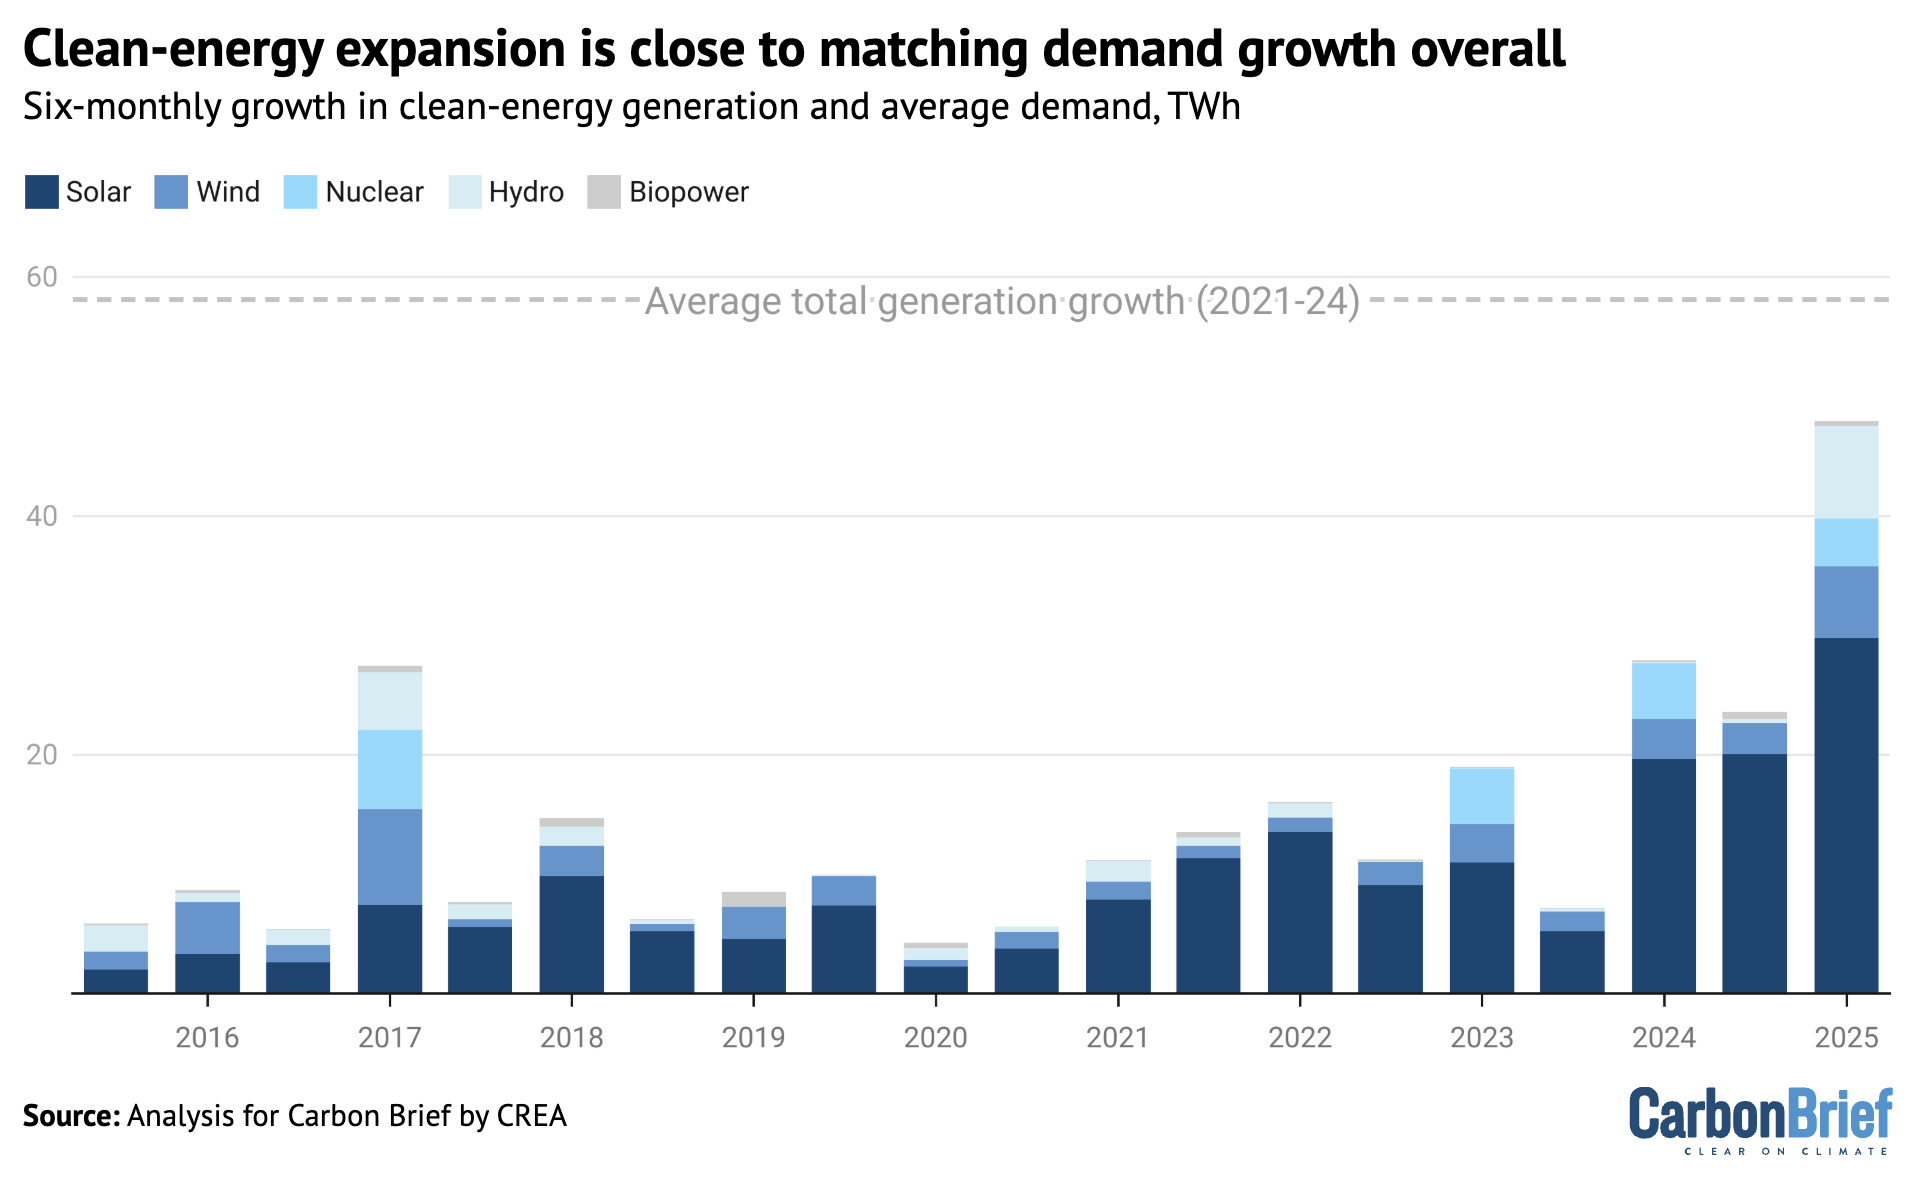
- This new clean-energy capacity is expected to generate nearly 50 terawatt hours (TWh) of electricity per year, nearly sufficient to meet the average increase in demand overall.
- Slower economic expansion meant there was zero growth in demand for oil products, a marked fall from annual rates of 6% in 2023 and 4% in 2024.
- Government infrastructure spending helped accelerate CO2 emissions growth from steel and cement production, by 7% and 10%, respectively.
The analysis also shows that emissions from India’s power sector could peak before 2030, if clean-energy capacity and electricity demand grow as expected.
The future of CO2 emissions in India is a key indicator for the world, with the country – the world’s most populous – having contributed nearly two-fifths of the rise in global energy-sector emissions growth since 2019.
India’s surging emissions slow down
In 2024, India was responsible for 8% of global energy-sector CO2 emissions, despite being home to 18% of the world’s population, as its per-capita output is far below the world average.
However, emissions have been growing rapidly, as shown in the figure below.
The country contributed 31% of global energy-sector emissions growth in the decade to 2024, rising to 37% in the past five years, due to a surge in the three-year period from 2021-23.
More than half of India’s CO2 output comes from coal used for electricity and heat generation, making this sector the most important by far for the country’s emissions.
The second-largest sector is fossil fuel use in industry, which accounts for another quarter of the total, while oil use for transport makes up a further eighth of India’s emissions.
India’s CO2 emissions from fossil fuels and cement grew by 8% per year from 2019 to 2023, quickly rebounding from a 7% drop in 2020 due to Covid.
Before the Covid pandemic, emissions growth had averaged 4% per year from 2010 to 2019, but emissions in 2023 and 2024 rose above the pre-pandemic trendline.
This was despite a slower average GDP growth rate from 2019 to 2024 than in the preceding decade, indicating that the economy became more energy- and carbon-intensive. (For example, growth in steel and cement outpaced the overall rate of economic growth.)
A turnaround came in the second half of 2024, when emissions only increased by 2% year-on-year, slowing down to 1% in the first half of 2025, as seen in the figure below.

The largest contributor to the slowdown was the power sector, which was responsible for 60% of the drop in emissions growth rates, when comparing the first half of 2025 with the years 2021-23.
Oil demand growth slowed sharply as well, contributing 20% of the slowdown. The only sectors to keep growing their emissions in the first half of 2025 were steel and cement production.
Another 20% of the slowdown was due to a reduction in coal and gas use outside the power, steel and cement sectors. This comprises construction, industries such as paper, fertilisers, chemicals, brick kilns and textiles, as well as residential and commercial cooking, heating and hot water.
This is all shown in the figure below, which compares year-on-year changes in emissions during the second half of 2024 and the first half of 2025, with the average for 2021-23.

Power sector emissions fell by 1% in the first half of 2025, after growing 10% per year during 2021-23 and adding more than 50m tonnes of CO2 (MtCO2) to India’s total every six months.
Oil product use saw zero growth in the first half of 2025, after rising 6% per year in 2021-23.
In contrast, emissions from coal burning for cement and steel production rose by 10% and 7%, respectively, while coal use outside of these sectors fell 2%.
Gas consumption fell 7% year-on-year, with reductions across the power and industrial sectors as well as other users. This was a sharp reversal of the 5% average annual growth in 2021-23.
Power-sector emissions pause
The most striking shift in India’s sectoral emissions trends has come in the power sector, where coal consumption and CO2 emissions fell 0.2% in the 12 months to June and 1% in the first half of 2025, marking just the second drop in half a century, as shown in the figure below.
The reduction in coal use comes after more than a decade of break-neck growth, starting in the early 2010s and only interrupted by Covid in 2020. It also comes even as the country plans large amounts of new coal-fired generating capacity.
In the first half of 2025, total power generation increased by 9 terawatt hours (TWh) year-on-year, but fossil power generation fell by 29TWh, as output from solar grew 17TWh, from wind 9TWh, from hydropower by 9TWh and from nuclear by 3TWh.
Analysis of government data shows that 65% of the fall in fossil-fuel generation can be attributed to lower electricity demand growth, 20% to faster growth in non-hydro clean power and the remaining 15% to higher output at existing hydropower plants.
Slower growth in electricity usage was largely due to relatively mild temperatures and high rainfall, in contrast to the heatwaves of 2024. A slowdown in industrial sectors in the second quarter of the year also contributed.
In addition, increased rainfall drove the jump in hydropower generation. India received 42% above-normal rainfall from March to May 2025. (In early 2024, India’s hydro output had fallen steeply as a result of “erratic rainfall”.)
Lower temperatures and this abundant rainfall reduced the need for air conditioning, which is responsible for around 10% of the country’s total power demand. In the same period in 2024, demand surged due to record heatwaves and higher temperatures across the country.
The growth in clean-power generation was buoyed by the addition of a record 25.1GW of non-fossil capacity in the first half of 2025. This was a 69% increase compared with the previous period in 2024, which had also set a record.
Solar continues to dominate new installations, with 14.3GW of capacity added in the first half of the year coming from large scale solar projects and 3.2GW from solar rooftops.
Solar is also adding the majority of new clean-power output. Taking into account the average capacity factor of each technology, solar power delivered 62% of the additional annual generation, hydropower 16%, wind 13% and nuclear power 8%.
The new clean-energy capacity added in the first half of 2025 will generate record amounts of clean power. As shown in the figure below, the 50TWh per year from this new clean capacity is approaching the average growth of total power generation.
(When clean-energy growth exceeds total demand growth, generation from fossil fuels declines.)
India is expected to add another 16-17GW of solar and wind in the second half of 2025. Beyond this year, strong continued clean-energy growth is expected, towards India’s target for 500GW of non-fossil fuel capacity by 2030 (see below).
Slowing oil demand growth
The first half of 2025 also saw a significant slowdown in India’s oil demand growth. After rising by 6% a year in the three years to 2023, it slowed to 4% in 2024 and zero in the first half of 2025.
The slowdown in oil consumption overall was predominantly due to slower growth in demand for diesel and “other oil products”, which includes bitumen.
In the first quarter of 2025, diesel demand actually fell, due to a decline in industrial activity, limited weather-related mobility and – reportedly – higher uptake of vehicles that run on compressed natural gas (CNG), as well as electricity (EVs).
Diesel demand growth increased in March to May, but again declined in June because of early and unusually severe monsoon rains in India, leading to a slowdown in industrial and mining activities, disrupted supply-chains and transport of raw material, goods and services.
The severe rains also slowed down road construction activity, which in turn curtailed demand for transportation, construction equipment and bitumen.
Weaker diesel demand growth in 2024 had reflected slower growth in economic activity, as growth rates in the industrial and agricultural sectors contracted compared to previous years.
Another important trend is that EVs are also cutting into diesel demand in the commercial vehicles segment, although this is not yet a significant factor in the overall picture.
EV adoption is particularly notable in major metropolitan cities and other rapidly emerging urban centres and in the logistics sector, where they are being preferred for short haul rides over diesel vans or light commercial vehicles.
EVs accounted for only 7.6% of total vehicle sales in the financial year 2024-25, up 22.5% year-on-year, but still far from the target of 30% by 2030.
However, any significant drop in diesel demand will be a function of adoption of EV for long-haul trucks, which account for 32% of the total CO2 emissions from the transport sector. Only 280 electric trucks were sold in 2024, reported NITI Aayog.
Trucks remain the largest diesel consumers. Moreover, truck sales grew 9.2% year-on-year in the second quarter of 2025, driven in part by India’s target of 75% farm mechanisation by 2047. This sales growth may outweigh the reduction in diesel demand due to EVs. Subsidies for electric tractors have seen some pilots, but demand is yet to take off.
Apart from diesel, petrol demand growth continued in the first half of 2025 at the same rate as in earlier years. Modest year-on-year growth of 1.3% in passenger vehicle sales could temper future increases in petrol demand, however. This is a sharp decline from 7.5% and 10% growth rates in sales in the same period in 2024 and 2023.
Furthermore, EVs are proving to be cheaper to run than petrol for two- and three-wheelers, which may reduce the sale of petrol vehicles in cities that show policy support for EV adoption.
Steel and cement emissions continue to grow
As already noted, steel and cement were the only major sectors of India’s economy to see an increase in emissions growth in the first half of 2025.
While they were only responsible for around 12% of India’s total CO2 emissions from fossil fuels and cement in 2024, they have been growing quickly, averaging 6% a year for the past five years.
The growth in emissions accelerated in the first half of 2025, as cement output rose 10% and steel output 7%, far in excess of the growth in economic output overall.
Steel and cement growth accelerated further in July. A key demand driver is government infrastructure spending, which tripled from 2019 to 2024.
In the second quarter of 2025, the government’s capital expenditure increased 52% year-on-year. albeit from a low base during last year’s elections. This signals strong growth in infrastructure.
The government is targeting domestic steel manufacturing capacity of 300m tonnes (Mt) per year by 2030, from 200Mt currently, under the National Steel Policy 2017, supported by financial incentives for firms that meet production targets for high quality steel.
The government also imposed tariffs on steel imports in April and stricter quality standards for imports in June, in order to boost domestic production.
Government policies such as Pradhan Mantri Awas Yojna – a “housing for all” initiative under which 30m houses are to be built by FY30 – is further expected to lift demand for steel and cement.
The automotive sector in India is expected to grow at a fast pace, with sales expected to reach 7.5m units for passenger vehicle and commercial vehicle segments from 5.1m units in 2023, in addition to rapid growth in electric vehicles. This can be expected to be another key driver for growth of the steel sector, as 900 kg of steel is used per vehicle.
Without stringent energy efficiency measures and the adoption of cleaner fuel, the expected growth in steel and cement production could drive significant emissions growth from the sector.
Power-sector emissions could peak before 2030
Looking beyond this year, the analysis shows that CO2 from India’s power sector could peak before 2030, having previously been the main driver of emissions growth.
To date, India’s clean-energy additions have been lagging behind the growth in total electricity demand, meaning fossil-fuel demand and emissions from the sector have continued to rise.
However, this dynamic looks likely to change. In 2021, India set a target of having 500GW of non-fossil power generation capacity in place by 2030. Progress was slow at first, so meeting the target implies a substantial acceleration in clean-energy additions.
The country has been laying the groundwork for such an acceleration.
There was 234GW of renewable capacity in the pipeline as of April 2025, according to the Ministry of New and Renewable Energy. This includes 169GW already awarded contracts, of which 145GW is under construction, and an additional 65GW put out to tender. There is also 5.2GW of new nuclear capacity under construction.
If all of this is commissioned by 2030, then total non-fossil capacity would increase to 482GW, from 243GW at the end of June 2025, leaving a gap of just 18GW to be filled with new projects.
When the non-fossil capacity target was set in 2021, CREA assessed that the target would suffice to peak demand for coal in power generation before 2030. This assessment remains valid and is reinforced by the latest Central Electricity Authority (CEA) projection for the country’s “optimal power mix” in 2030, shown in the figure below.

In the CEA’s projection, the share of non-fossil power generation rises to 44% in the 2029-30 fiscal year, up from 25% in 2024-25. From 2025 to 2030, power demand growth, averaging 6% per year, is entirely covered from clean sources.
To accomplish this, the growth in non-fossil power generation would need to accelerate over time, meaning that towards the end of the decade, the growth in clean power supply would clearly outstrip demand growth overall – and so power generation from fossil fuels would fall.
While coal-power generation is expected to flatline, large amounts of new coal-power capacity is still being planned, because of the expected growth in peak electricity demand.
The post-Covid increase in electricity demand has given rise to a wave of new coal power plant proposals. Recent plans from the government target an increase in coal-power capacity by another 80-100GW by 2030-32, with 35GW already under construction as of July 2025.
The rationale for this is the increase in peak electricity loads, associated in particular with worsening heatwaves and growing use of air conditioning. The increase might yet prove unneeded.
Analysis by CREA shows that solar and wind are making an increasing contribution to meeting peak loads. This contribution will increase with the roll-out of solar power with integrated battery storage, the cost of which fell by 50-60% from 2023 to 2025.
The latest auction held in India saw solar power with battery storage bidding at prices, per unit of electricity generation, that were lower than the cost of new coal power.
This creates the opportunity to accelerate the decarbonisation of India’s power sector, by reducing the need for thermal power capacity.
The clean-energy buildout has made it possible for India to peak its power-sector emissions within the next few years, if contracted projects are built, clean-energy growth is maintained or accelerated beyond 2030 and demand growth remains within the government’s projections.
This would be a major turning point, as the power sector has been responsible for half of India’s recent emissions growth. In order to peak its emissions overall, however, India would still need to take further action to address CO2 from industry and transport.
With the end-of-September 2025 deadline nearing, India has yet to publish its international climate pledge (nationally determined contribution, NDC) for 2035 under the Paris Agreement, meaning its future emissions path, in the decades up to its 2070 net-zero goal, remains particularly uncertain.
The country is expected to easily surpass the headline climate target from its previous NDC, of cutting the emissions intensity of its economy to 45% below 2005 levels by 2030. As such, this goal is “unlikely to drive real world emission reductions”, according to Climate Action Tracker.
In July of this year, it met a 2030 target for 50% of installed power generating capacity to be from non-fossil sources, five years early.
About the data
This analysis is based on official monthly data for fuel consumption, industrial production and power generation from different ministries and government institutes.
Coal consumption in thermal power plants is taken from the monthly reports downloaded from the National Power Portal of the Ministry of Power. The data is compiled for the period January 2019 until June 2025. Power generation and capacity by technology and fuel on a monthly basis are sourced from the NITI data portal.
Coal use at steel and cement plants, as well as process emissions from cement production, are estimated using production indices from the Index of Eight Core Industries released monthly by the Office of Economic Adviser, assuming that changes in emissions follow production volumes.
These production indices were used to scale coal use by the sectors in 2022. To form a basis for using the indices, monthly coal consumption data for 2022 was constructed for the sectors using the annual total coal consumption reported in IEA World Energy Balances and monthly production data in a paper by Robbie Andrew, on monthly CO2 emission accounting for India.
Annual cement process emissions up to 2024 were also taken from Robbie Andrew’s work and scaled using the production indices. This approach better approximated changes in energy use and emissions reported in the IEA World Energy Balances, than did the amounts of coal reported to have been dispatched to the sectors, showing that production volumes are the dominant driver of short-term changes in emissions.
For other sectors, including aluminium, auto, chemical and petrochemical, paper and plywood, pharmaceutical, graphite electrode, sugar, textile, mining, traders and others, coal consumption is estimated based on data on despatch of domestic and imported coal to end users from statistical reports and monthly reports by the Ministry of Coal, as consumption data is not available.
The difference between consumption and dispatch is stock changes, which are estimated by assuming that the changes in coal inventories at end user facilities mirror those at coal mines, with end user inventories excluding power, steel and cement assumed to be 70% of those at coal mines, based on comparisons between our data and the IEA World Energy Balances.
Stock changes at mines are estimated as the difference between production at and despatch from coal mines, as reported by the Ministry of Coal.
In the case of the second quarter of the year 2025, data on domestic coal has been taken from the monthly reports by the Ministry of Coal. The regular data releases on coal imports have not taken place for the second quarter of 2025, for unknown reasons, so data was taken from commercial data providers Coal Hub and mjunction services ltd.
Product-wise petroleum product consumption data, as well as gas use by sector, was downloaded from the Petroleum Planning and Analysis Cell of the Ministry of Petroleum & Natural Gas.
As the fuel dispatch and consumption data is reported as physical volumes, calorific values are taken from IEA’s World Energy Balance and CO2 emission factors from 2006 IPCC Guidelines for National Greenhouse Gas Inventories.
Calorific values are assigned separately to different fuel types, including domestic and imported coal, anthracite and coke, as well as petrol, diesel and several other oil products.


The post Analysis: India’s power-sector CO2 falls for only second time in half a century appeared first on Carbon Brief.
Analysis: India’s power-sector CO2 falls for only second time in half a century
The UN body that regulates mining in international waters has defended its authority over ocean governance after two subsidiaries of deep-sea mining firm The Metals Company (TMC) launched legal action to halt an investigation into their conduct.
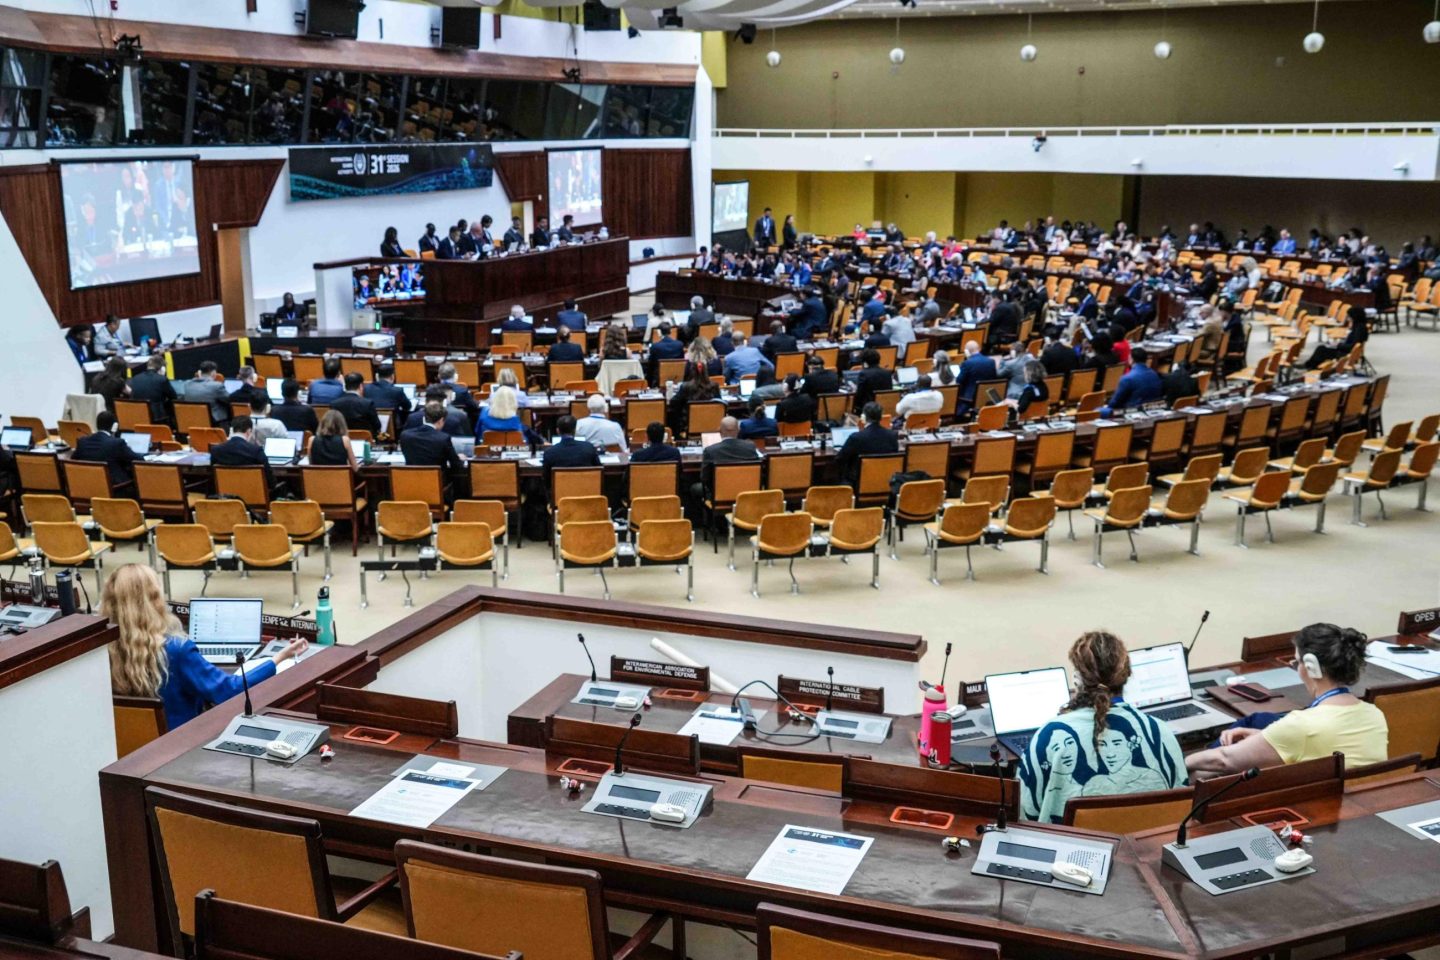
Speaking at the International Seabed Authority’s (ISA) annual meeting in Kingston on Monday, secretary-general Leticia Carvalho said the regulator’s role “matters more than ever” as governments grapple with growing pressure to exploit the deep seabed for minerals needed for the energy transition.
“The deep seabed belongs to no single country and no corporation; it belongs to all of us,” Carvalho said, describing its resources as “the common heritage of humankind”.
“If we lose sight of this,” she added, “we risk repeating on the ocean floor the same injustices and destruction we still strive to remedy on land.”
The conflict stems from TMC’s attempt to bypass the UN process by applying for US-sponsored ocean mining permits offered last year by the Trump administration. The Canadian firm aims to become the first company to mine the seabed for minerals like nickel, rare earths and manganese used in the production of both clean energy technologies and military equipment.
Several governments, including China, condemned the move as a “violation of international law”. In response, ISA member states agreed to open an inquiry into its licence-holders – among them two of TMC’s subsidiaries – to make sure they have complied with international law. If they are ultimately found to have breached those obligations, their exploration contracts could be revoked.
In June, the two TMC subsidiaries – Tonga Offshore Mining Ltd (TOML) and Nauru Ocean Resources Inc (NORI) – filed claims against the ISA at the International Tribunal for the Law of the Sea (ITLOS), asking the court to suspend the inquiry while the case proceeds. The companies argue they are being targeted “without lawful procedural basis”, “in breach of due process”, and without “good faith”.
Environmental groups have accused The Metals Company of using legal tactics to block the investigation into its subsidiaries.
“We find ourselves in this Orwellian situation where these companies are trying to effectively get an injunction against the ISA from continuing its inquiry,” said Louisa Casson, who leads Greenpeace’s global campaign against deep-sea mining.
“The stakes are so high and that’s why we’re seeing this pretty extraordinary move to try to get an injunction against the ISA,” she added.
-
Trump throws lifeline to Canadian deep-sea miner, setting scene for international clash
US president’s executive order looks like a victory for Vancouver-based The Metals Company (TMC) and other industry advocates, but fierce environmental and international opposition still stands in the way of ocean floor mining -
UK government faces legal challenge over deep sea mining permits to “opaque” firm
Greenpeace says UK may have acted unlawfully by transferring deep-sea mining licences to firm with US ties -
Loss and damage fund delays first project approvals as needs dwarf resources
The new Fund for Responding to Loss and Damage faces an overwhelming number of initial requests for its limited pot of money and board members decided to take more time to choose which to back first


Mining the deep ocean floor
The ISA has been negotiating a mining code for the deep ocean floor for over 12 years without success. Nearly 40 governments, including the UK, France and Germany, have called for a moratorium or precautionary pause on deep-sea mining until there is sufficient scientific evidence that it can proceed without causing serious harm to marine ecosystems.
Rather than wait for the UN process, industry frontrunner, The Metals Company, decided to apply for US permits offered by the Trump administration last year. In May, the US National Oceanic and Atmospheric Administration (NOAA) certified TMC’s application to explore 120,000 square kilometers of sea floor.
The firm wants to mine an area in the Pacific known as the Clarion-Clipperton Zone, which holds critical minerals inside potato-sized rocks found in the deep ocean floor known as polymetallic nodules. The minerals like manganese, nickel and rare earths are used in clean energy technologies like batteries and wind turbines.
But the area is also a little-understood ecosystem inhabited by thousands of unnamed species. The International Union for Conservation of Nature (IUCN), the world’s largest environmental network, says mining this area would threaten the existence of over half of all molluscs reliant on deep-sea vents.

Governments launch inquiry
Seeking to discourage companies from bypassing the UN process, the ISA’s member states unanimously agreed to open an inquiry into whether holders of its exploration licences complied with their contractual obligations under the UN Convention on the Law of the Sea (UNCLOS).
“The stage we’re at now is countries grappling with what they can do about this. What tools do they have to constrain this pathway that would go against international law,” Casson said.
Both NORI and TOML continue to hold ISA exploration contracts in the Clarion-Clipperton Zone. NORI’s license, however, expires later this month on July 21st and is up for review.
The inquiry is currently ongoing, but Casson said that if governments decide to cancel NORI’s license, other firms could apply for the ISA permit and compete for mining rights in the area.
“If that happens, it could really put into jeopardy TMC USA’s application (for US permits) because then suddenly that area could be open for a competing claim,” she explained. “At the moment, TMC is trying to kind of play both sides and shore up the area so that there will be no competition.”
Deep-sea mining firms push back
The cases before ITLOS are the first contentious disputes over deep-sea mining to reach the court designed for maritime disputes and the first brought directly by private contractors against the ISA. Among the companies’ legal advisers is former ISA secretary-general Michael Lodge.
Both NORI and TOML claimed that, unless the inquiry is suspended, there is a “real
and imminent risk of prejudice” that “may have significant legal and practical consequences” for
their activities.
The claim was backed by the Pacific island nation of Nauru, which has sponsored TMC’s push to mine the Clarion-Clipperton Zone and would benefit from the economic activity. The country raised “concerns on the adherence of due process with respect to the treatment of NORI”.
The mining companies allege that the ISA has singled them out among other applicants by requesting additional documentation, and that the UN auditors did not give them an opportunity to “meaningfully respond” to their concerns.
The ISA rejected those allegations as “wholly unsupported assertions”. It added that, given TMC’s application for US mining permits, it had done “what any reasonable regulator would do”: with the unanimous support of member states, it opened an inquiry simply to establish the facts.
Delay tactics
A decision from the maritime court is now expected by July 18, which has added to a “climate of significant regulatory uncertainty”, according to global law firm HSF Kramer.
As ISA countries meet in Kingston this week, the court’s president asked them “not to act in any way that could hinder any order” the court may make.
At the hearing representing the ISA, renowned human rights lawyer Philippe Sands said the deep-sea mining firms were engaging in “strategic litigation” meant to delay the inquiry and send the ISA into a years-long legal process.
“It’s a delaying tactic, and nothing would make them happier than for you to kick this into the long grass for two years while you sort out the merits. That is what they want this Tribunal, the Chamber, to do. You are being instrumentalized in this process,” Sands told the judges.
The post UN seabed regulator defends authority as mining firms seek to halt inquiry appeared first on Climate Home News.
UN seabed regulator defends authority as mining firms seek to halt inquiry
The UK’s incoming prime minister Andy Burnham has remained tight-lipped on his views on climate change during his leadership campaign.
When asked his views on reversing Labour’s manifesto pledge to stop new North Sea drilling in June – a move that the oil-and-gas industry and right-wing media have pushed for in recent months – he said he had “something of an open mind” on the issue.
But a trawl of Burnham’s past comments about climate change, net-zero and fossil fuels reveals a different picture.
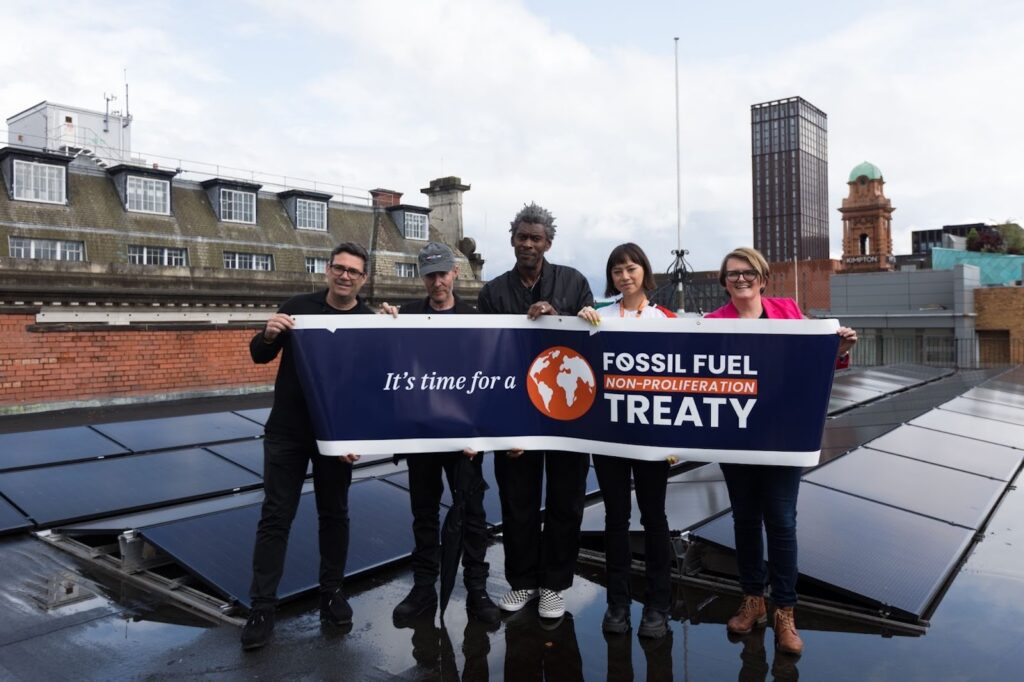
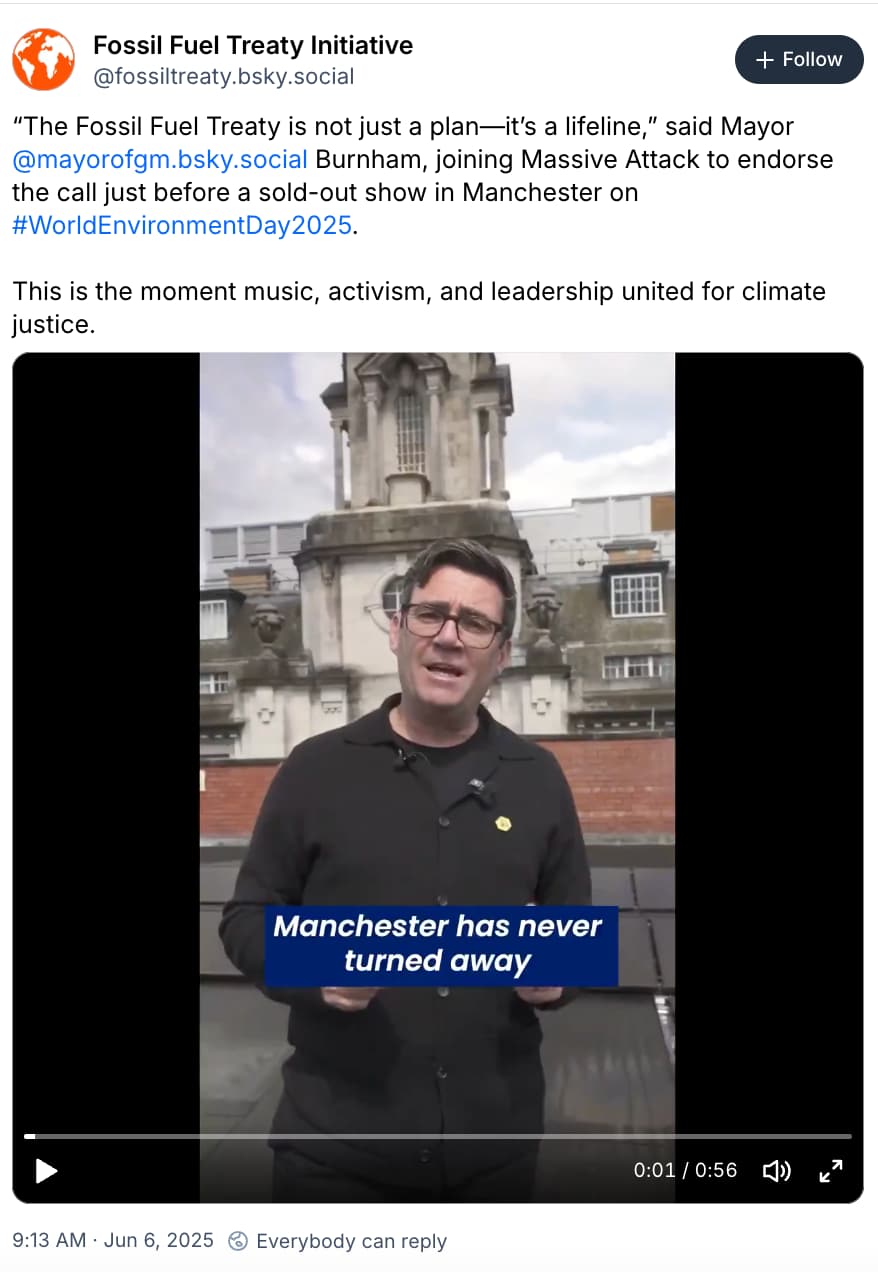
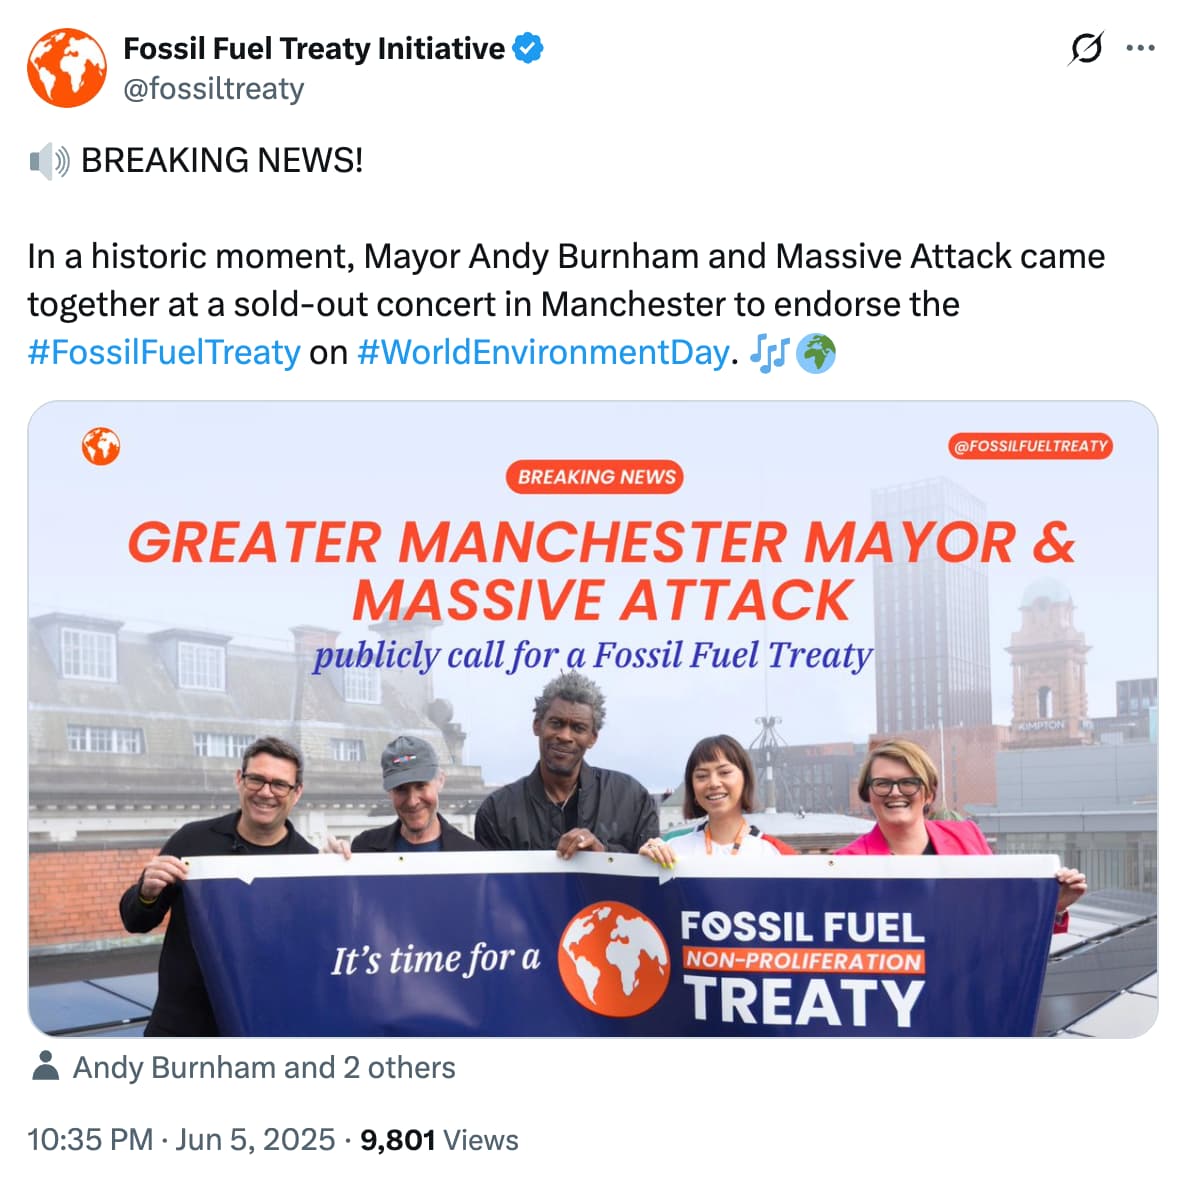
Just a year ago in June 2025, Burnham, while mayor of Greater Manchester, gave his support to the fossil fuel treaty – a proposed international pact on phasing out coal, oil and gas – calling it a “lifeline” that “all governments” should join.
In a video message endorsing the treaty, he also said that “there should be no turning away from net-zero”.
During his last bid to be Labour leader in 2015, he used similar language, saying:
“Labour under my leadership will never turn our back on either our duty to tackle climate change or the prospects offered by the green economy.”
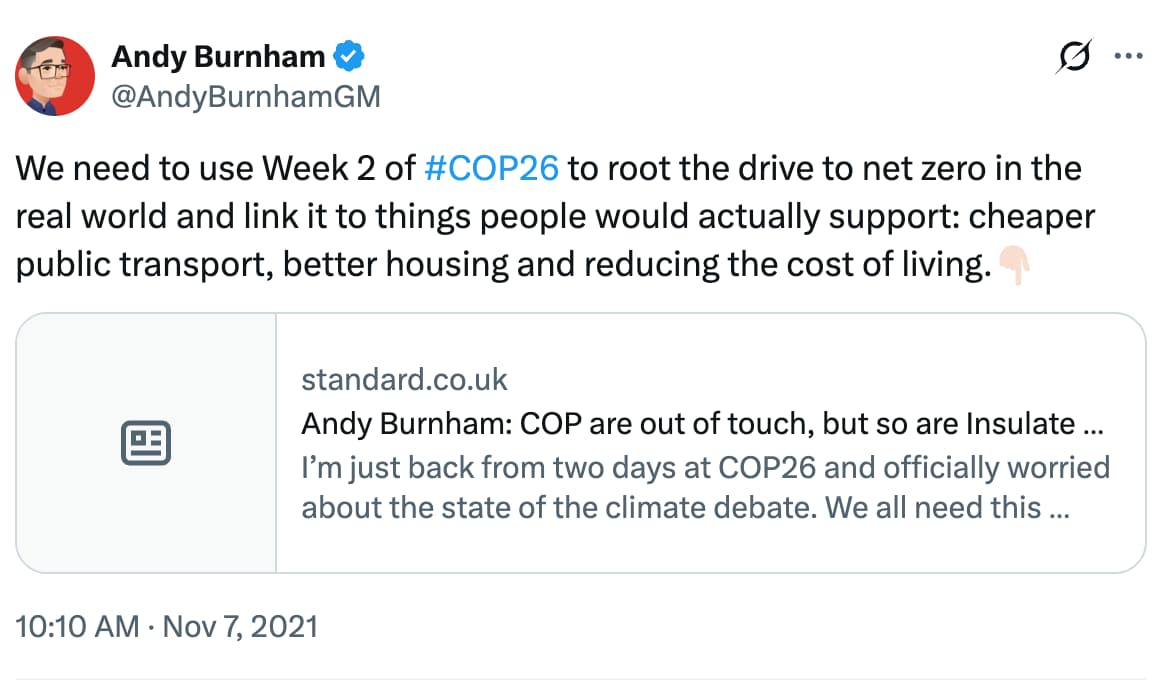
Burnham has spoken about the threat of climate change since at least 2008, noting in 2021 that accelerated action could “create thousands of good jobs”, but also warning that net-zero risked becoming the “next Brexit”.
Burnham is yet to appoint his cabinet, but there is much speculation that he will select current net-zero secretary Ed Miliband as his chancellor – with their ally Miatta Fahnbulleh having a “strong chance” of taking Miliband’s former position.
Below, Carbon Brief recounts 28 things that Burnham has said about climate change, net-zero, fossil fuels, energy and transport.
Climate change
“Tackling climate change isn’t just about protecting the planet – it’s a powerful opportunity to build a fairer, greener future for our communities and businesses.”
Calling for local councils to be given more power and money for climate action, 29 November 2025
“There is little doubt that Greater Manchester’s biodiversity has taken a hit over the years, with habitats being lost, destroyed and becoming less diverse due to the impact of development, climate change, pollution and invasive species…We are committed to delivering a city-region for all residents to enjoy – a fairer, greener and more prosperous place for everyone.”
Statement after Greater Manchester declared a “biodiversity emergency”, 25 March 2022
“Over the next decade, if we accelerate our response to the climate crisis, we can create thousands of good jobs, improve homes, overhaul our transport system and make [Manchester] an even better place to live.”
Greater Manchester Green Summit, 18 October 2021
“The environment has never been higher on the national and international agenda.”
Statement after visiting a peat bog restoration project in England, 9 January 2020
“I think climate change [action] will be driven more quickly from the bottom up, if I’m honest. It’s the will of evolution if you wait for the government to act…When governments aren’t listening you get out and get your voice heard…so I think [climate protesters] deserve our encouragement, not our criticism.”
Speaking to Manchester Evening News at a student climate protest in Manchester, 24 May 2019
“Labour under my leadership will never turn our back on either our duty to tackle climate change or the prospects offered by the green economy.”
Labour leadership candidate speech, 15 July 2015
“Climate change can seem a distant, impersonal threat – in fact the associated costs to health are a very real and present danger…We need well-designed climate change policies that drive health benefits.”
Speaking to the Guardian about a study on climate and health, 25 November 2009
“The Stern report on the economics of climate change has changed the debate, in this country and around the world. It made it clear that the people who could suffer most from a failure to tackle climate change, or from a lack of ambition in our approach to it, are those living in the developing countries. They are the most vulnerable…[and] Stern said that the cost of not acting would be large. That is why the government took various measures in the recent spending review to ensure that we are prepared to face the challenges posed by climate change.”
Speaking in the UK parliament on the economic impacts of climate change on his final day as chief secretary to the Treasury, 24 January 2008
Net-zero
“There should be no turning away from net-zero.”
Speaking after giving his support to the fossil fuel treaty – a proposed global pact to introduce laws to phase out coal, oil and gas – on behalf of Manchester, 6 June 2025
“An opportunity is opening up for Britain as other countries move away from net-zero. We should seize that…We can make Britain a green leader. This is not the time to tiptoe, it is the time to commit to this path.”
Speaking at Innovation Zero World Congress in London, 29 April 2025
“[We] need a government that fully buys into the 2038 vision because the UK will not get to 2050 unless places like Greater Manchester are freed up to go faster – and we’re ready to go faster.”
Speaking about Greater Manchester’s aim to reach net-zero by 2038, 19 October 2022
“In Greater Manchester we have plans to build 30,000 net-zero social rented homes because we recognise that a successful city region needs good quality, affordable accommodation for everyone.”
Speech on the future of cities, 24 June 2022
“By building a broad consensus behind the drive to net-zero, we can ensure that the transition is a fair one that delivers social justice as well as climate justice. This is an opportunity for all of us to show how cutting carbon emissions in our cities can make a real difference to our communities – away from the abstractions and rooted in the real world.”
Panel discussion in Glasgow during the COP26 climate summit, 12 November 2021
“To the extent that people have picked up anything from COP26, it’s a sense that the drive to net-zero will mean cost and inconvenience for ordinary people and offsetting for the wealthy and entitled. All of a sudden, you can feel how net-zero could become the new Brexit – a debate that gets very divided on class grounds…This has got to be a wake-up call. We cannot let this happen. We need to act now to build a broad social consensus behind the drive to net-zero. How to do that? It starts with taking control of the climate narrative from those steering it in the wrong direction and turning it around…We must show how, if done in the right way, the drive to net-zero is actually an opportunity to reduce the cost of living; to make people’s lives better and society fairer.”
Writing for the London Standard, 5 November 2021
“The drive to net-zero is a chance to re-industrialise the north of England, this time in a clean way. Create really good jobs, future-facing jobs for people, better public transport, improve people’s homes…If we go quickly towards net-zero, it’s the quickest way to level up the country.”
ITV interview at COP26, 1 November 2021
“If we really embrace the drive to net-zero, that is the route to level up the country…But it needs substantial investment, upfront, now, of the kind that Rachel Reeves, shadow chancellor [and chancellor under Keir Starmer’s government], has been talking about. We need long-term predictable funding.”
Interview with GB News at COP26, 1 November 2021
“I would have preferred to hear slightly less about carbonated wine and much more about a decarbonised economy.”
Referencing a UK budget, which included tax cuts for sparkling wine and other drinks, 28 October 2021
“Decarbonising is not just about lowering costs on to people. It’s the route to get better, cheaper public transport. It’s the route to getting homes that are cheap to run. It’s actually the way we can create thousands of good jobs for the people who live in Greater Manchester. This is the route to levelling up the country by going further and faster on decarbonisation.”
Speaking to Manchester Confidential, 20 October 2021
“[I am] asking people to stop seeing the environmental agenda as a cost and a burden agenda. I think this is a barrier that we’ve got to get over. Already in the media interviews I’ve done today, people are saying ‘can you afford it?’, ‘can it be achievable when times are tough?’.
“My answer to that is, at some point in the 21st century, all homes will be zero-carbon. At some point in this century, all buildings of any kind will be zero-carbon…All cars will be zero-carbon, all public transport will be zero-carbon…The question is: when? And surely the places that embrace those things first are putting themselves in a position of economic strength when it comes to facing up to the future. Rather than seeing the whole agenda as a burden, we’ve got to see it for the benefits that it can bring.
“There may be a greater upfront cost in a zero-carbon home, but let’s stop thinking, as we tend to do in Britain, of the short-term, the short-termist approach to life. Surely let’s start talking to the public about the lifetime cost.”
Greater Manchester Green Summit, 21 March 2018
Fossil fuels
“I’ve got something of an open mind, you know. I don’t have a sort of fixed position.”
Speaking on the issue of new North Sea oil and gas in a New Statesman interview, 3 June 2026
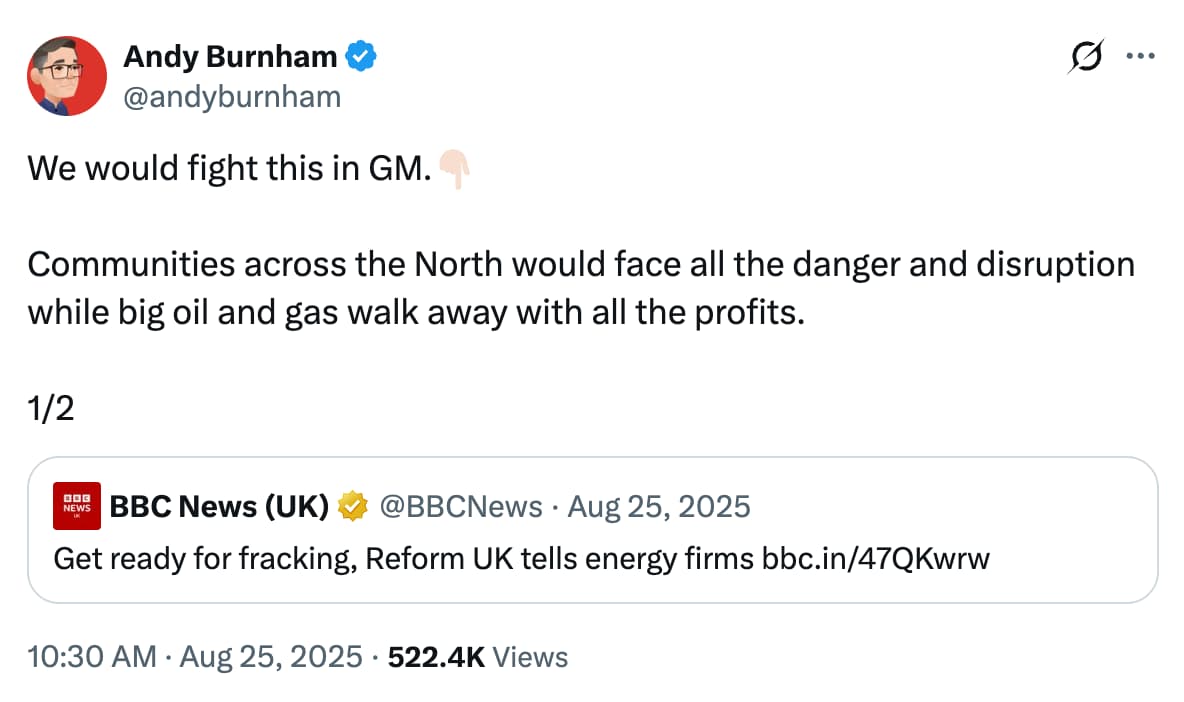
“We would fight this in GM [Greater Manchester]…Communities across the north would face all the danger and disruption while big oil and gas walk away with all the profits.”
In response to Reform’s call for fracking, on X, 25 August 2025
“I am proud to endorse the fossil-fuel treaty proposal today on behalf of Greater Manchester. It’s not just a plan – it’s a lifeline. It’s a call to end coal, oil and gas, hold polluters accountable…I urge all governments, nationals and subnationals to join this fight.”
Statement upon endorsing the fossil-fuel treaty, 5 June 2025
“Fracking is the past, it is not the future.”
Speech at London climate protest, 20 September 2019
“I have called for a moratorium on fracking. Far too many potential risks and unanswered questions.”
On X, 22 June 2015
Energy and transport
“What I would do, if successful, is lay out a plan for more public control over water, energy, transport, so that over the period we can get those bills down, fares down, and give people and give businesses breathing space.”
LBC interview, 2 July 2026
“I am all in favour of tough decisions at a national level. I don’t believe there should be a third runway at Heathrow, for instance. But I think those are decisions for national government.”
Guardian interview, 13 June 2019
“There is a debate to be had about aviation, isn’t there? There are changing public attitudes about aviation. Rather than just saying no to people flying, don’t we need to accelerate research into low and zero-carbon forms of aviation?”
Guardian interview, 13 June 2019
“Today, I stand alongside the mayors of some of the greatest cities in the world. I’m committed to a cleaner, greener and healthier future for Greater Manchester. Around a third of greenhouse gas emissions in our city-region come from transport.”
When signing the C40 Fossil-Fuel-Free Streets Declaration, which includes support for zero-emissions vehicles and walking and cycling, on behalf of Manchester, 14 September 2018


The post 28 quotes from next UK leader Andy Burnham on climate, net-zero and fossil fuels appeared first on Carbon Brief.
28 quotes from next UK leader Andy Burnham on climate, net-zero and fossil fuels
Suresanathan Murugesu is the country director of Action Against Hunger in the Philippines
The Philippines is caught in an extreme weather trap. Here, forecasts for a strong El Niño in the months ahead do not just indicate a period of drought – they also point to torrential rain and flooding.
It could hardly come at a worse time, threatening communities that are still struggling to recover from previous typhoons, such as last year’s Typhoon Tino, as well as two strong earthquakes – in Cebu in September 2025 and last month’s 7.8-magnitude quake in Mindanao.
Forecasts point to the arrival of one of the most intense El Niños in recent history this year and into 2027, with the United Nations warning that it could be the strongest in decades around the world.
The peak of the El Niño is expected towards the end of the year, but the weather phenomenon is already estimated to have caused agricultural losses of nearly €30 million (£25.9 million), potentially affecting the livelihoods of 4 million farmers.
-
Scientists warn El Niño could intensify climate extremes in 2026
Climatologists say a particularly powerful weather pattern could amplify wildfire risk, heatwaves and flooding worldwide as global temperatures continue to rise -
WHO issues new guidance on heat-health action plans, as El Niño sets in
Amid warnings of “unprecedented” weather extremes this year, the World Health Organization urges governments to strengthen protections for vulnerable groups -
Philippines storm victims to seek damages from Shell in “unprecedented” climate claim
The case is the first civil claim to directly link an oil firm’s climate impact to deaths and personal injury in the Global South, its backers say


On the climate frontline
For many, El Niño is a figure in a report or a distant headline, but for those of us who live and work on the ground, it is a reality that is already hitting the most vulnerable families.
When I travel through the communities of the Bangsamoro Autonomous Region – in the south – or speak with families on the island of Siargao or in the Zamboanga region, I do not see data or graphs.
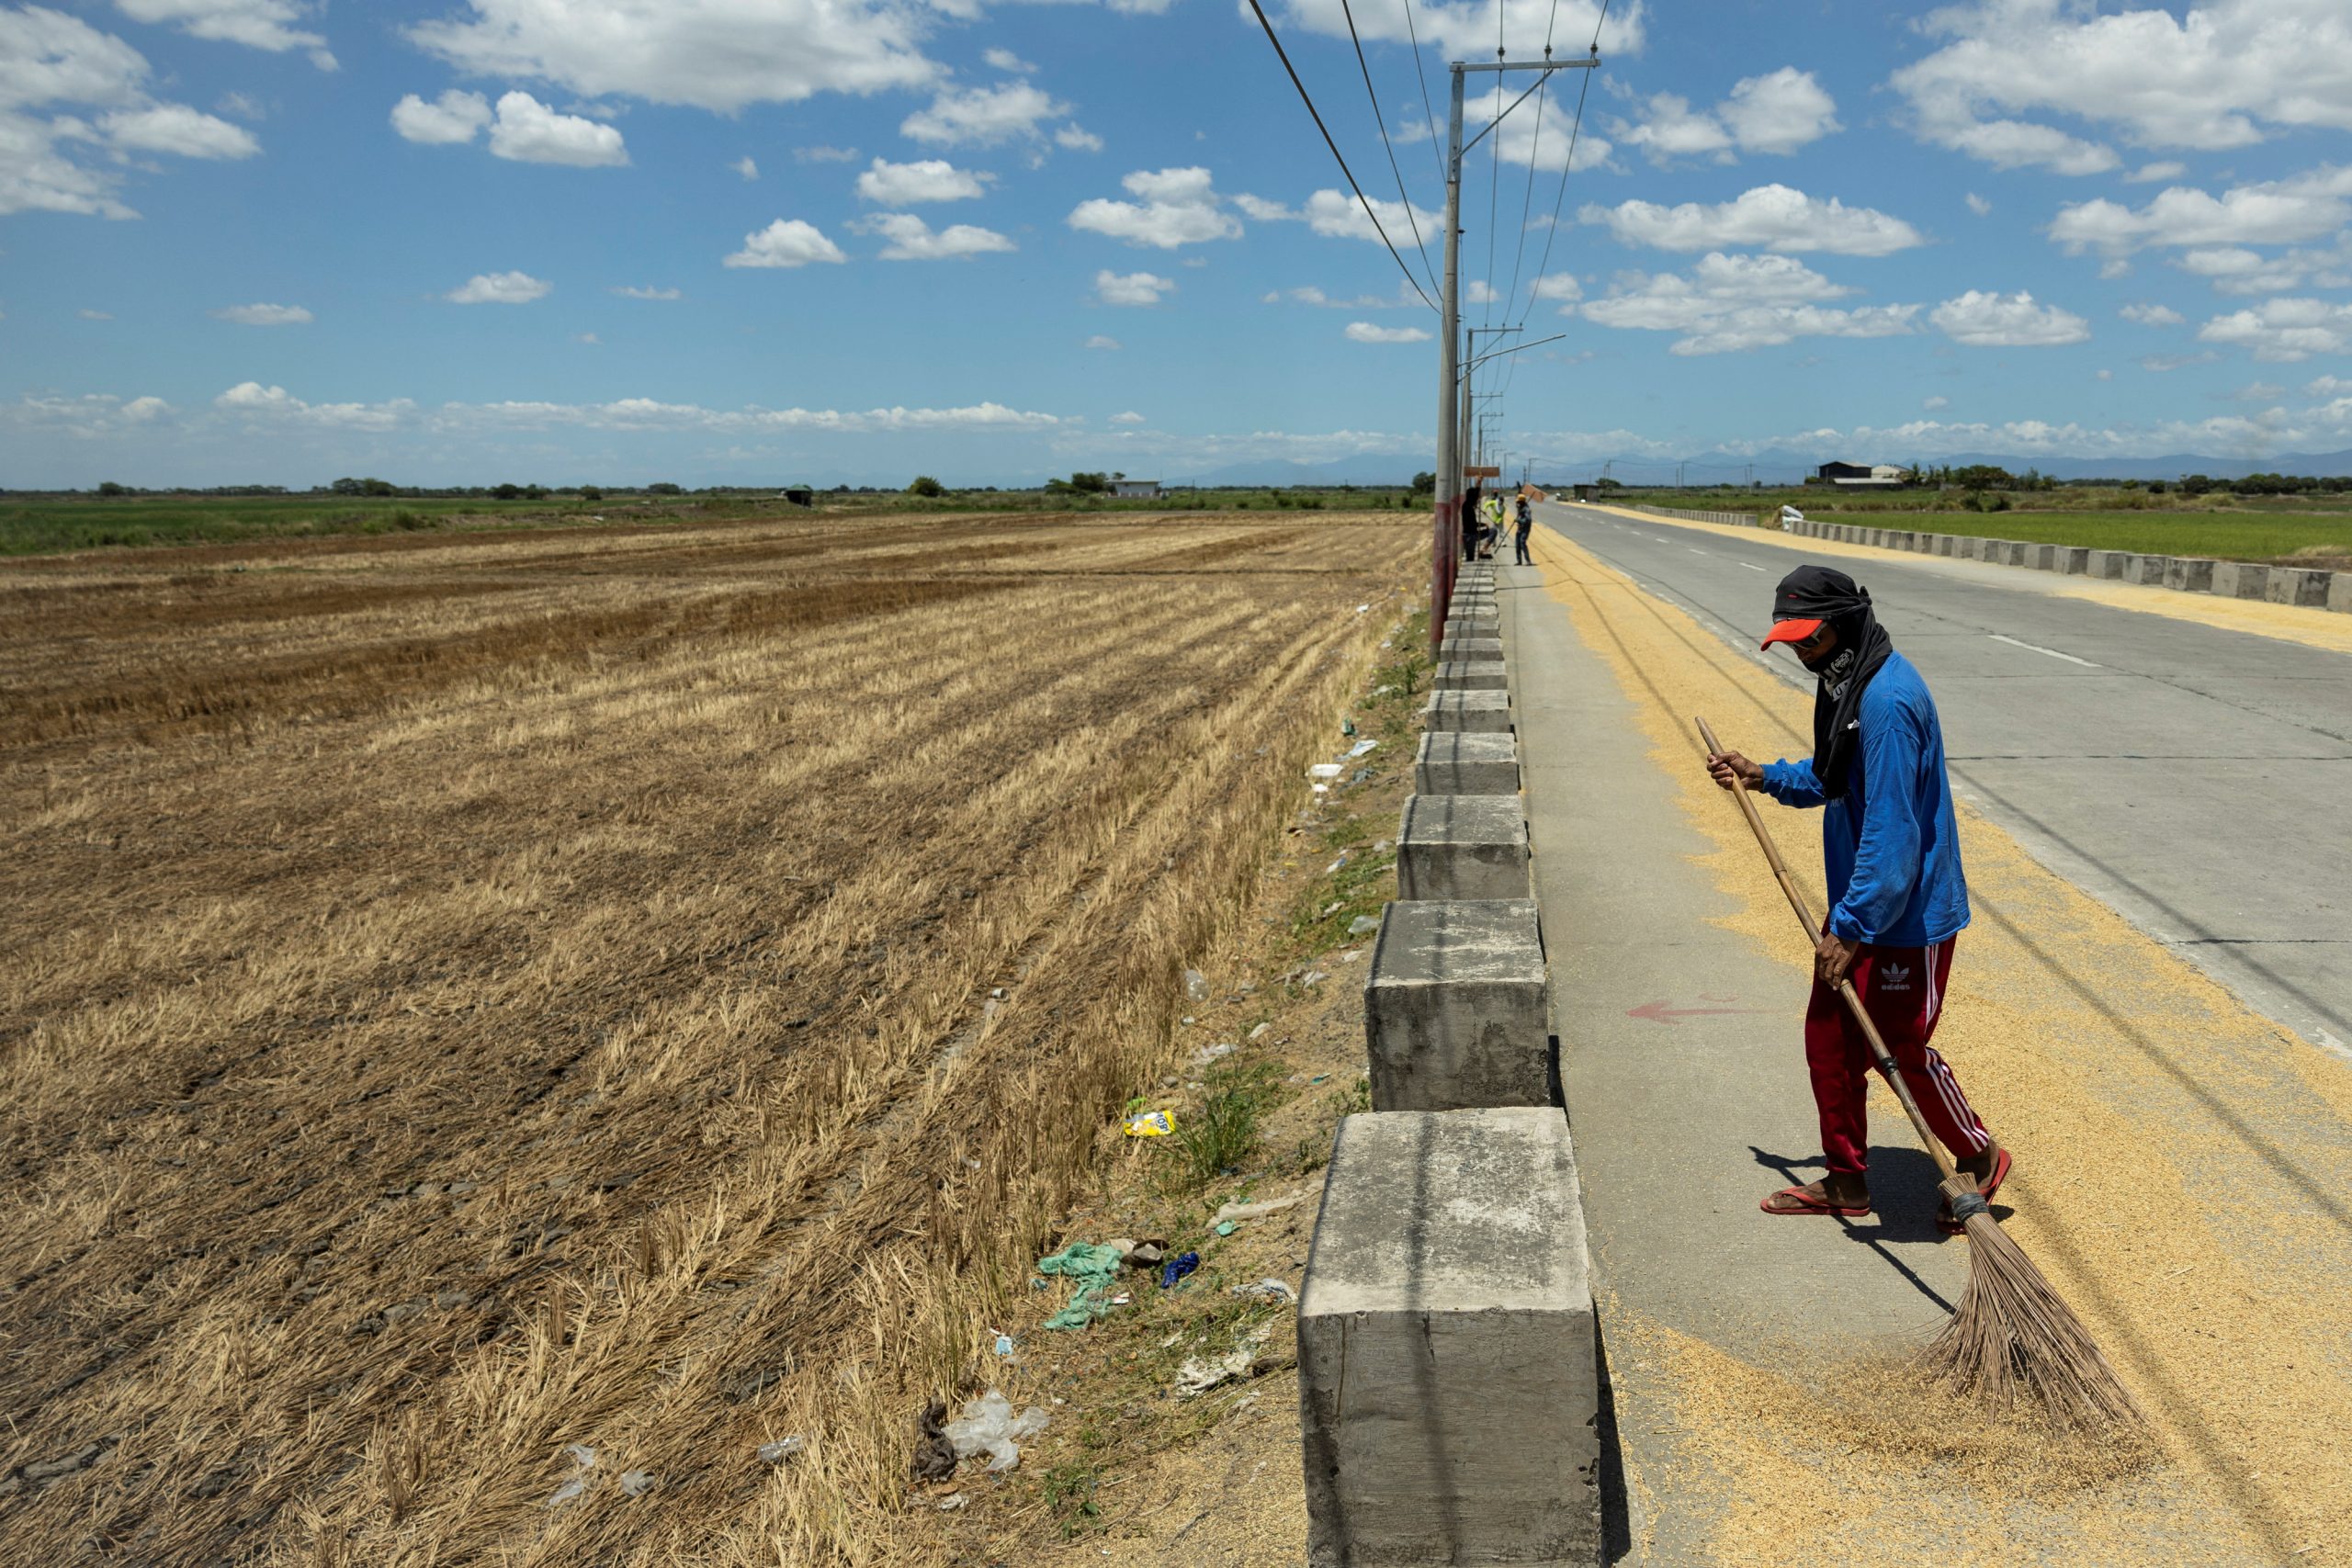
I see a father looking at his cracked rice field, wondering how he will pay off the debts from a harvest that is already lost before it has even begun. I see a mother walking under a relentless sun because her village’s well has dried up, carrying the water that sustains the health of her children and her entire community.
And what we are seeing today – 26 provinces experiencing drought and millions of dollars in agricultural losses – is only the beginning.
Loss and damage fund delays first project approvals as needs dwarf resources
Many Filipino families are still trying to rebuild and recover after last year’s typhoons and the two earthquakes. In Mindanao, where the recent magnitude 7.8 earthquake displaced more than 90,000 people and destroyed over 19,000 houses, uncertainty remains about when the people will be able to fully recover and return home.
Today, they are trying to protect the meagre possessions they have and, if they are lucky enough to have their home unscathed by typhoons and earthquakes, their homes from flooding; tomorrow, they will have to survive the hardship and impact of drought.
The effects of El Niño threaten to exacerbate their troubles.
Struggle for basic needs
Many low-income Filipino families already face significant challenges to meet their basic needs.
In our daily visits, we see how life is becoming increasingly difficult for millions of people. Rising fuel and transport costs are driving up the price of basic foodstuffs, making them unaffordable for many families. At the same time, crop failures and income losses are leaving households without livelihoods, while disasters contribute to further suffering.
But we are not just talking about hunger. We are talking about health, safety and dignity. Water shortages are forcing many people to resort to unsafe sources, increasing the risk of disease. And, as is the case in so many crises, it is the most vulnerable who bear the heaviest burden: walking long distances every day to fetch water or food, enduring enormous physical strain and facing risks of violence and insecurity.
Building resilience
Faced with this reality, our response is based on a simple idea: to be there before the crisis reaches its most critical point. At Action Against Hunger, we work alongside communities to anticipate the situation, assessing the impact of the drought and activating early response mechanisms to protect their livelihoods and access to water.
We translate climate forecasts into concrete action plans: from support for farmers to programmes ensuring safe water. All of this is done in coordination with local authorities and international partners, because we know that what we do today will make the difference tomorrow.
The hardest months are yet to come. But the question is not just what will happen, but what we are doing now to prevent it. How many tables will remain empty and how many children will see their health compromised will depend on our ability to act in time.
We cannot stop El Niño. But we can prevent it from becoming a crisis of human dignity. We cannot afford to look the other way whilst the earth cracks and opportunities disappear. Because behind every statistic, there is a family struggling to get by. And that is a reality we cannot ignore.
The post A strong El Niño spells more climate pain for the Philippines appeared first on Climate Home News.
A strong El Niño spells more climate pain for the Philippines


-
Greenhouse Gases11 months ago
Guest post: Why China is still building new coal – and when it might stop
-
Climate Change11 months ago
Guest post: Why China is still building new coal – and when it might stop
-

 Greenhouse Gases2 years ago
嘉宾来稿:满足中国增长的用电需求 光伏加储能“比新建煤电更实惠”
-

 Climate Change2 years ago
嘉宾来稿:满足中国增长的用电需求 光伏加储能“比新建煤电更实惠”
-
Climate Change2 years ago
Bill Discounting Climate Change in Florida’s Energy Policy Awaits DeSantis’ Approval
-

 Renewable Energy9 months ago
Sending Progressive Philanthropist George Soros to Prison?
-

 Carbon Footprint2 years ago
US SEC’s Climate Disclosure Rules Spur Renewed Interest in Carbon Credits
-
Greenhouse Gases12 months ago
嘉宾来稿:探究火山喷发如何影响气候预测