
This post is the last blog of the GAME 2025 project. Unfortunately, it was delayed by several months (the project ended in December 2025), but it was not forgotten. Read now about the extraordinary and dramatic experiences that Andrea and Sarah made in Cabo Verde in 2025.
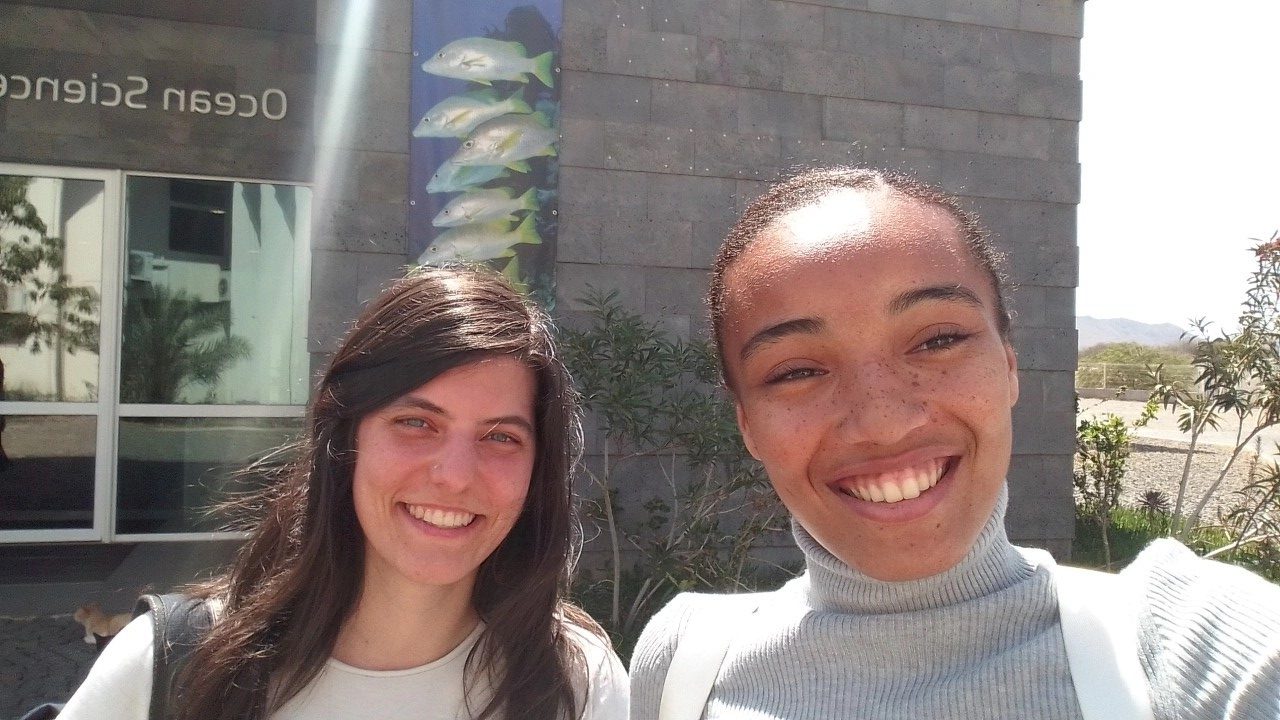
In April 2025, GAME returned once again to the islands of Cabo Verde, this time with Andrea (Technical University of the Atlantic, Cabo Verde) and Sarah (University of Potsdam, Germany). As in previous years, we were exploring the influence of artificial light at night (ALAN) on coastal organisms. The project in 2025 was supposed to bring more knowledge about its influence on the growth of marine epiphytes.
Cabo Verde comprises 10 main islands and a few islets, which are lined up in an arc in the Northern Atlantic. The archipelago was formed by underwater volcanoes that started to emerge from the depths of the ocean about 20 million years ago. The islands are characterized by a dry landscape that has arid and poorly permeable soils, which are almost infertile, and by rainfalls that do not appear every year. Hence, the inhabitants of the archipelago always found their greatest wealth in the sea. As the westernmost African country, its isolation has led to the evolution of marine species that are unique to the islands, while other species that arrived from elsewhere found favourable conditions here. As a relatively young nation, Cabo Verde has yet to explore much of its biodiversity, as well as the marine ecosystems in its waters. Partnerships between Cabo Verde and Germany, which result in projects such as the one we are participating in in the framework of GAME, are always celebrated as they contribute to the scientific enrichment of the country.
Our project was conducted in collaboration with the OSCM (Ocean Science Center Mindelo). The center is, on the one hand, linked to GEOMAR (GEOMAR Helmholtz Centre for Ocean Research Kiel) in Germany and, on the other hand, to IMar (Instituto do Mar) in Cabo Verde. It is dedicated to oceanographic observations and research, and also acts as a connection point for common research activities and the exchange between international scientific institutions. Laboratory work can, for instance, be carried out by using the center facilities and the available equipment. Our experiment, however, was conducted in the field, because of the need for a constant supply with seaweed spores that mediated the colonization of the substrates we provided by epiphytes.
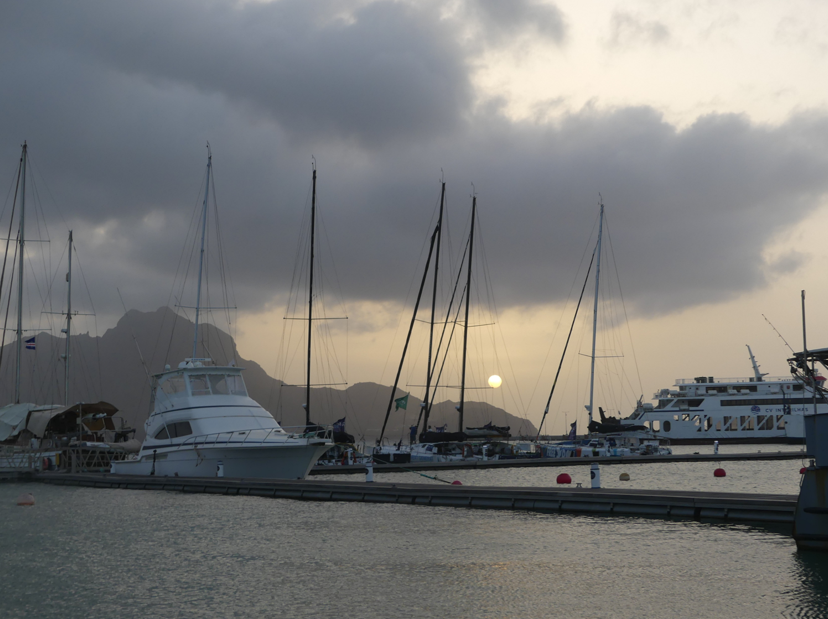
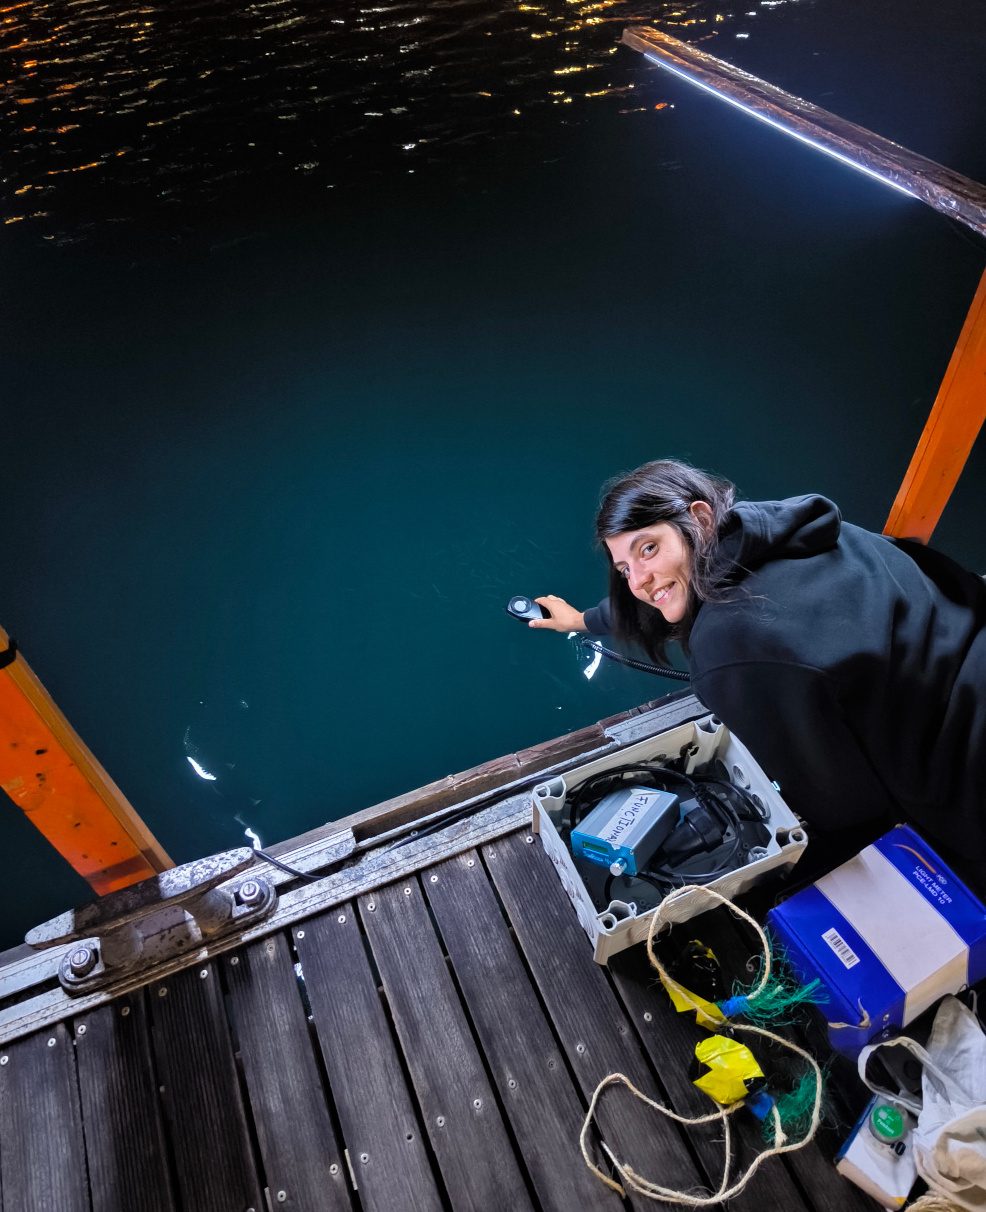
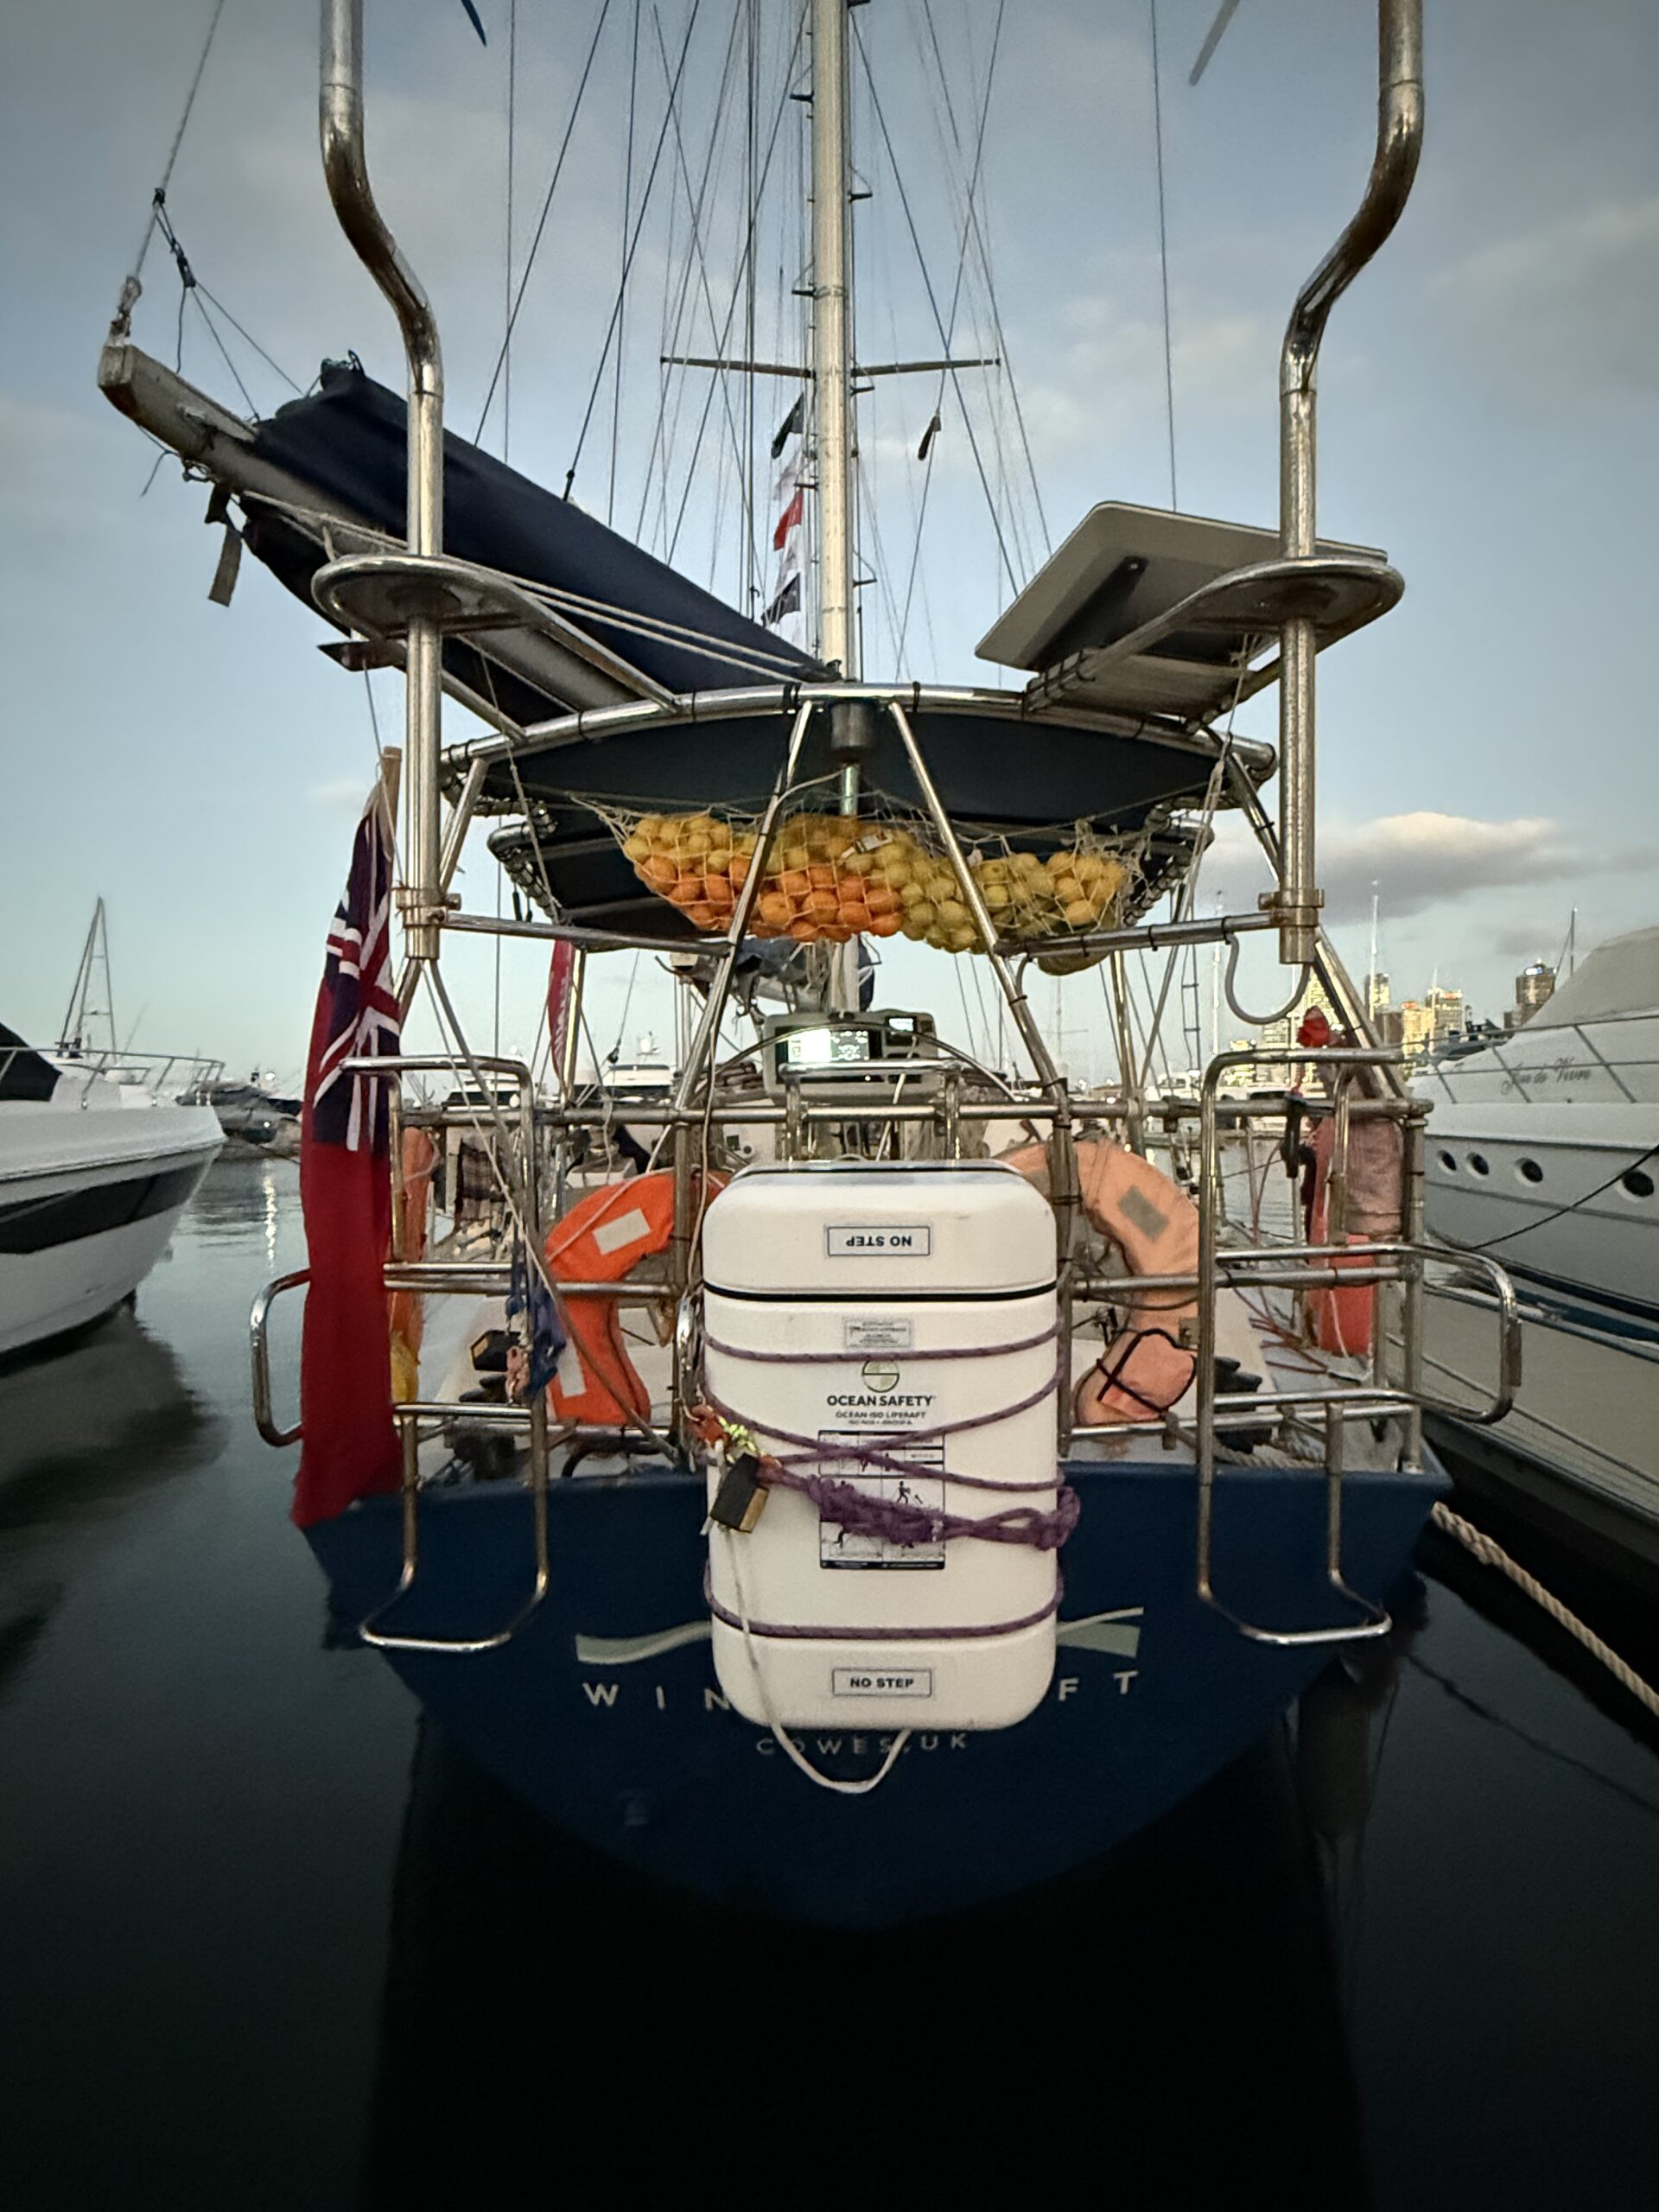
To meet the specific requirements of our study, Porto Grande Bay, more specifically the Mindelo Marina, was chosen as the study site. As its name suggests, this bay is one of the largest in Cabo Verde, and it is located in the northwest of the island of São Vicente. Its calm and shallow waters made it the ideal site for the study we were planning. Except for the intense sun and very strong wind that we felt during the first months of our field work, the place was one of the most interesting and dynamic ones in Mindelo. We spent our days on pontoon B, in front of the Marina Bistro bar, working from morning to night.
In the mornings, we could smell the aroma of stewed “catchupa” and of the seafood that was served there. In the afternoons, the atmosphere was enlivened by the most famous pop songs played at the Ponte d’Água Hotel. Whenever a familiar song came on, we couldn’t resist singing along: “Kiss me hard before you go, Summertime sadness…” At dawn, everything then became calmer. The water was still, and under the lights of the pier, fish swam in circles and created a silent spectacle. Furthermore, in the months before the nesting season in Cabo Verde, it was common to see sea turtles coming to the surface to breathe. Unfortunately, they were so fast that it was almost impossible to get a photo. So fast that Sarah rarely managed to see them. If it were a game, the score would be: Cabo Verde 7 x 1 Germany.
During our work, we met people, both local and from other countries, who were friendly and willing to help, whether with a screwdriver, a tape measure, or a kayak. They were teaching us how to tie a knot, they took photos and videos of us, were giving us ideas and suggestions, or simply provided us company. However, there were also plenty of curious onlookers, mainly elderly tourists who came from the bar-bistro over to the pier, and were interested in what we were doing.
We started our work with one of the biggest challenges of the project: finding a macroalga that could be suitable for the experiment. This alga would needed to have a leathery texture, a flat and broad surface, and should inhabit the subtidal. This was no easy task for us, because although Cabo Verde has a rich marine biodiversity, the biomass of macroalgal species is limited by the nutrient deficiency in the oligotrophic waters of the archipelago. Hence, macroalgae can only be found in small quantities. Furthermore, as it is a tropical country, this task was further complicated by the fact that the waters are warm and shallow, and such conditions mainly favour encrusting and filamentous macroalgae. We began our endeavor by searching online for inventory lists of marine macroalgae on the island of São Vicente, but this was without success. We then invested in more practical approaches, such as diving and snorkeling. We went to the Laginha Coral Cove accompanied by Professor Guilherme, who is a marine biology enthusiast. There, we found two species of macroalgae, both potentially invasive and possibly belonging to the genus Grateloupia, which were qualified to serve as “living substrates” in our experiment.
We collected several specimens of the two species to hang them into the harbour in Mindelo for a pilot study. This was to test if epiphytes would settle on the macroalgae and whether the macroalgae themselves would survive the conditions in the harbour.
Both species made it into the final round. One of them had the perfect shape, but it was far too rare for our needs, while the other candidate was much more abundant. So, we focused on the second one. A further problem we faced was that the macroalgae we worked with had not been scientifically described for Cabo Verde. This meant that there was no literature that we could have consulted to learn about morphological or physiological traits. Furthermore, we had no idea how the algae would performed at different water depths or during low tide when exposed to air.
After some weeks, however, it became clear that our chosen species were rather trapping sediment on their surface than hosting a healthy community of epiphytes. Actually, even under the microscope, sediment and epiphytes were almost impossible to separate. Our supervisor, Corrine Almeida, suspected that the algae’s branched structure made it a natural sediment trap and this was not ideal for our purposes.
Given the high sediment load and the generally murky water in the harbour, we realized that we needed a new plan. We revisited the idea of using our first, more promising species, but after extensive searching, we had to admit that there simply were not enough specimens.
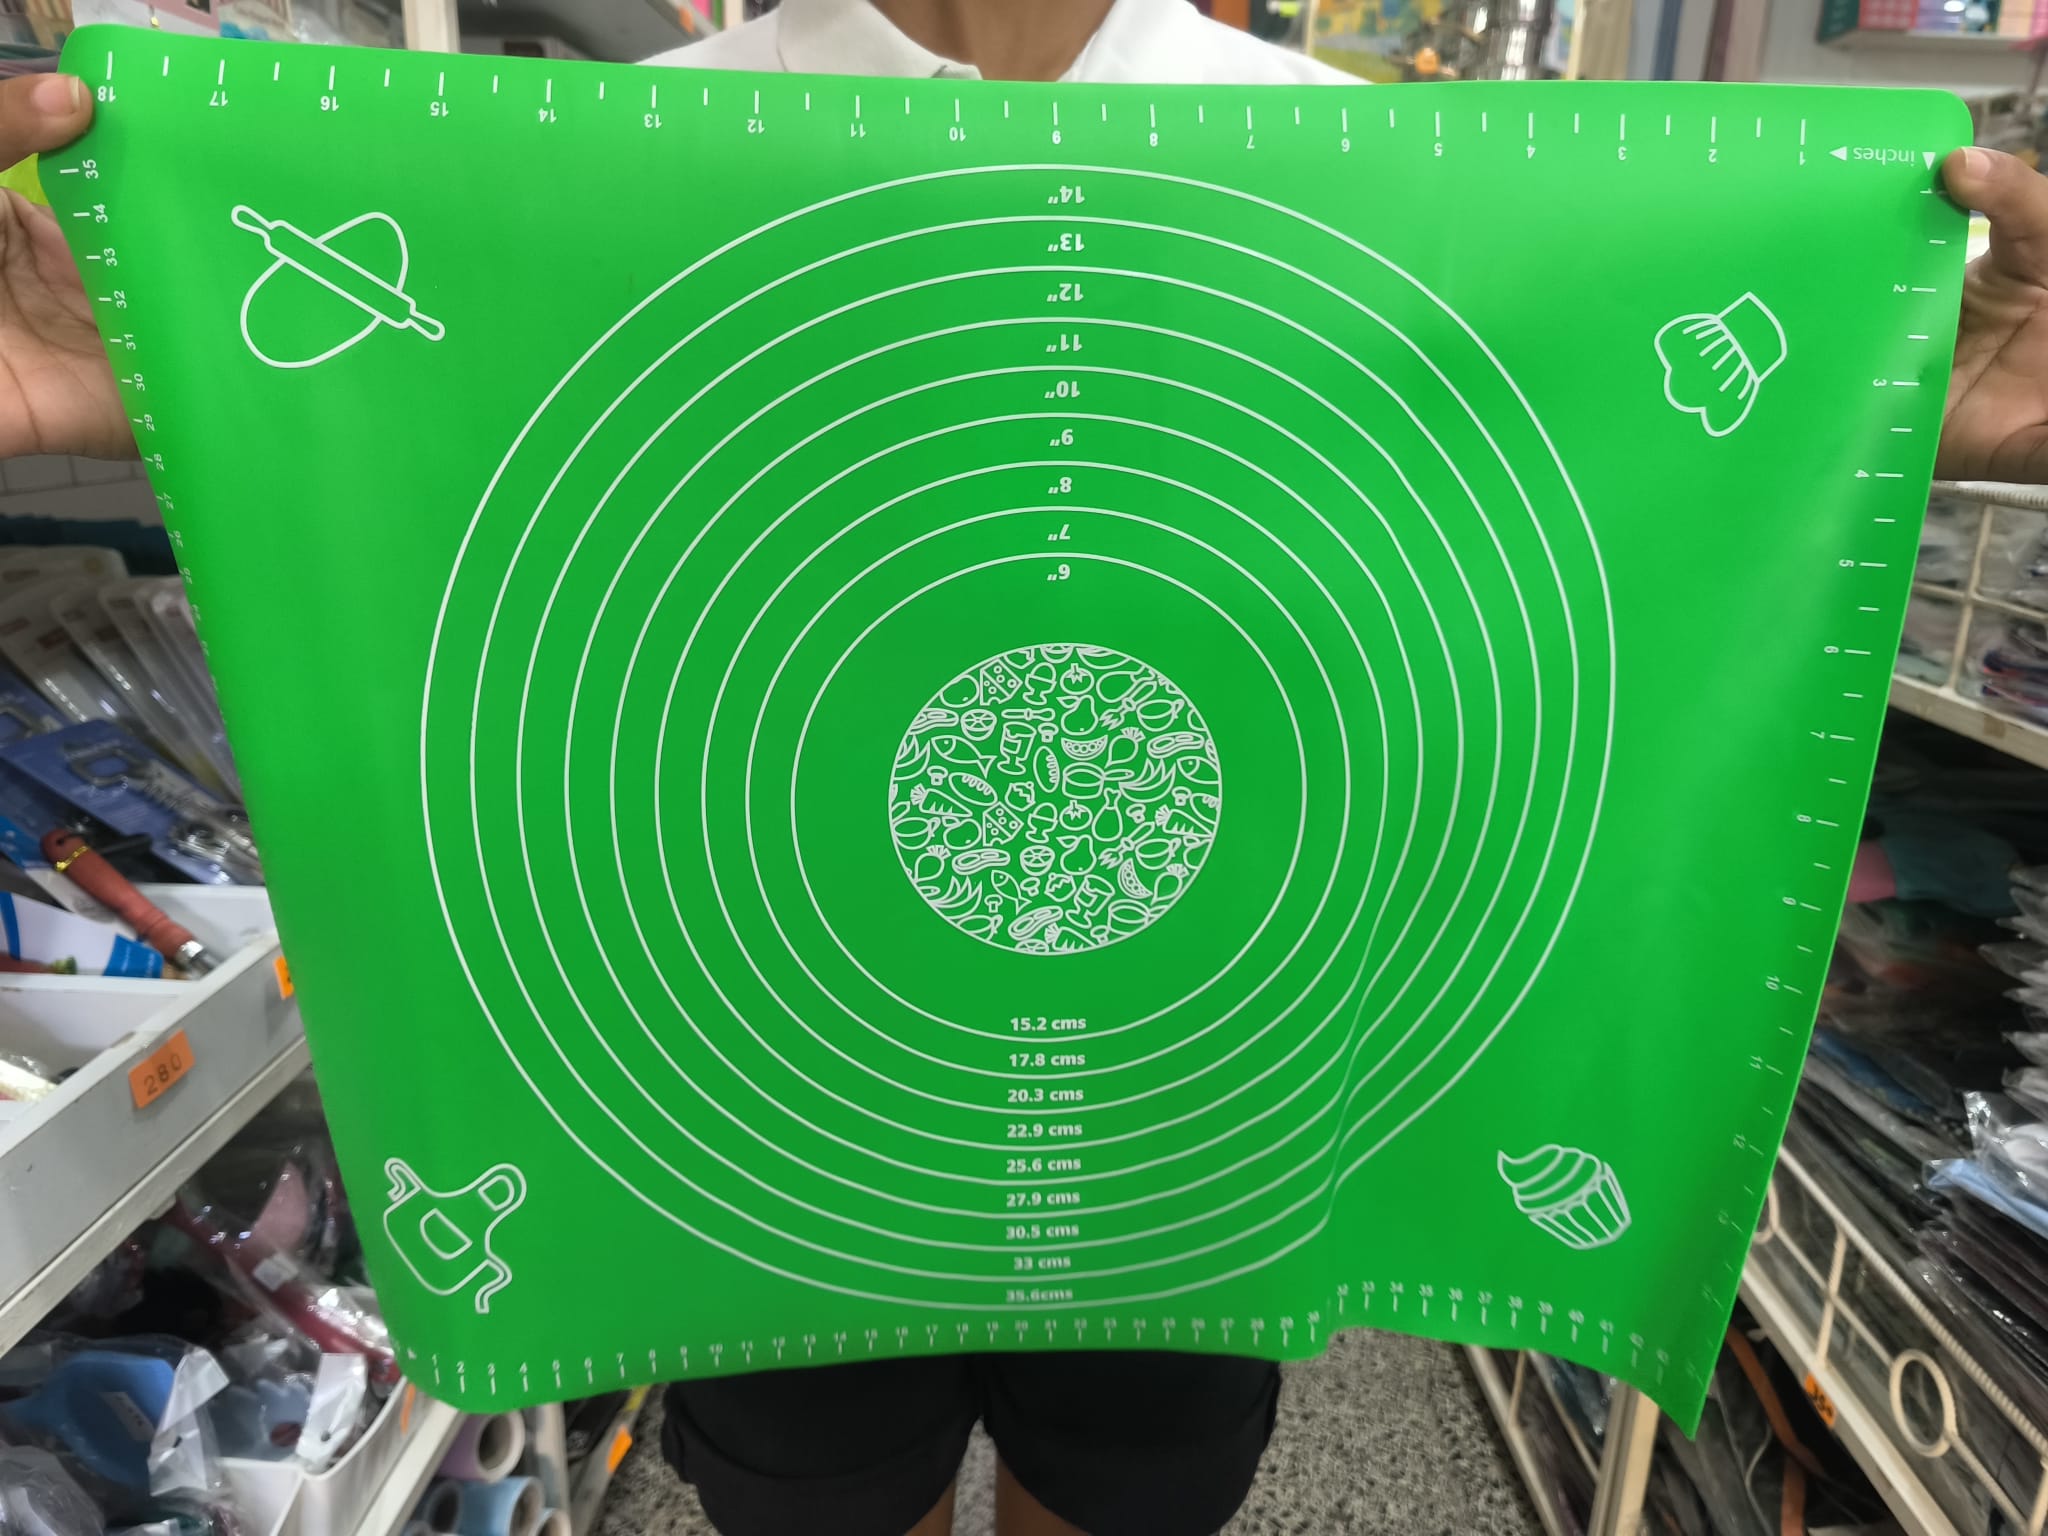
Due to this problem, we were unable to continue with the experiment, but the GAME programme coordinator, Mark, came up with a suggestion. The idea was to replace the living substrate with an artificial material that could, at least partly, simulate the traits of macroalgae, such as a flexible structure. Initially, we thought of using PVC tarpaulin, but this material has high chemical concentrations, which could affect the attachment of epiphytes. We continued searching in Mindelo until we finally found a silicone cooking mat in a Chinese store. The material was thin and malleable, requiring only to be soaked in drinking water for a few days to make its surface rougher. We bought eight green ones, which, after soaking, were cut into pieces that had the same size as the PVC plates.
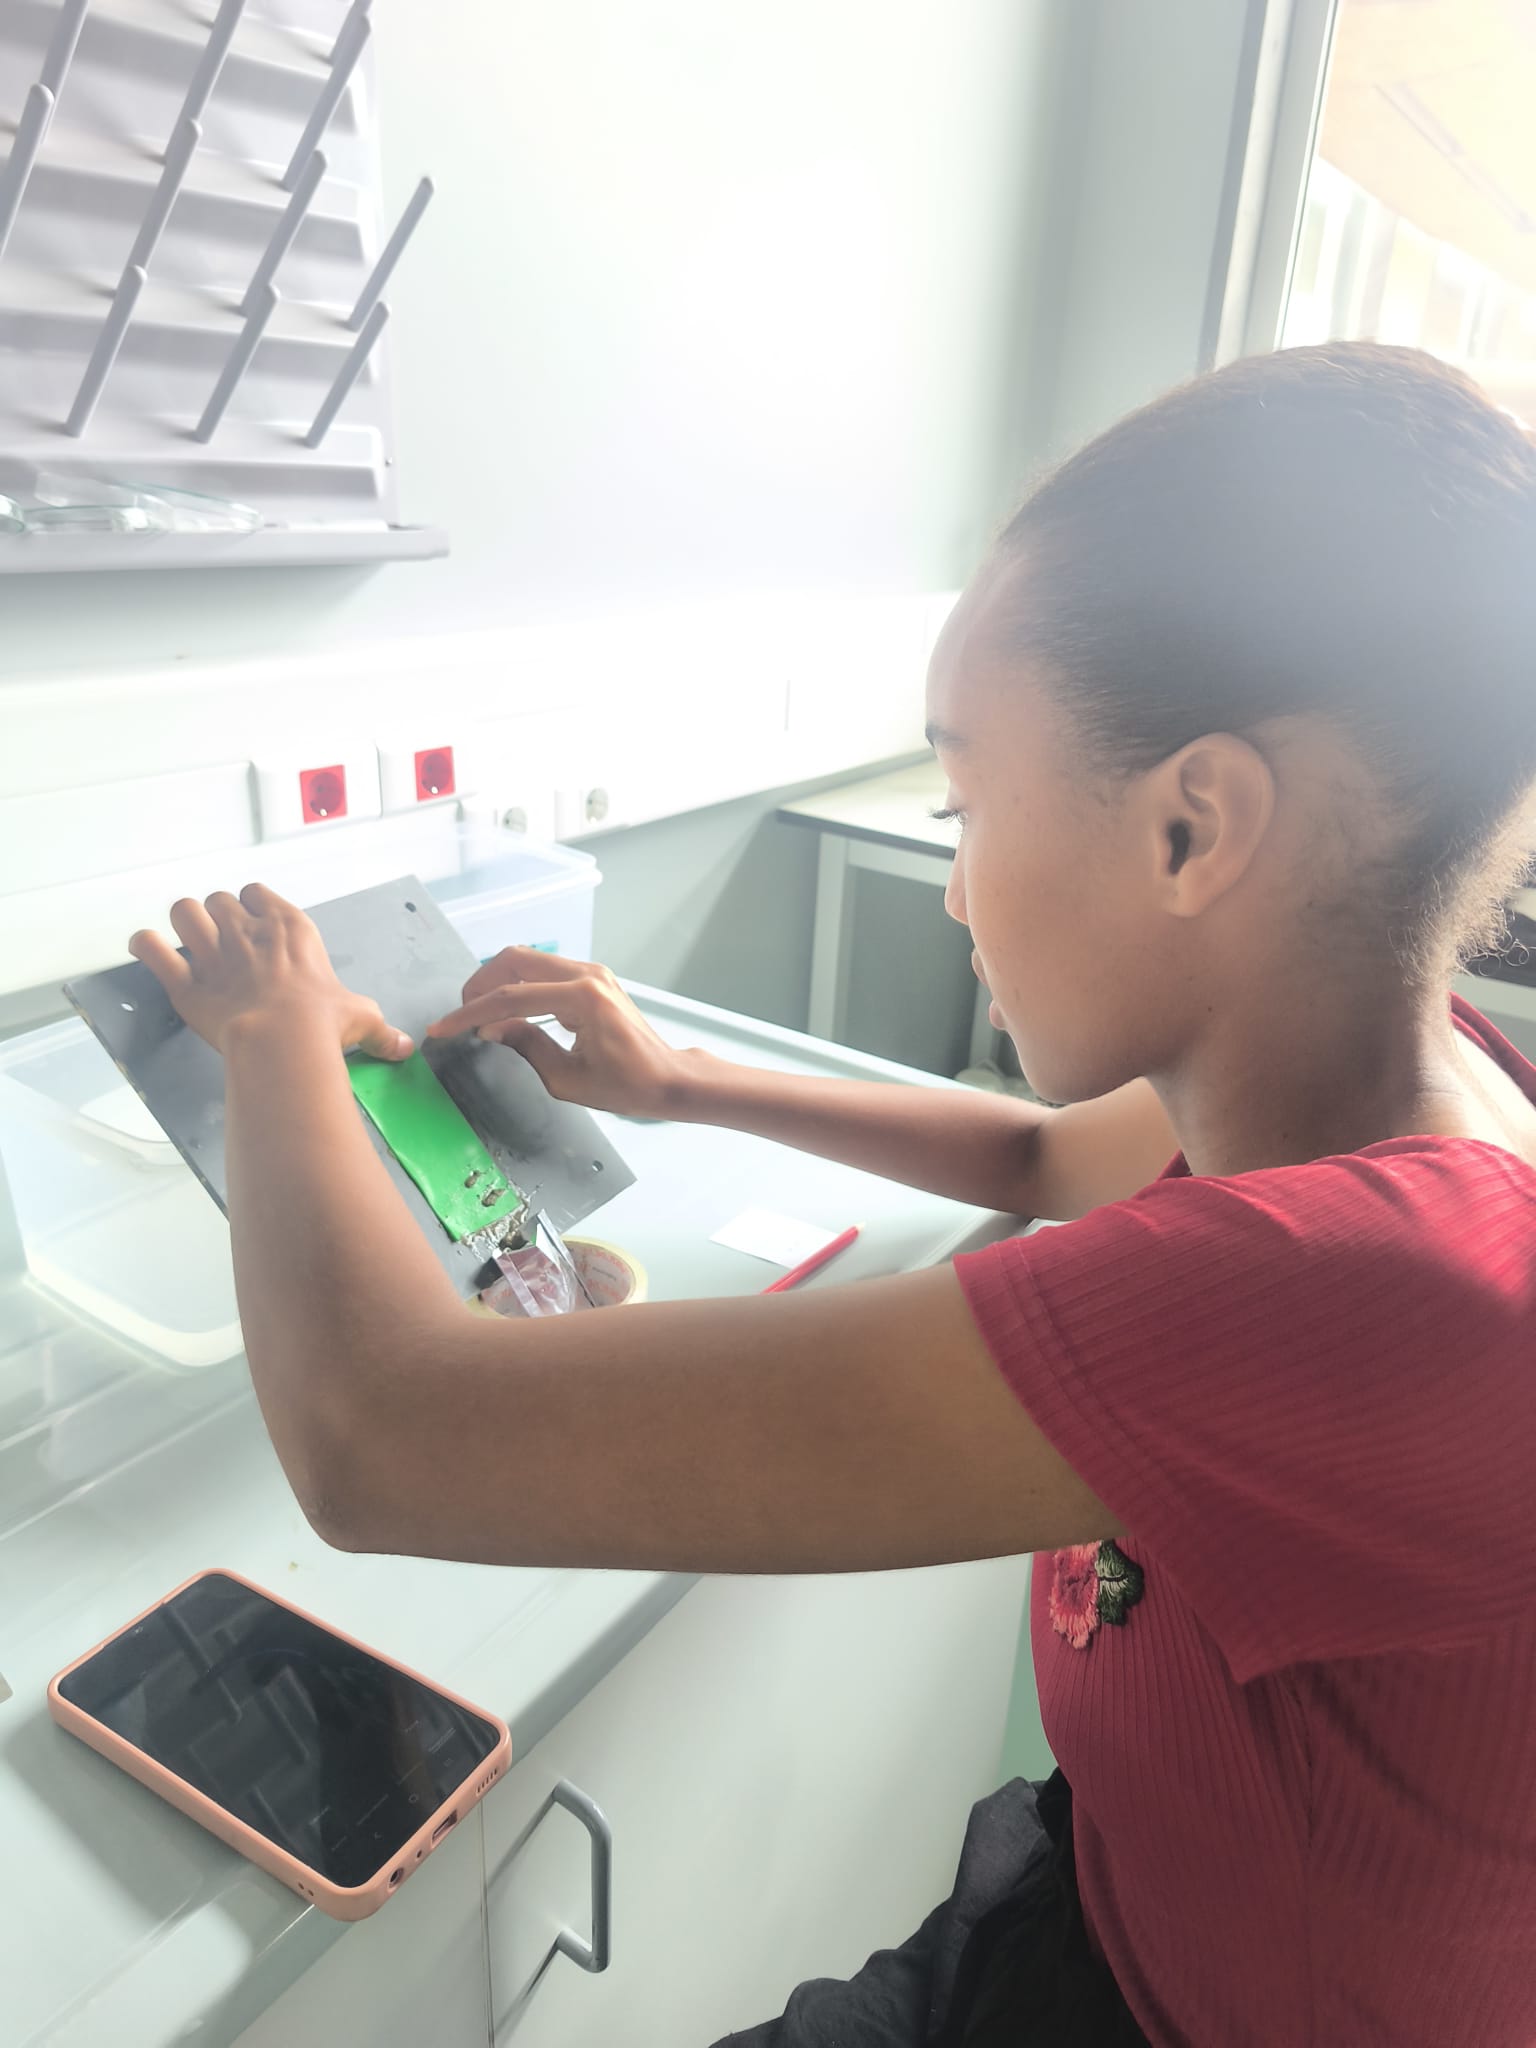
For building the set up, we unpacked some materials that were left behind at OSCM by previous GAME teams, tested the LEDs, and cleaned the frames. One frame needed patching, while we built another one from the scratch. Mindelo does not have a giant all-in-one hardware store like the ones you can find in Germany – instead, you need to visit several smaller shops, while explaining every time at the counter what excatly you need. If they do not have it, they’ll usually send you to another store that might have it. After a few visits, the shopkeepers start to recognize you and let you rummage around in their storage rooms to find suitable alternatives.
We brought PVC panels from Germany and hand-cut them into 5 × 12 cm pieces. For the frames, we glued PVC pipes together and used thin ropes to create the inner structure. The panels were then attached to the ropes with cable ties, while the fake algae were sewed onto them with needle and thread.
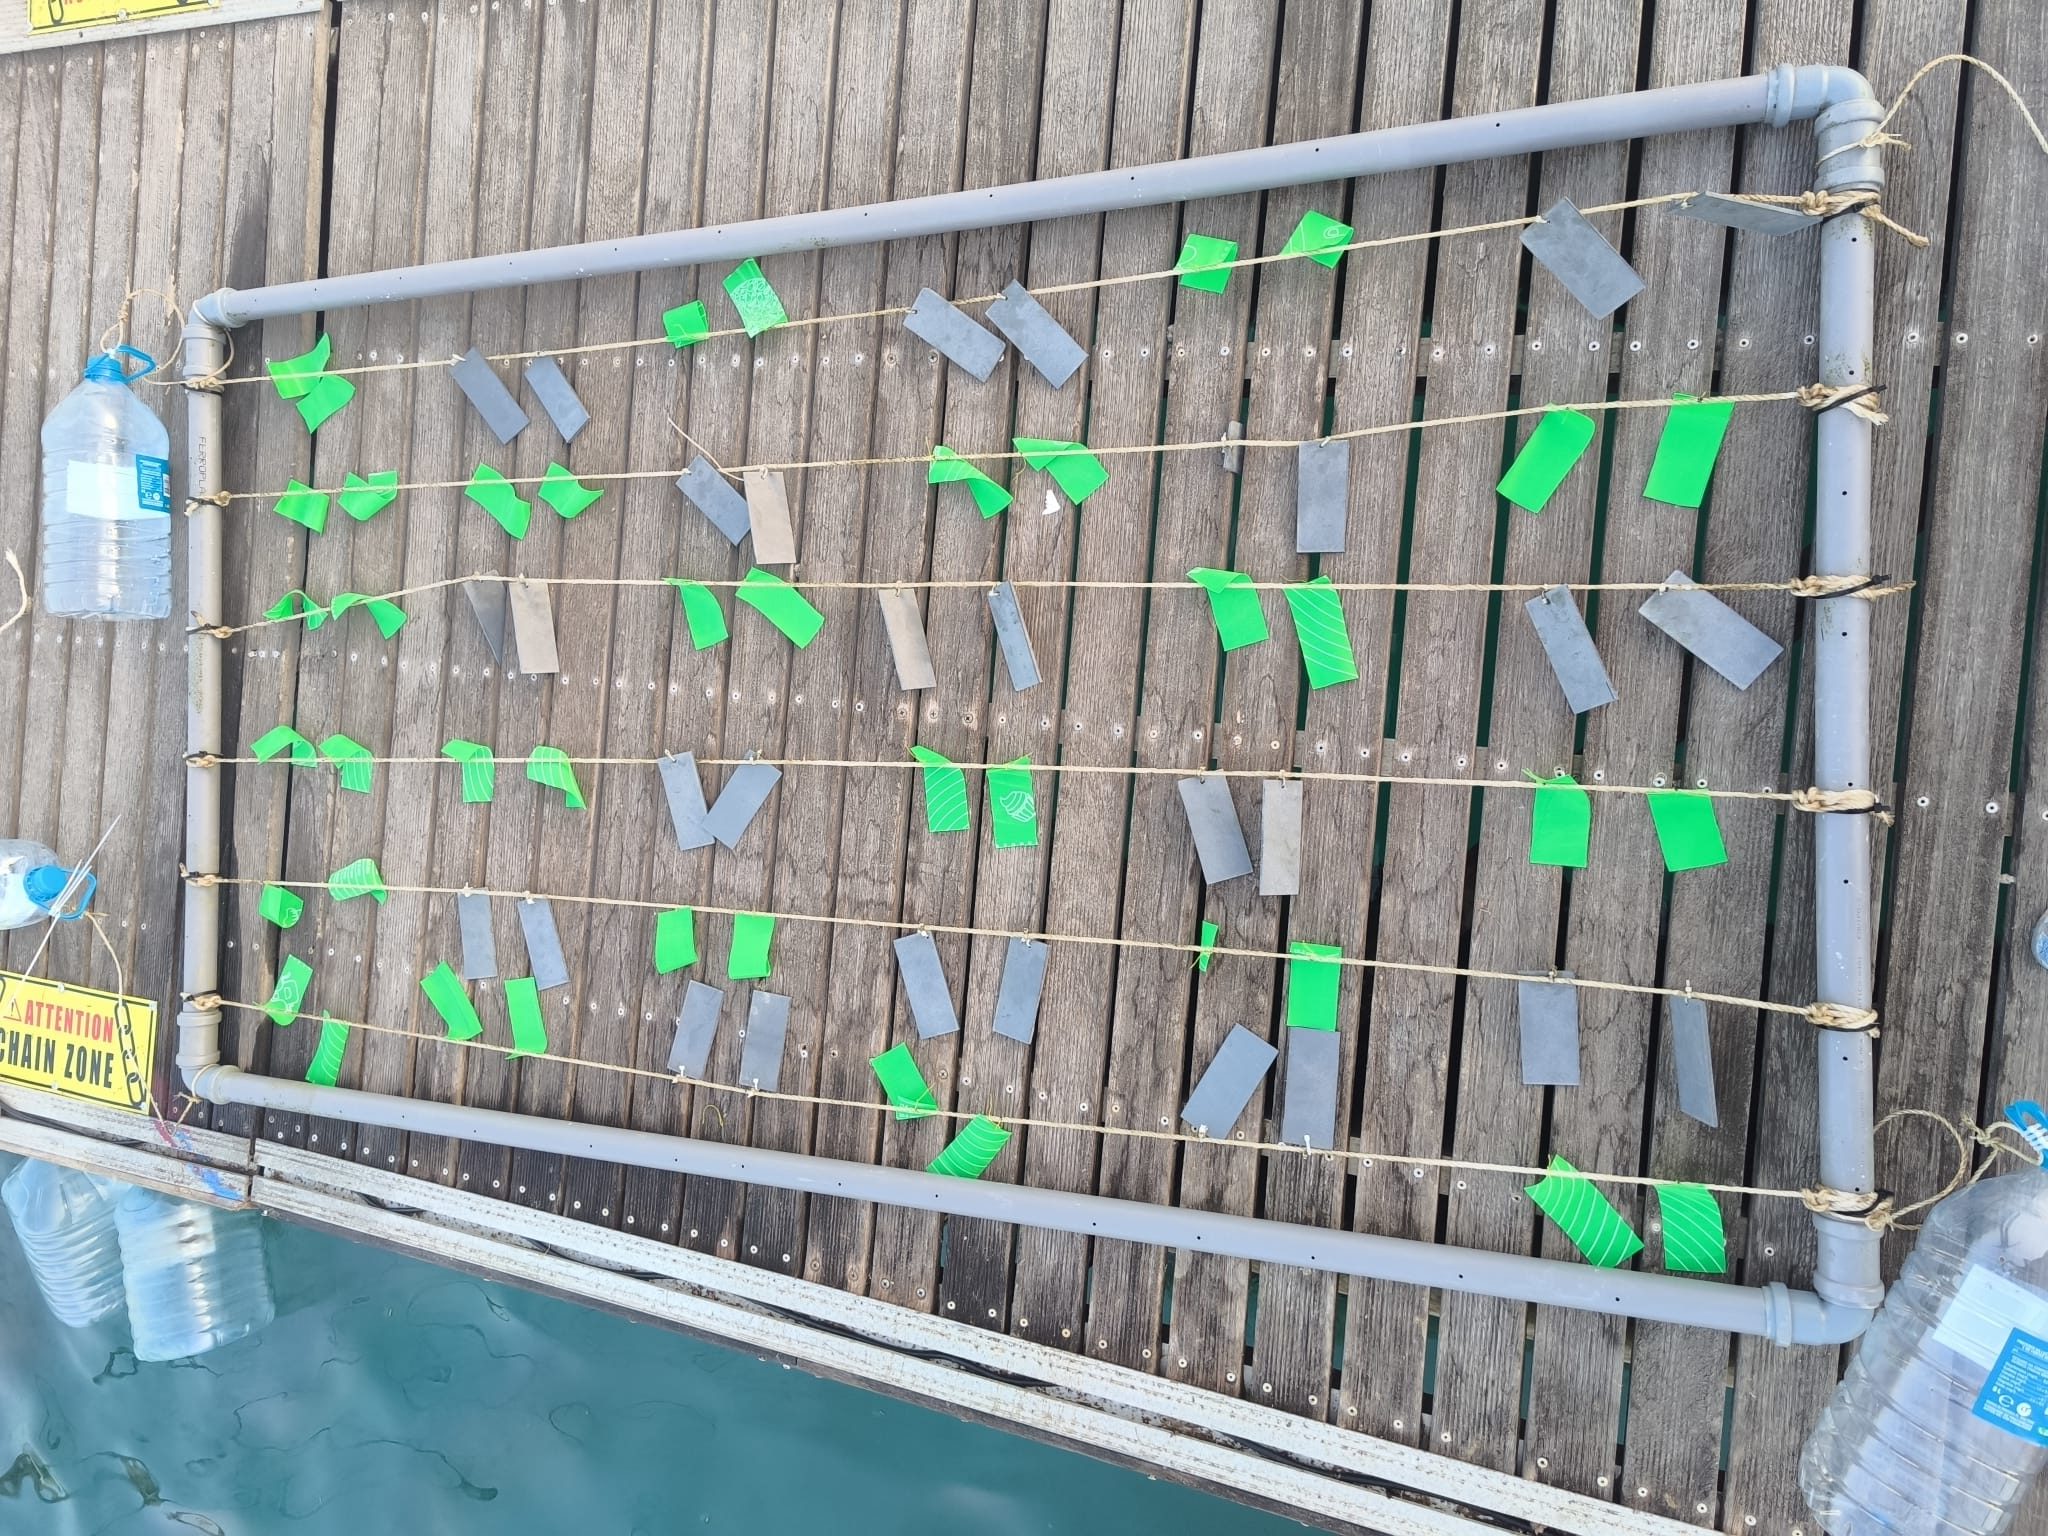
We then installed the lighting system with the help of Eder, who is a technician at OSCM. All electronics were kept in waterproof dry boxes, and we built wooden arms with metal brackets to hold them in their place on the pontoon. We aimed to create similar light fields for both of our frames: Andrea’s with an intensity of 10–20 lux, while Sarah’s had 20–30 lux. After some trial and error, we managed to tune the LEDs perfectly.
However, the real challenge in June was not the construction – it was the wind. With daily gusts of 25–40 km/h, anything lightweight was instantly blown away and we are proud to say that we only lost one measuring tape to the sea. Along the way, we pulled plenty of harbour trash from the water, but also some unusual finds – like a fully inflated unicorn float. We even managed to recover the lid of our dry box from the seafloor, along with a couple of our caps. Hats, in fact, did not stand a chance in the winds of June and keeping them on our heads required constant hand support, so we eventually gave up.
By early July, just in time for our first experiment, the weather turned calmer. This made deploying the frames with our kayak much easier. Earlier, any pause in paddling would have sent us drifting straight back to the pontoon. The kayak also came in handy for measuring the water depth at the experimental site and for adjusting our mooring lines.
In this moment, we were optimistic: The project was starting to get on track. It seemed that we could finally switch on the autopilot and continue the work as outlined in the GAME 2025 manual. However, first we had to test the different steps of the analytical processes in the laboratory. We collected some of the fake algae that we had placed on the frames as backups in case of losses, put them in freezer bags and packed the freezer bags in larger black bags that we filled with ice and transported them to the laboratory. The first step, i.e. scraping the epiphytes from the substrates, went well, but a problem emerged when we tried to perform vacuum filtration. For this, the suspension of seawater, epiphytes, and sediment was poured into the funnel of the filtration unit, and the device was turned on. After a considerable amount of time, we could see that the volume in the funnel had not changed, because the sediment had clogged the flow of water through the filter. We were once again faced with a new impasse, and this one required a solution within a week. This was because the first experiment had already been running for more than seven days and could only continue for one more week. We tried decanting, but the epiphytes and sediment settled at a similar rate at the bottom of the beaker, making it difficult to separate them. Then we tried sieving through different sized meshes, but in doing so we lost a lot of biomass, what would have compromised our results. We also tried a method involving aliquots, which could have worked, but it took too long to test it a second time.
With no time left, we decided to remove the filtration step and to leave the sediment in our samples, as we simply could not get rid of it. Hence, the freezer bags were already drained at the study site. In the laboratory, the epiphytes were scraped off and directly transferred to test tubes, which were then filled up with ethanol. This method proved to be successful as we obtained chlorophyll a concentrations that were similar to those of the other GAME teams. For the biomass samples, a similar method was used, but their processing required the use of a muffle oven to obtain the ash-free dry weight. As none of the institutions here in Mindelo have such equipment, the samples were transported to Germany to muffle them at GEOMAR.
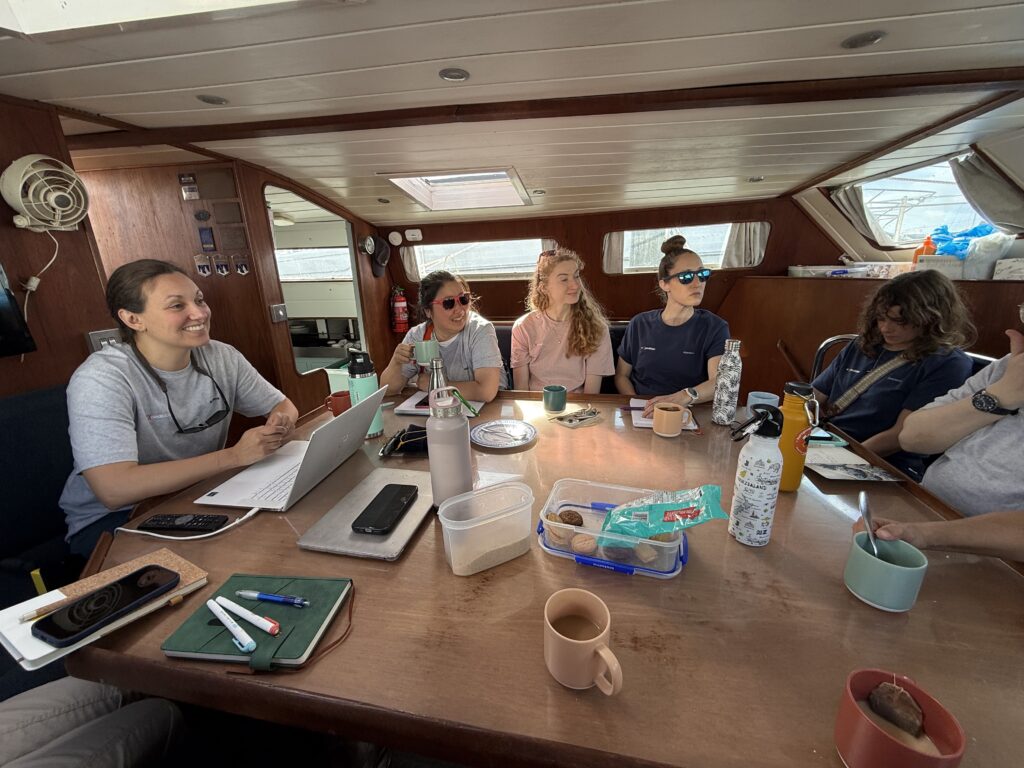
At this point, we were already thinking about what aspects could be improved in our second experiment, which was already underway. Furthermore, Sarah recently completed her first dive, spotting a nurse shark, plenty of fish, and sea turtles. She was hoping to spend more evenings at the beach in the coming weeks, playing volleyball and enjoying live music, especially during the Baía das Gatas Festival—one of the largest festivals in the country—which was approaching. In the words of our advisor, “The project is now running smoothly.” However, no one expected that in August a country that rarely receives rain throughout the year would be shaken by the biggest storm in living memory.
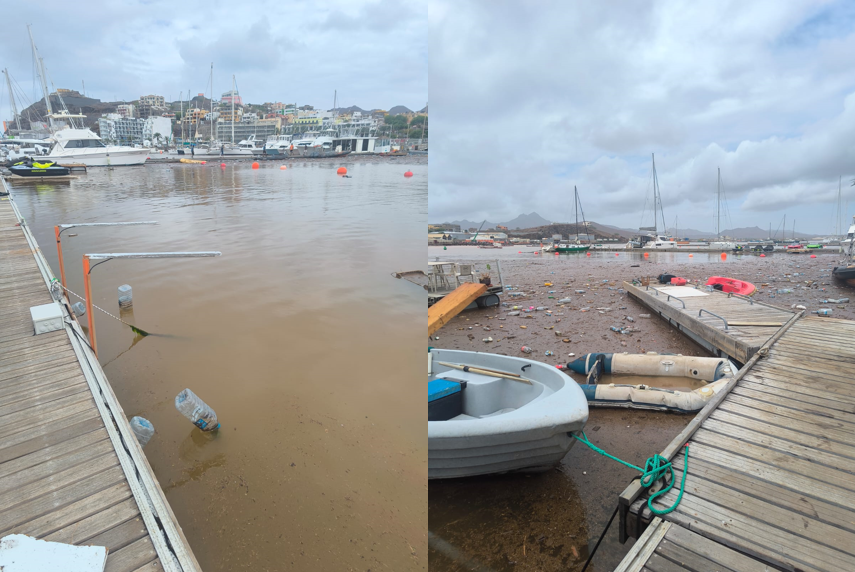
In the early hours of August 11th, storm Erin arrived without warning, causing material losses and, sadly, claiming the lives of nine people on the island of São Vicente. During the night, the scene was one of horror, with streets turned into rivers, lightning illuminating the entire city, and people desperately fighting for their lives and those of their loved ones as rainwater flooded their homes. In the morning, it was then possible to get a real sense of what had happened. Buildings had been knocked down, cars carried out to sea, shops destroyed, all caused by the force of the rainwater. The Mindelo micro-watershed, characterized by a mountainous terrain and a rugged topography, allowed the rainwater that fell on the city to flush to Porto Grande Bay, resulting in an exacerbated discharge of muddy water accompanied by trash. Experiment 2, which had already been in the water for a week, was canceled as the conditions in the bay no longer met the requirements for conducting an experiment. Square kilometers of water that had been crystal clear had turned brown and opaque, and we had no idea how long these conditions would last.
Soon after the storm, it was decided that the team would split up: Sarah would go to Finland to continue her project with the GAME team there, and Andrea would stay here to continue as soon as conditions had improved. A month passed, and the bay was slowly returning to its normal colour, but then another rain came and turned it brown again. Then it was too late to repeat experiment 2. But all is not lost. In January 2026, after we had completed the last phase of the project at GEOMAR in Kiel, Andrea considered to continue with the experimental work. At this time, the rainy season in Cabo Verde was over, and the water was still at mild temperatures.
The unforgettable catastrophe of August 11th 2025 in São Vicente allowed us to speculate on the origin of the mud/sediment that affected our experiment. The sediment that accumulated on the substrates probably came from the muddy water that floods Porto Grande Bay every year during the rainy season. Somehow—possibly due to the regular entry and exit of ferries from the port—the sediment gets resuspended frequently and travels through the water column by the forces of tidal currents and others. At least one riddle was solved.
I have been studying plastic pollution for more than a decade. I’ve analyzed hundreds of samples in labs, pored over data and spent years thinking hard about where plastics go once they leave our hands and enter the environment. I love doing work on the water—this was a big part of my previous professional roles in Alaska and in Saipan, Northern Mariana Islands.
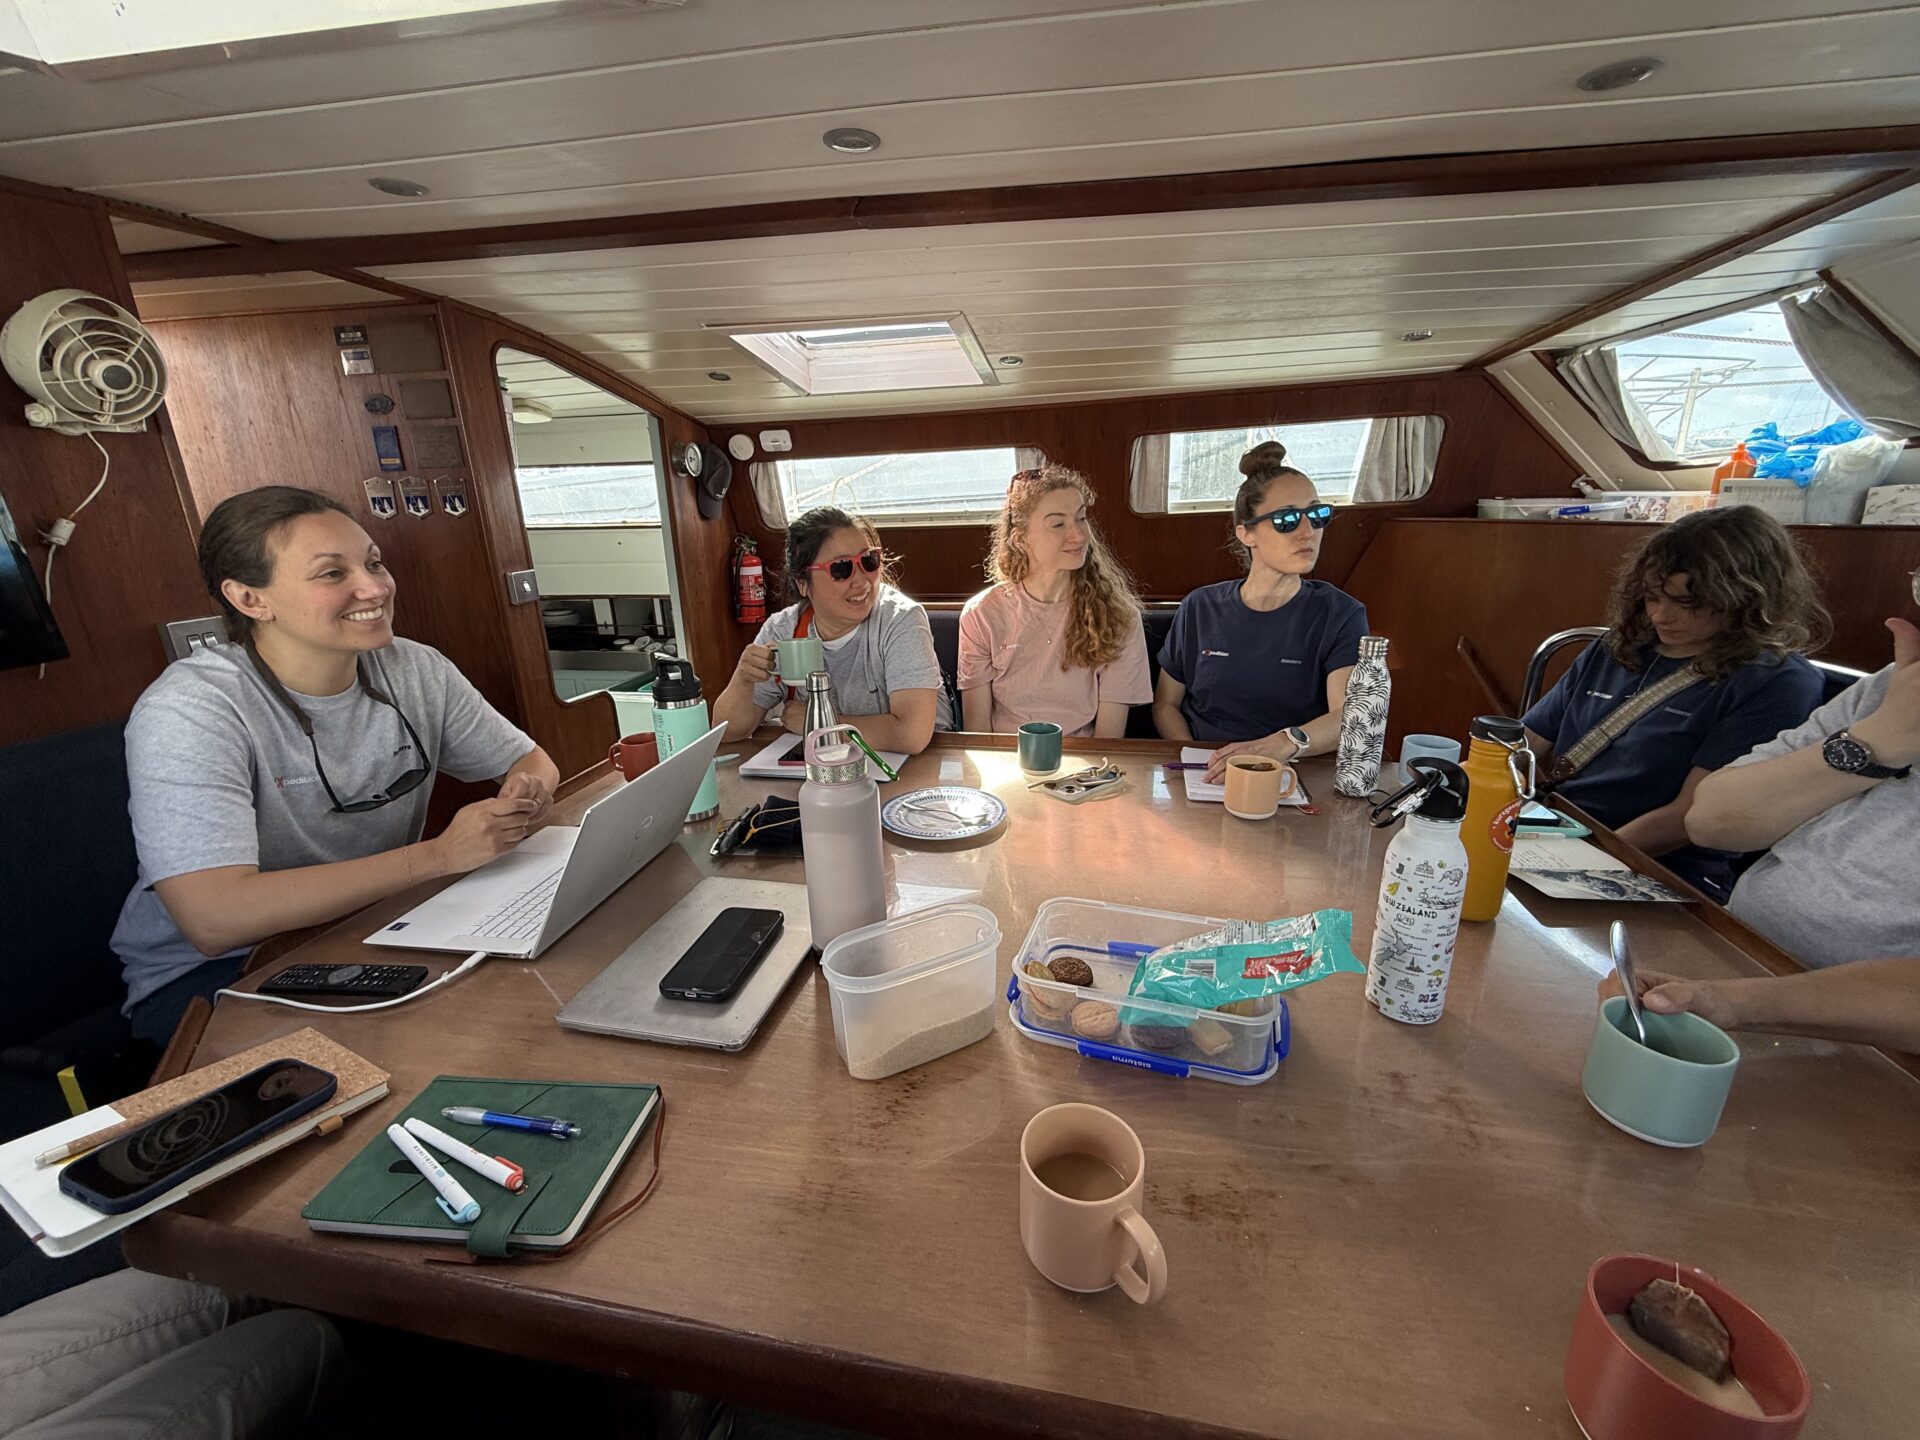
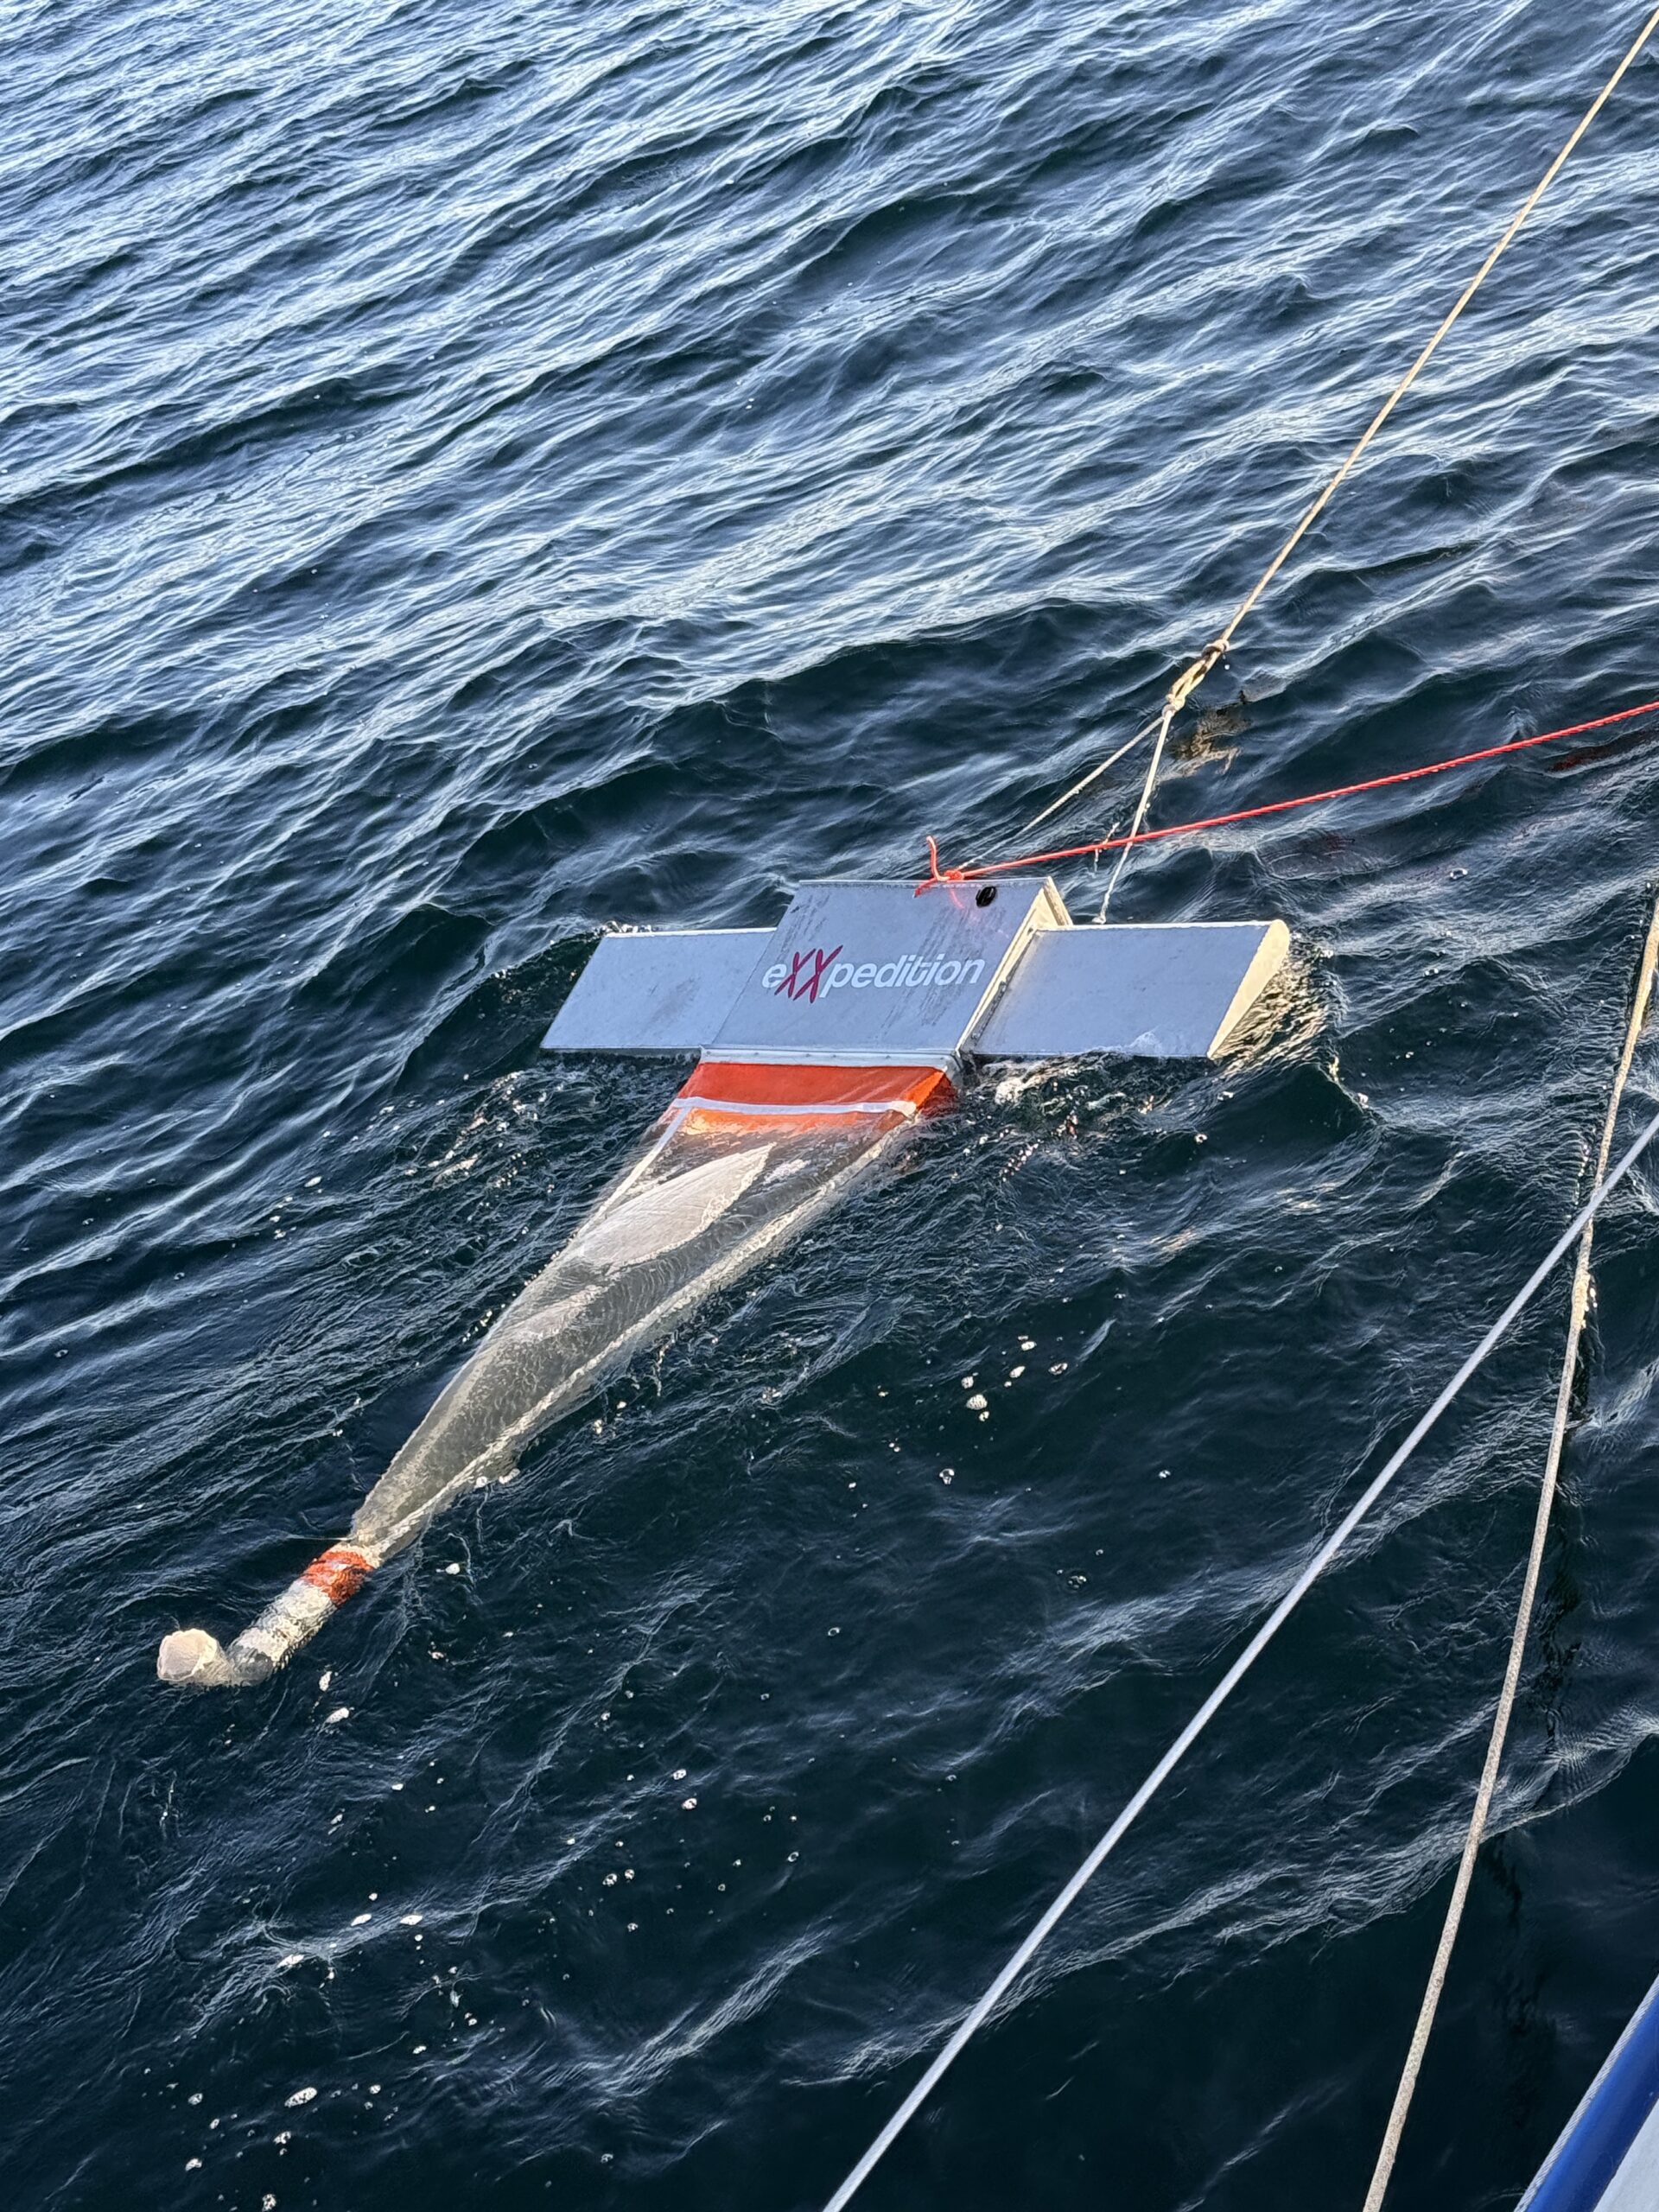
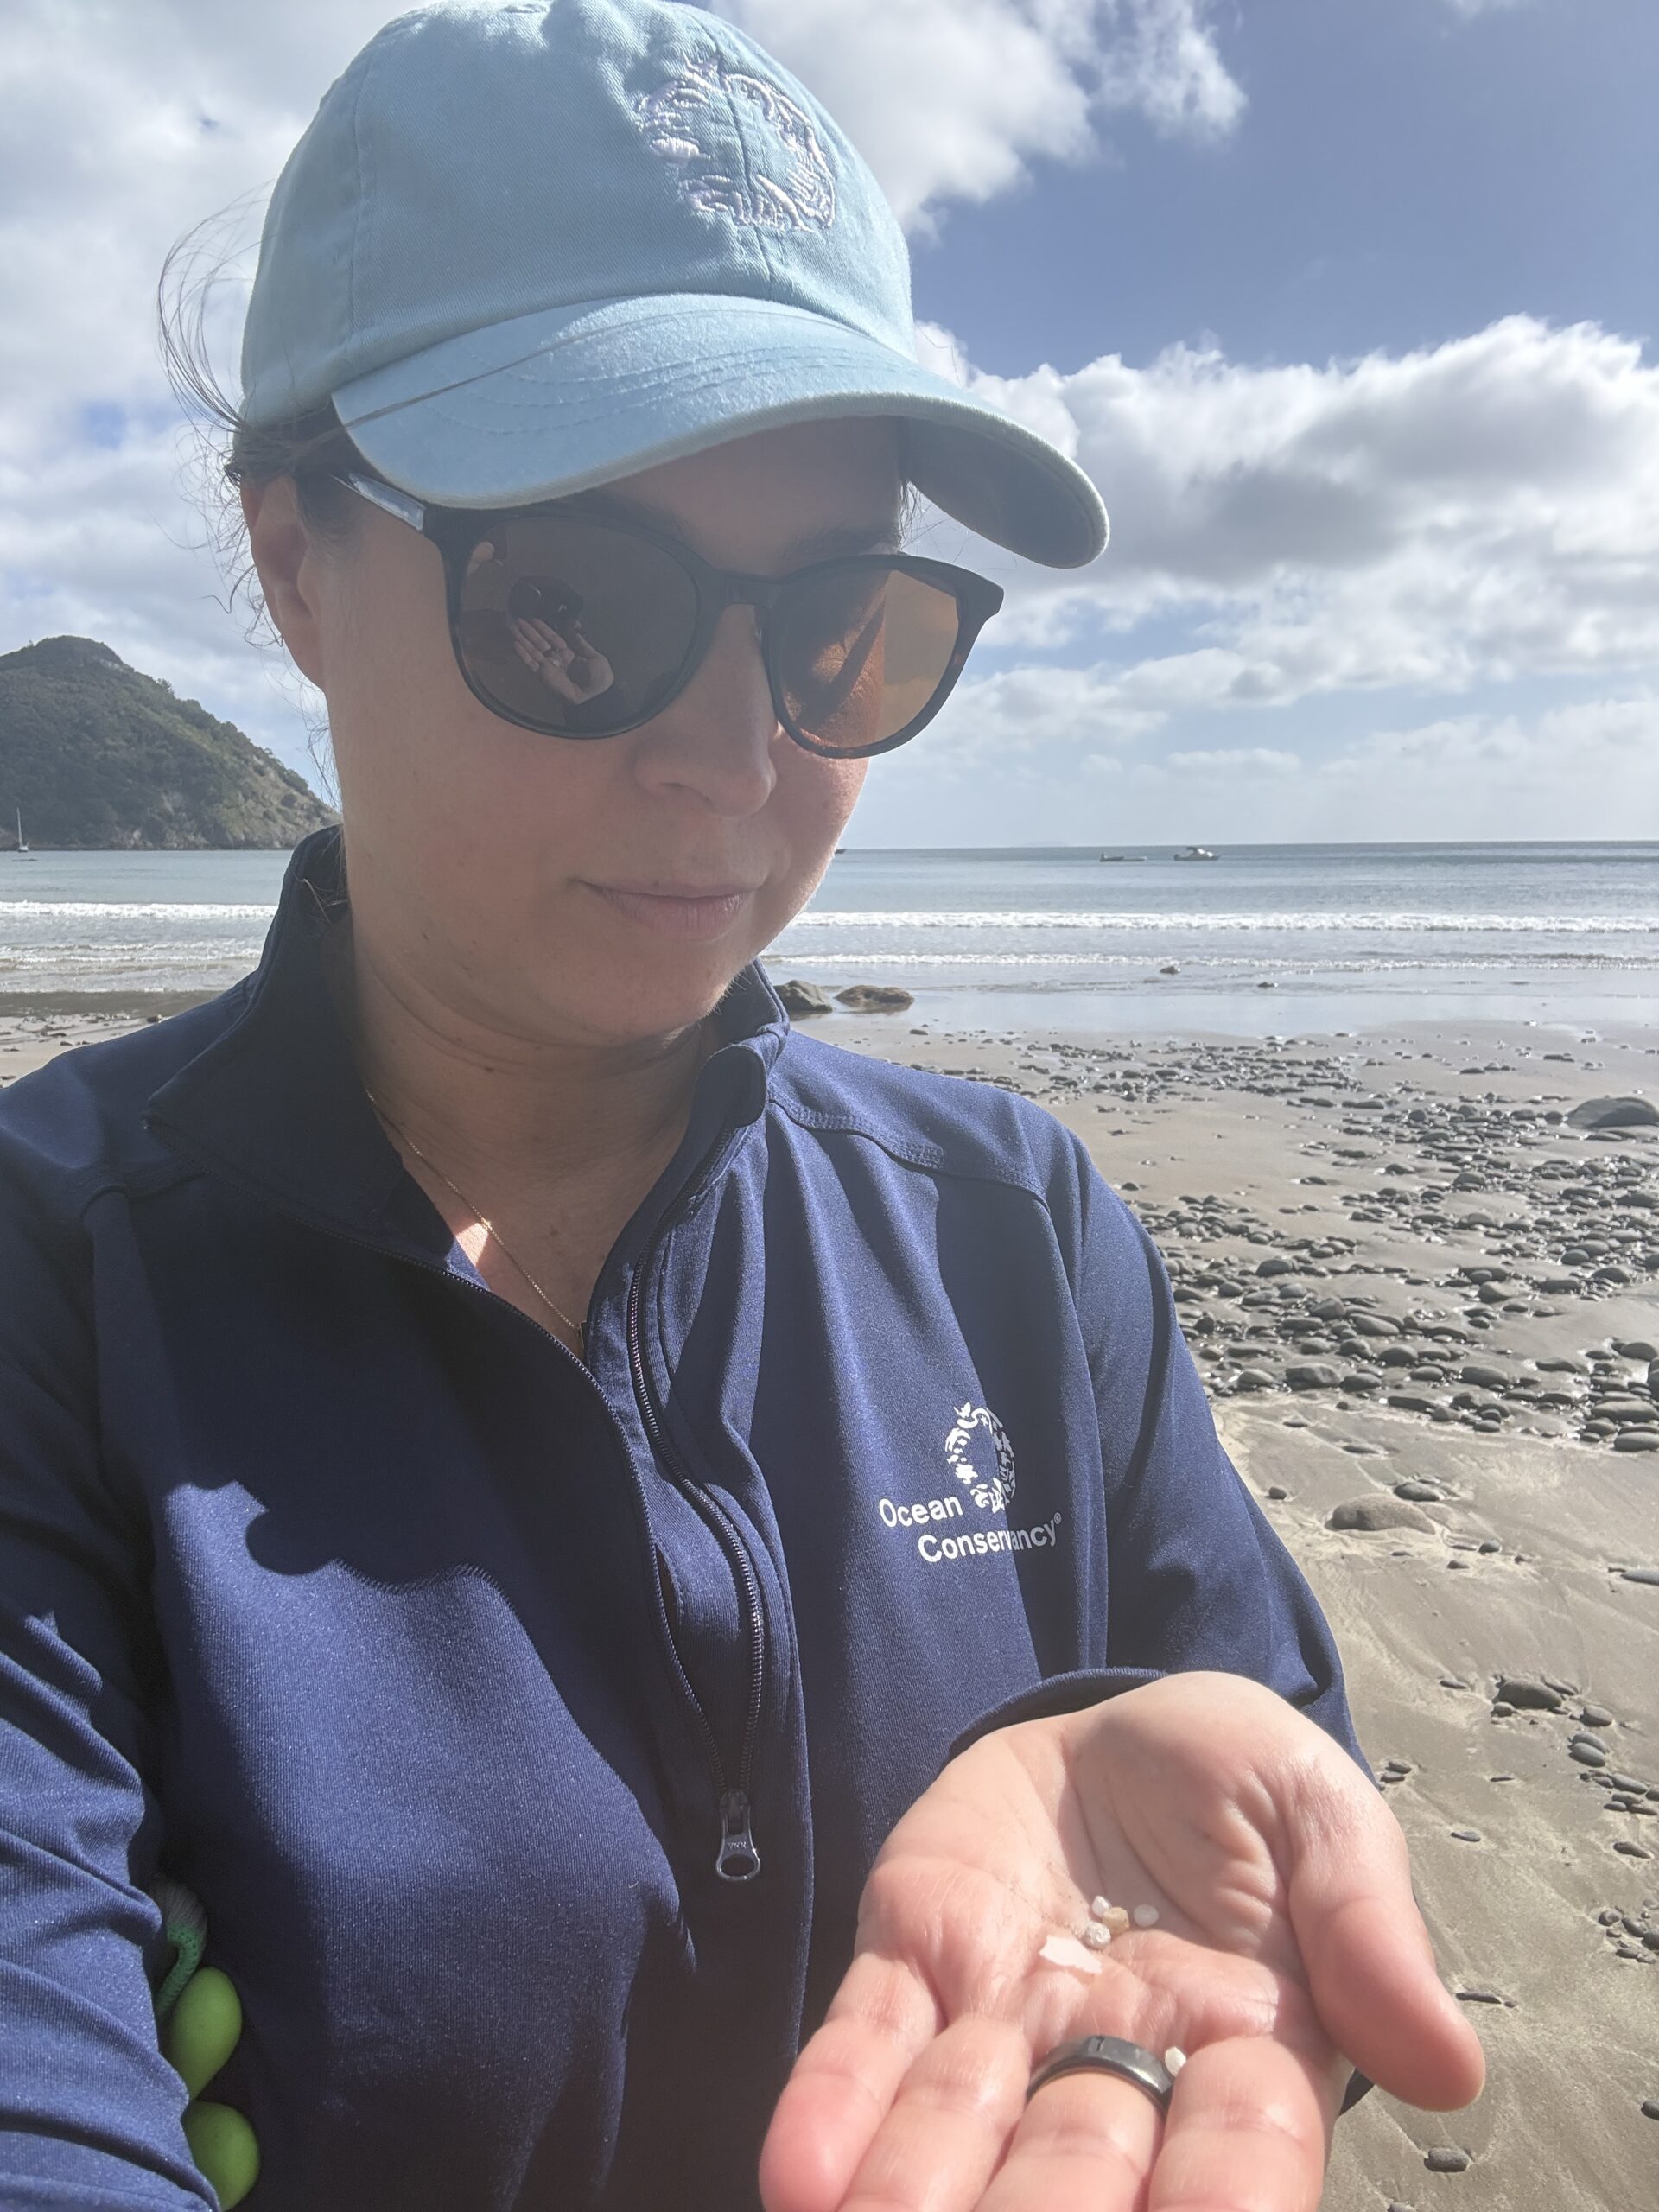
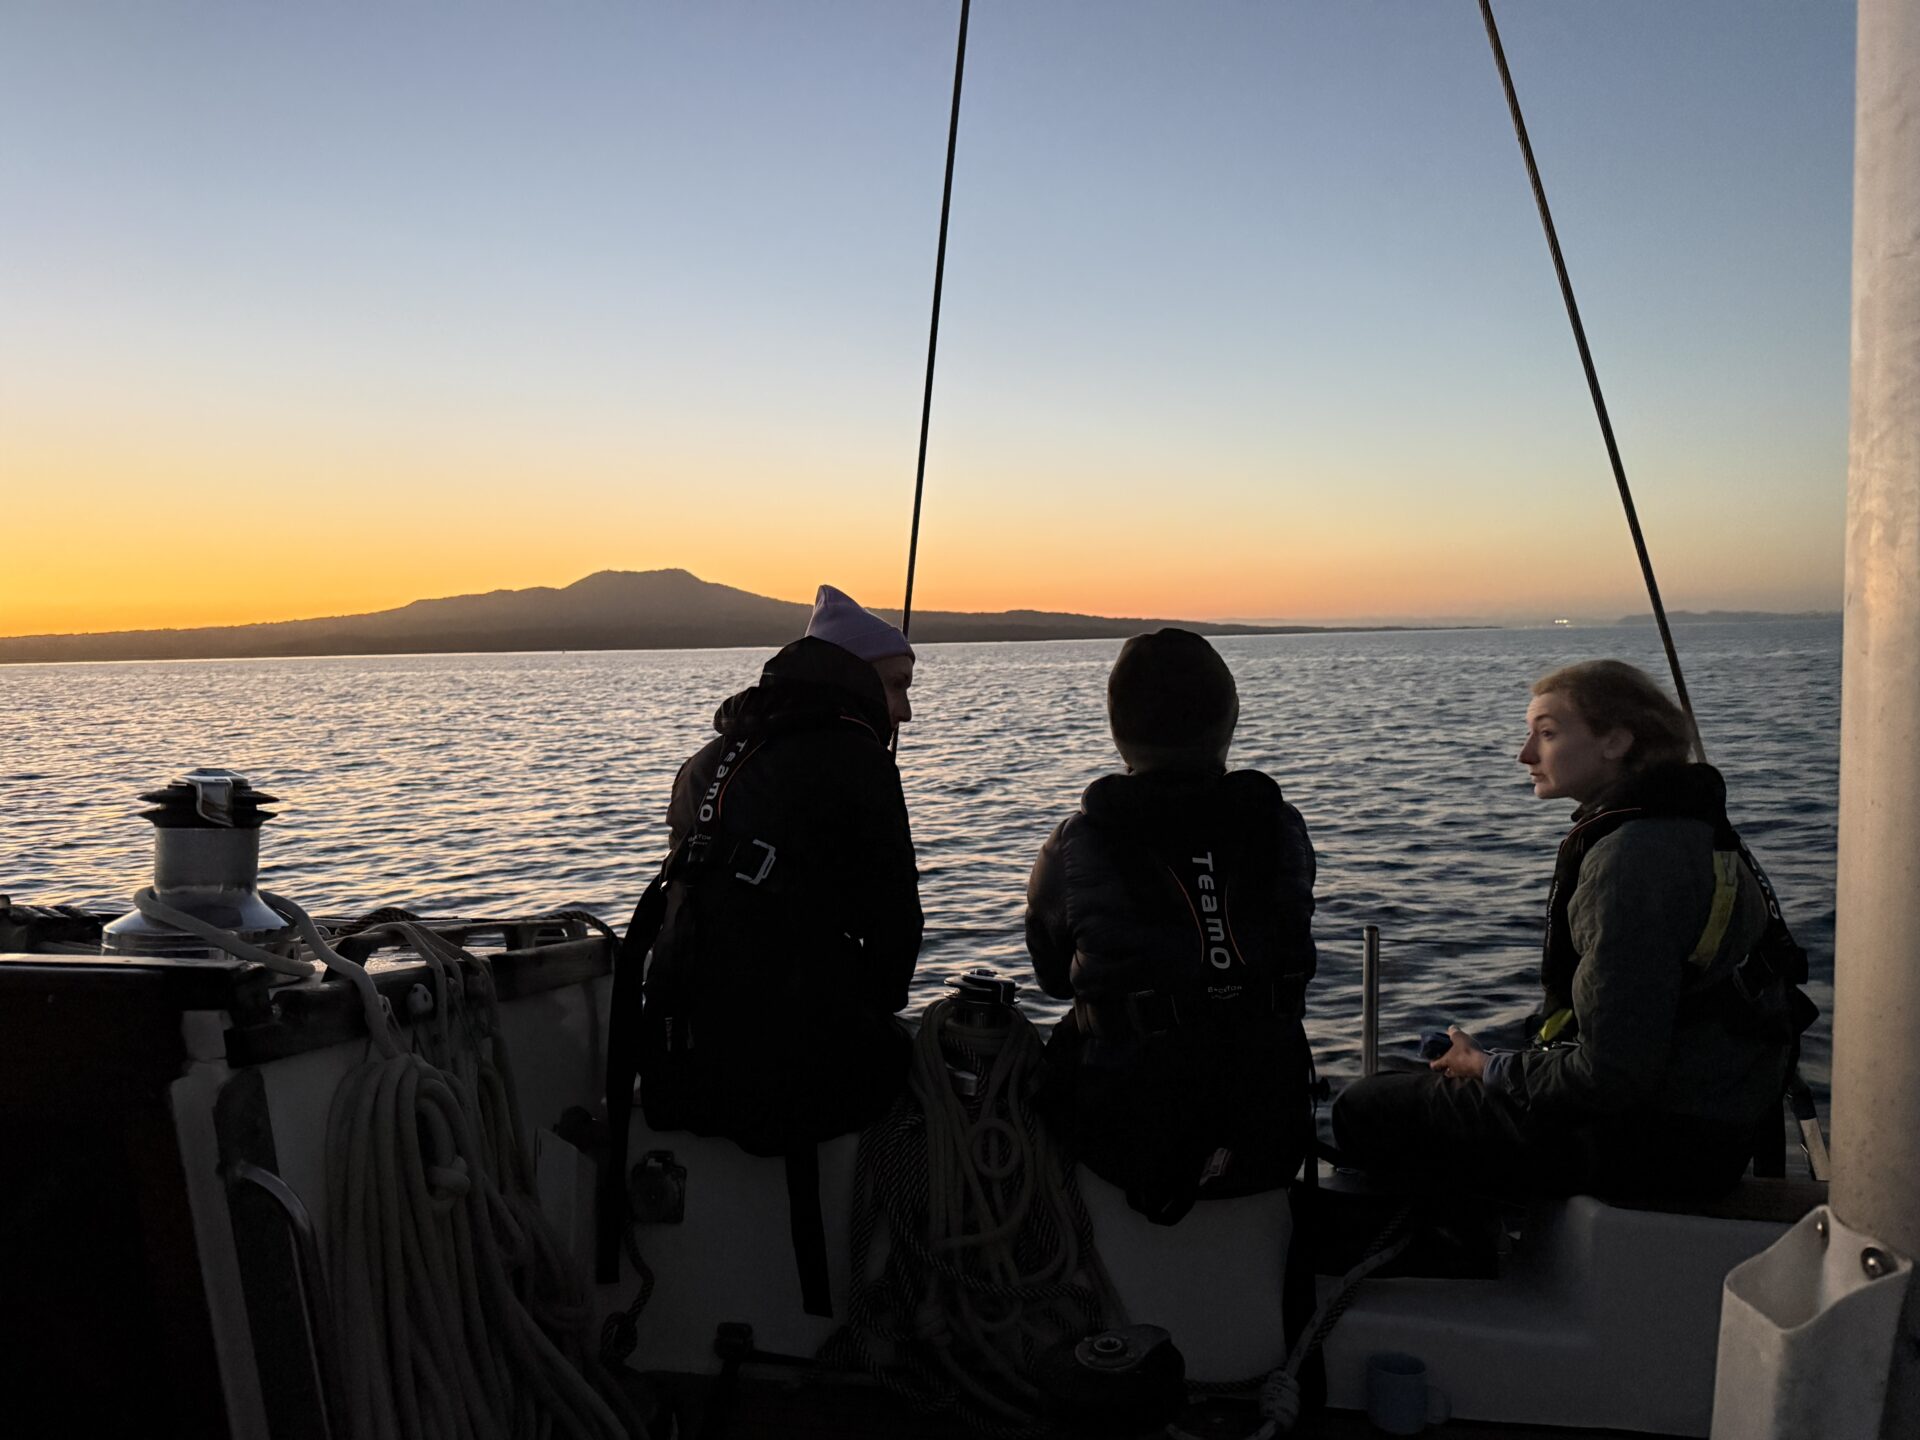
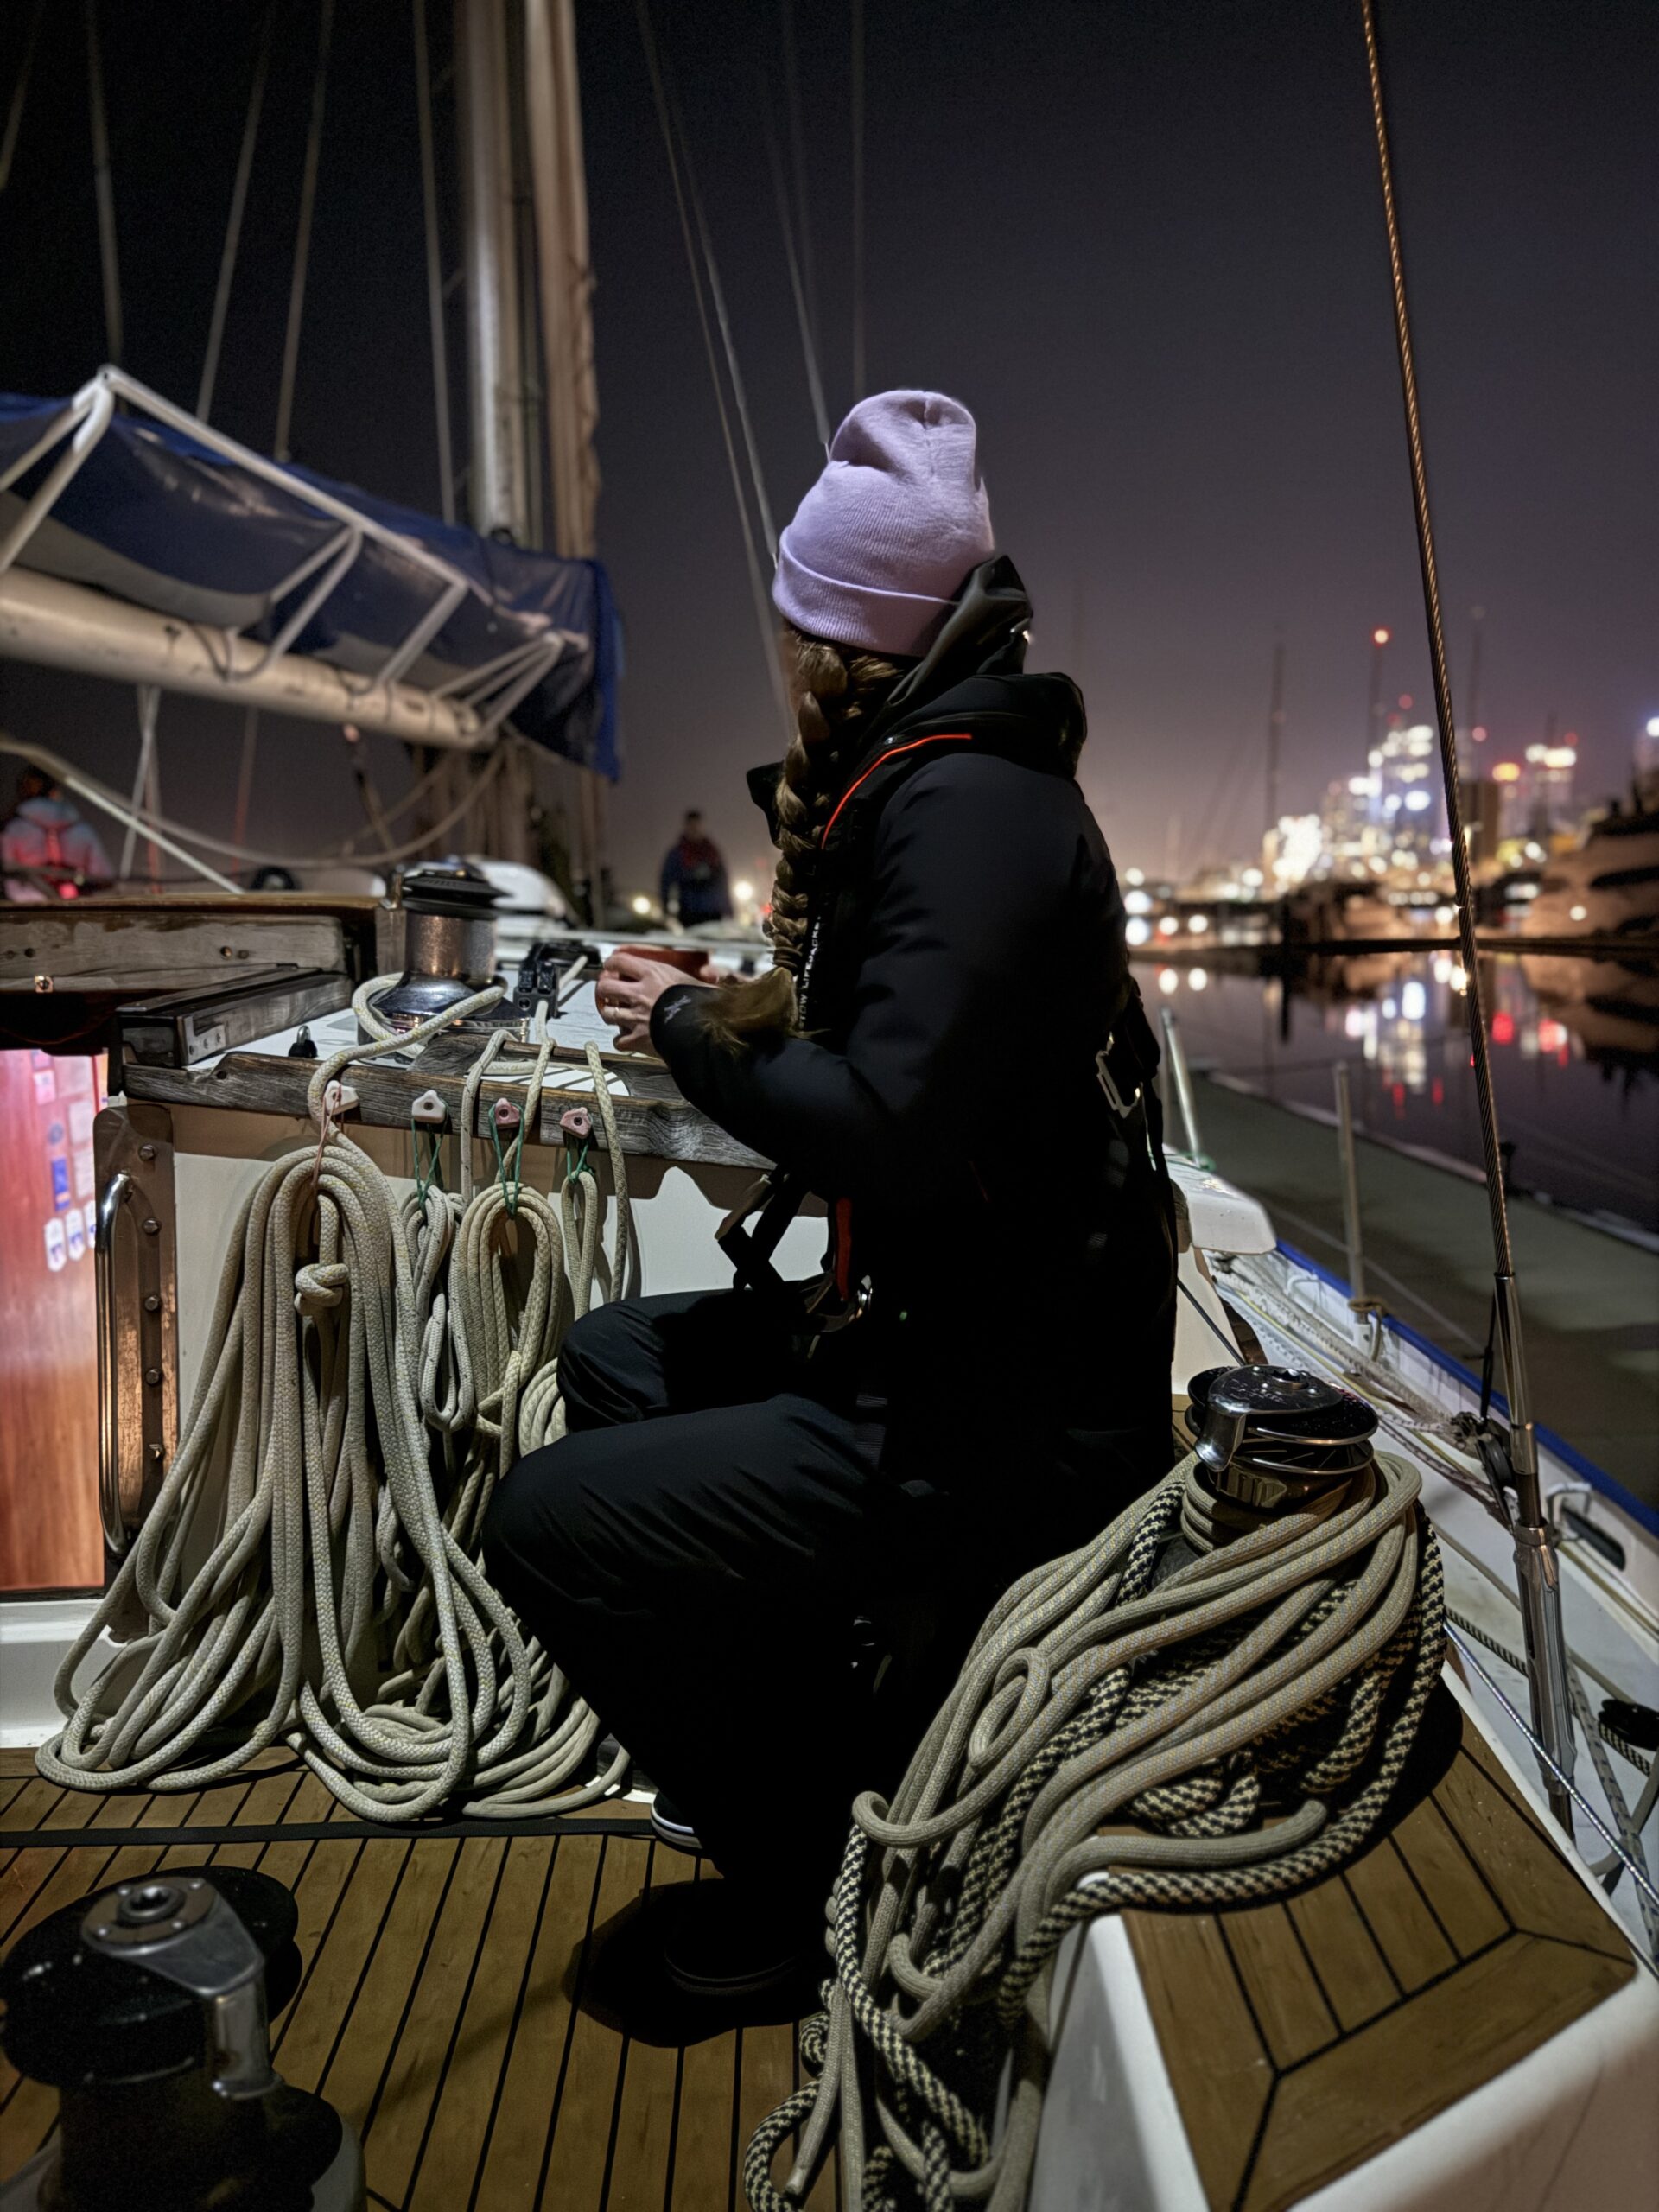
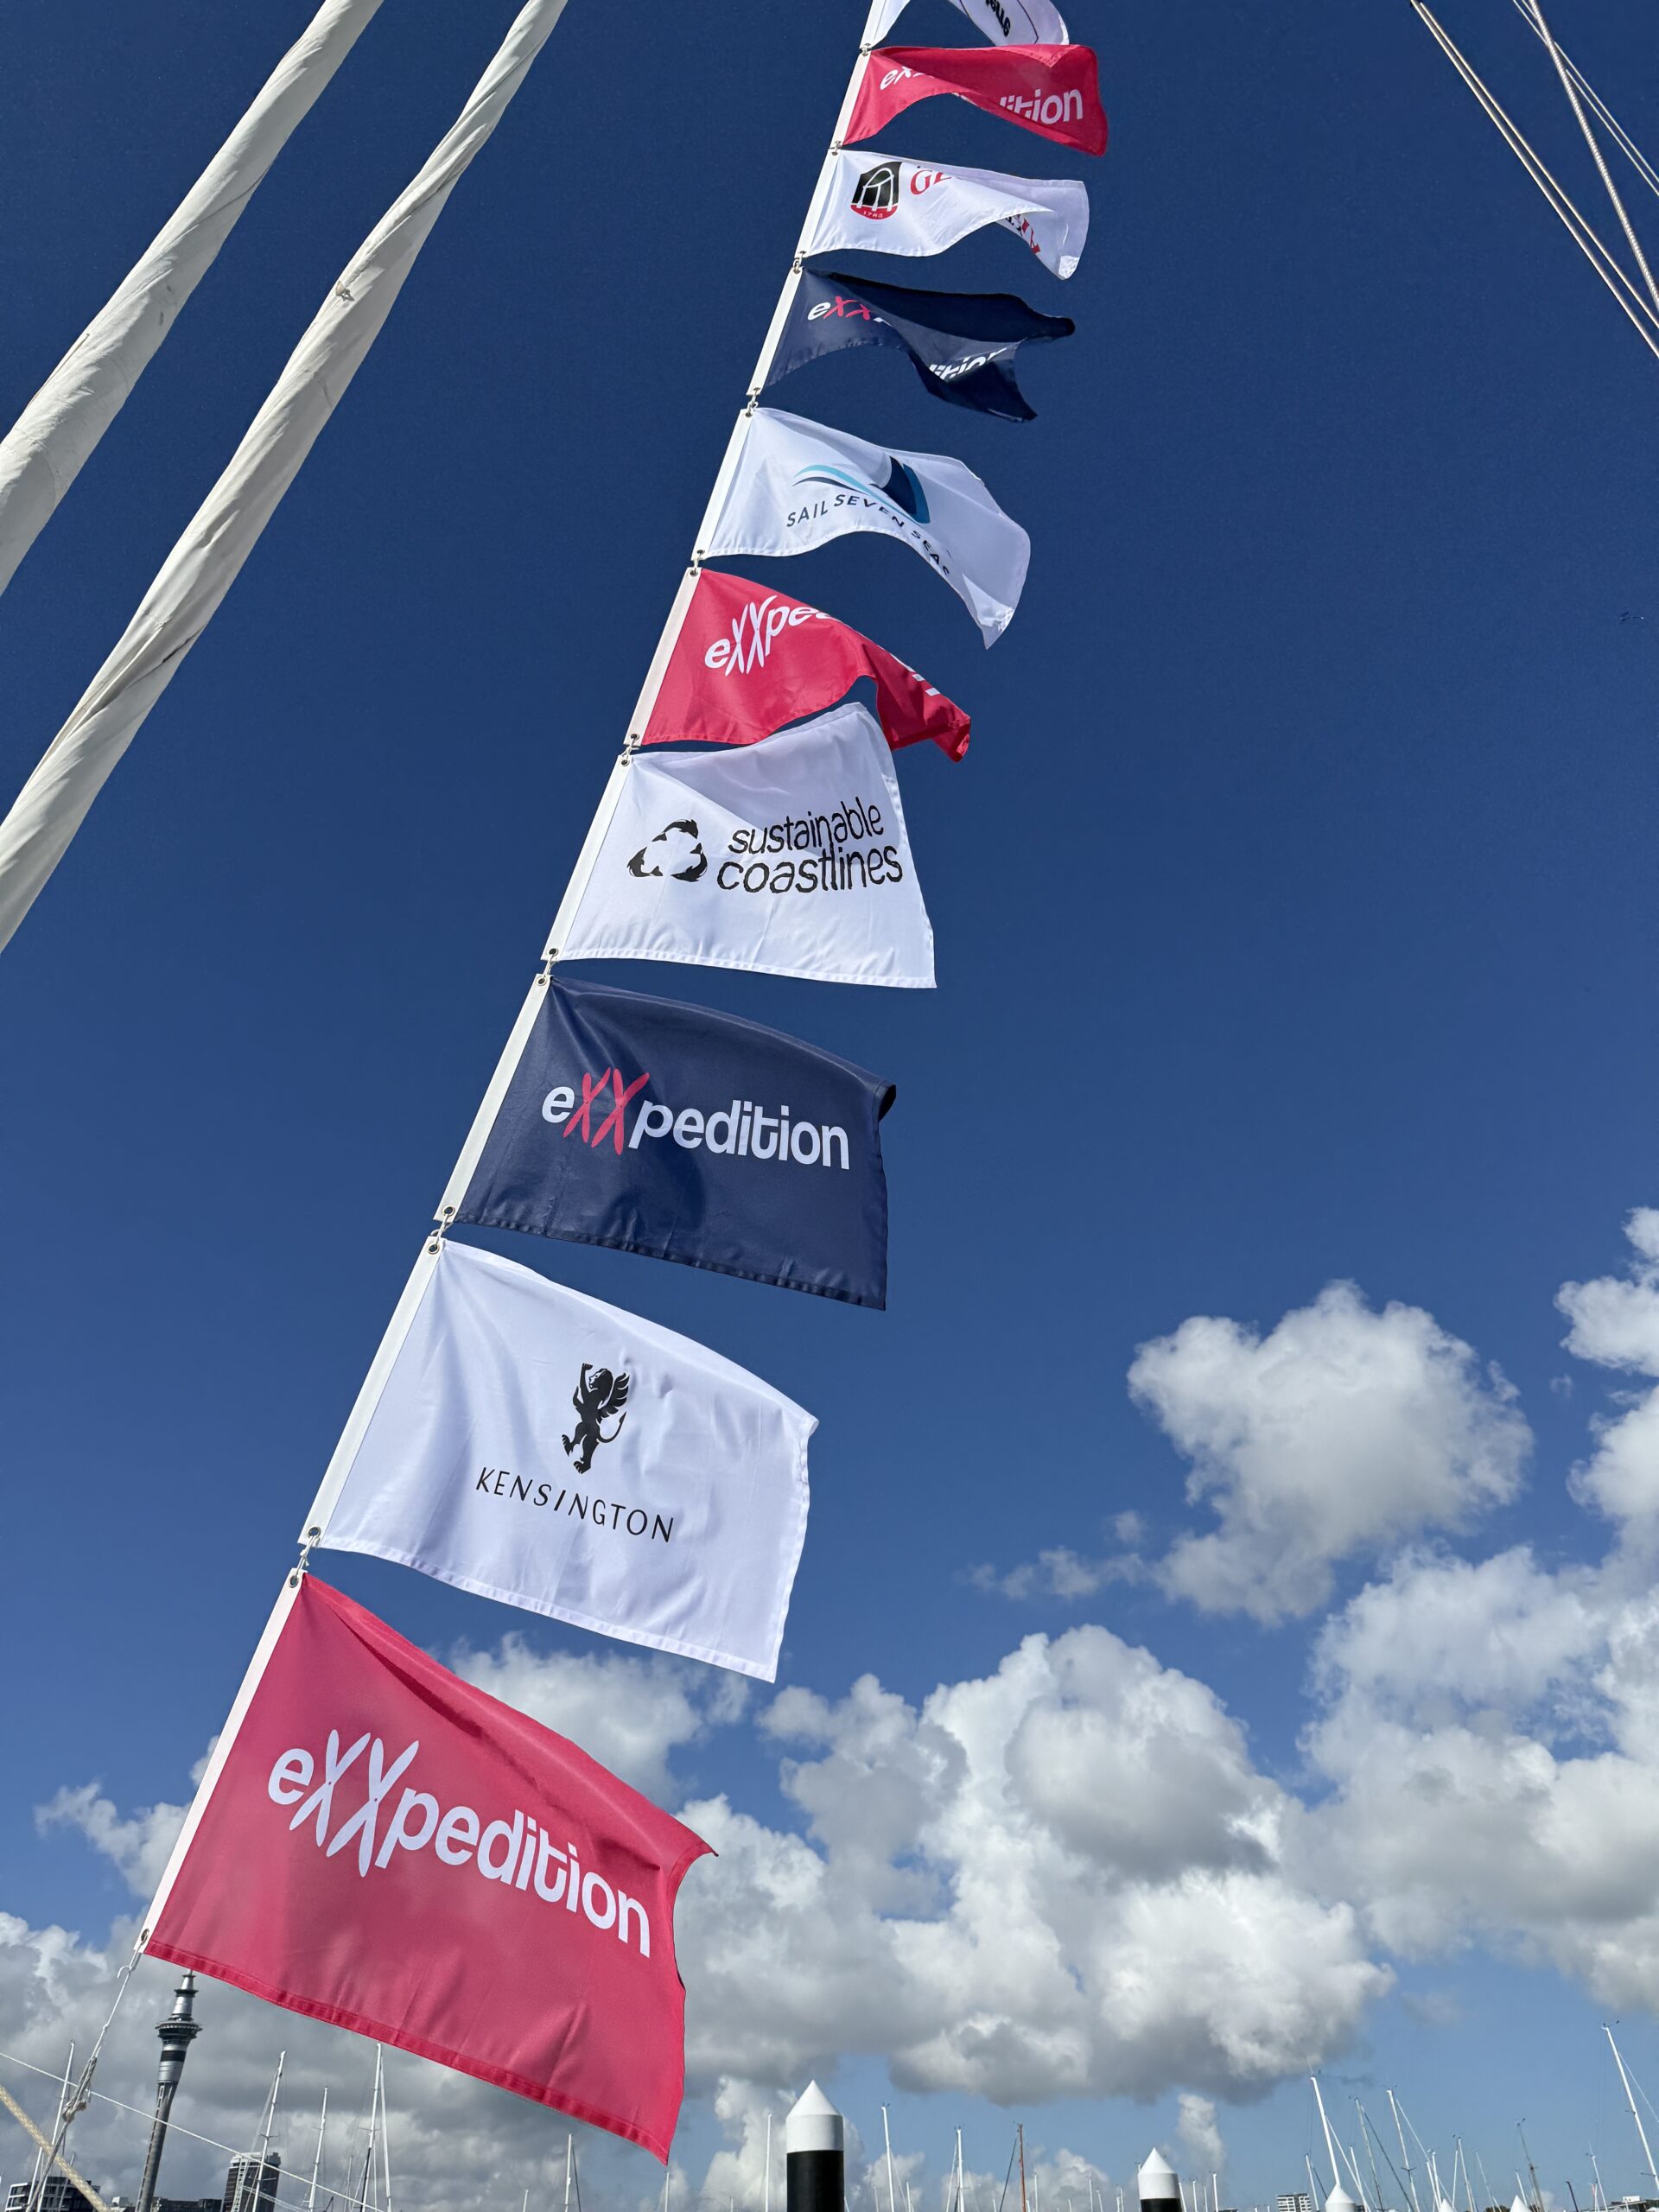
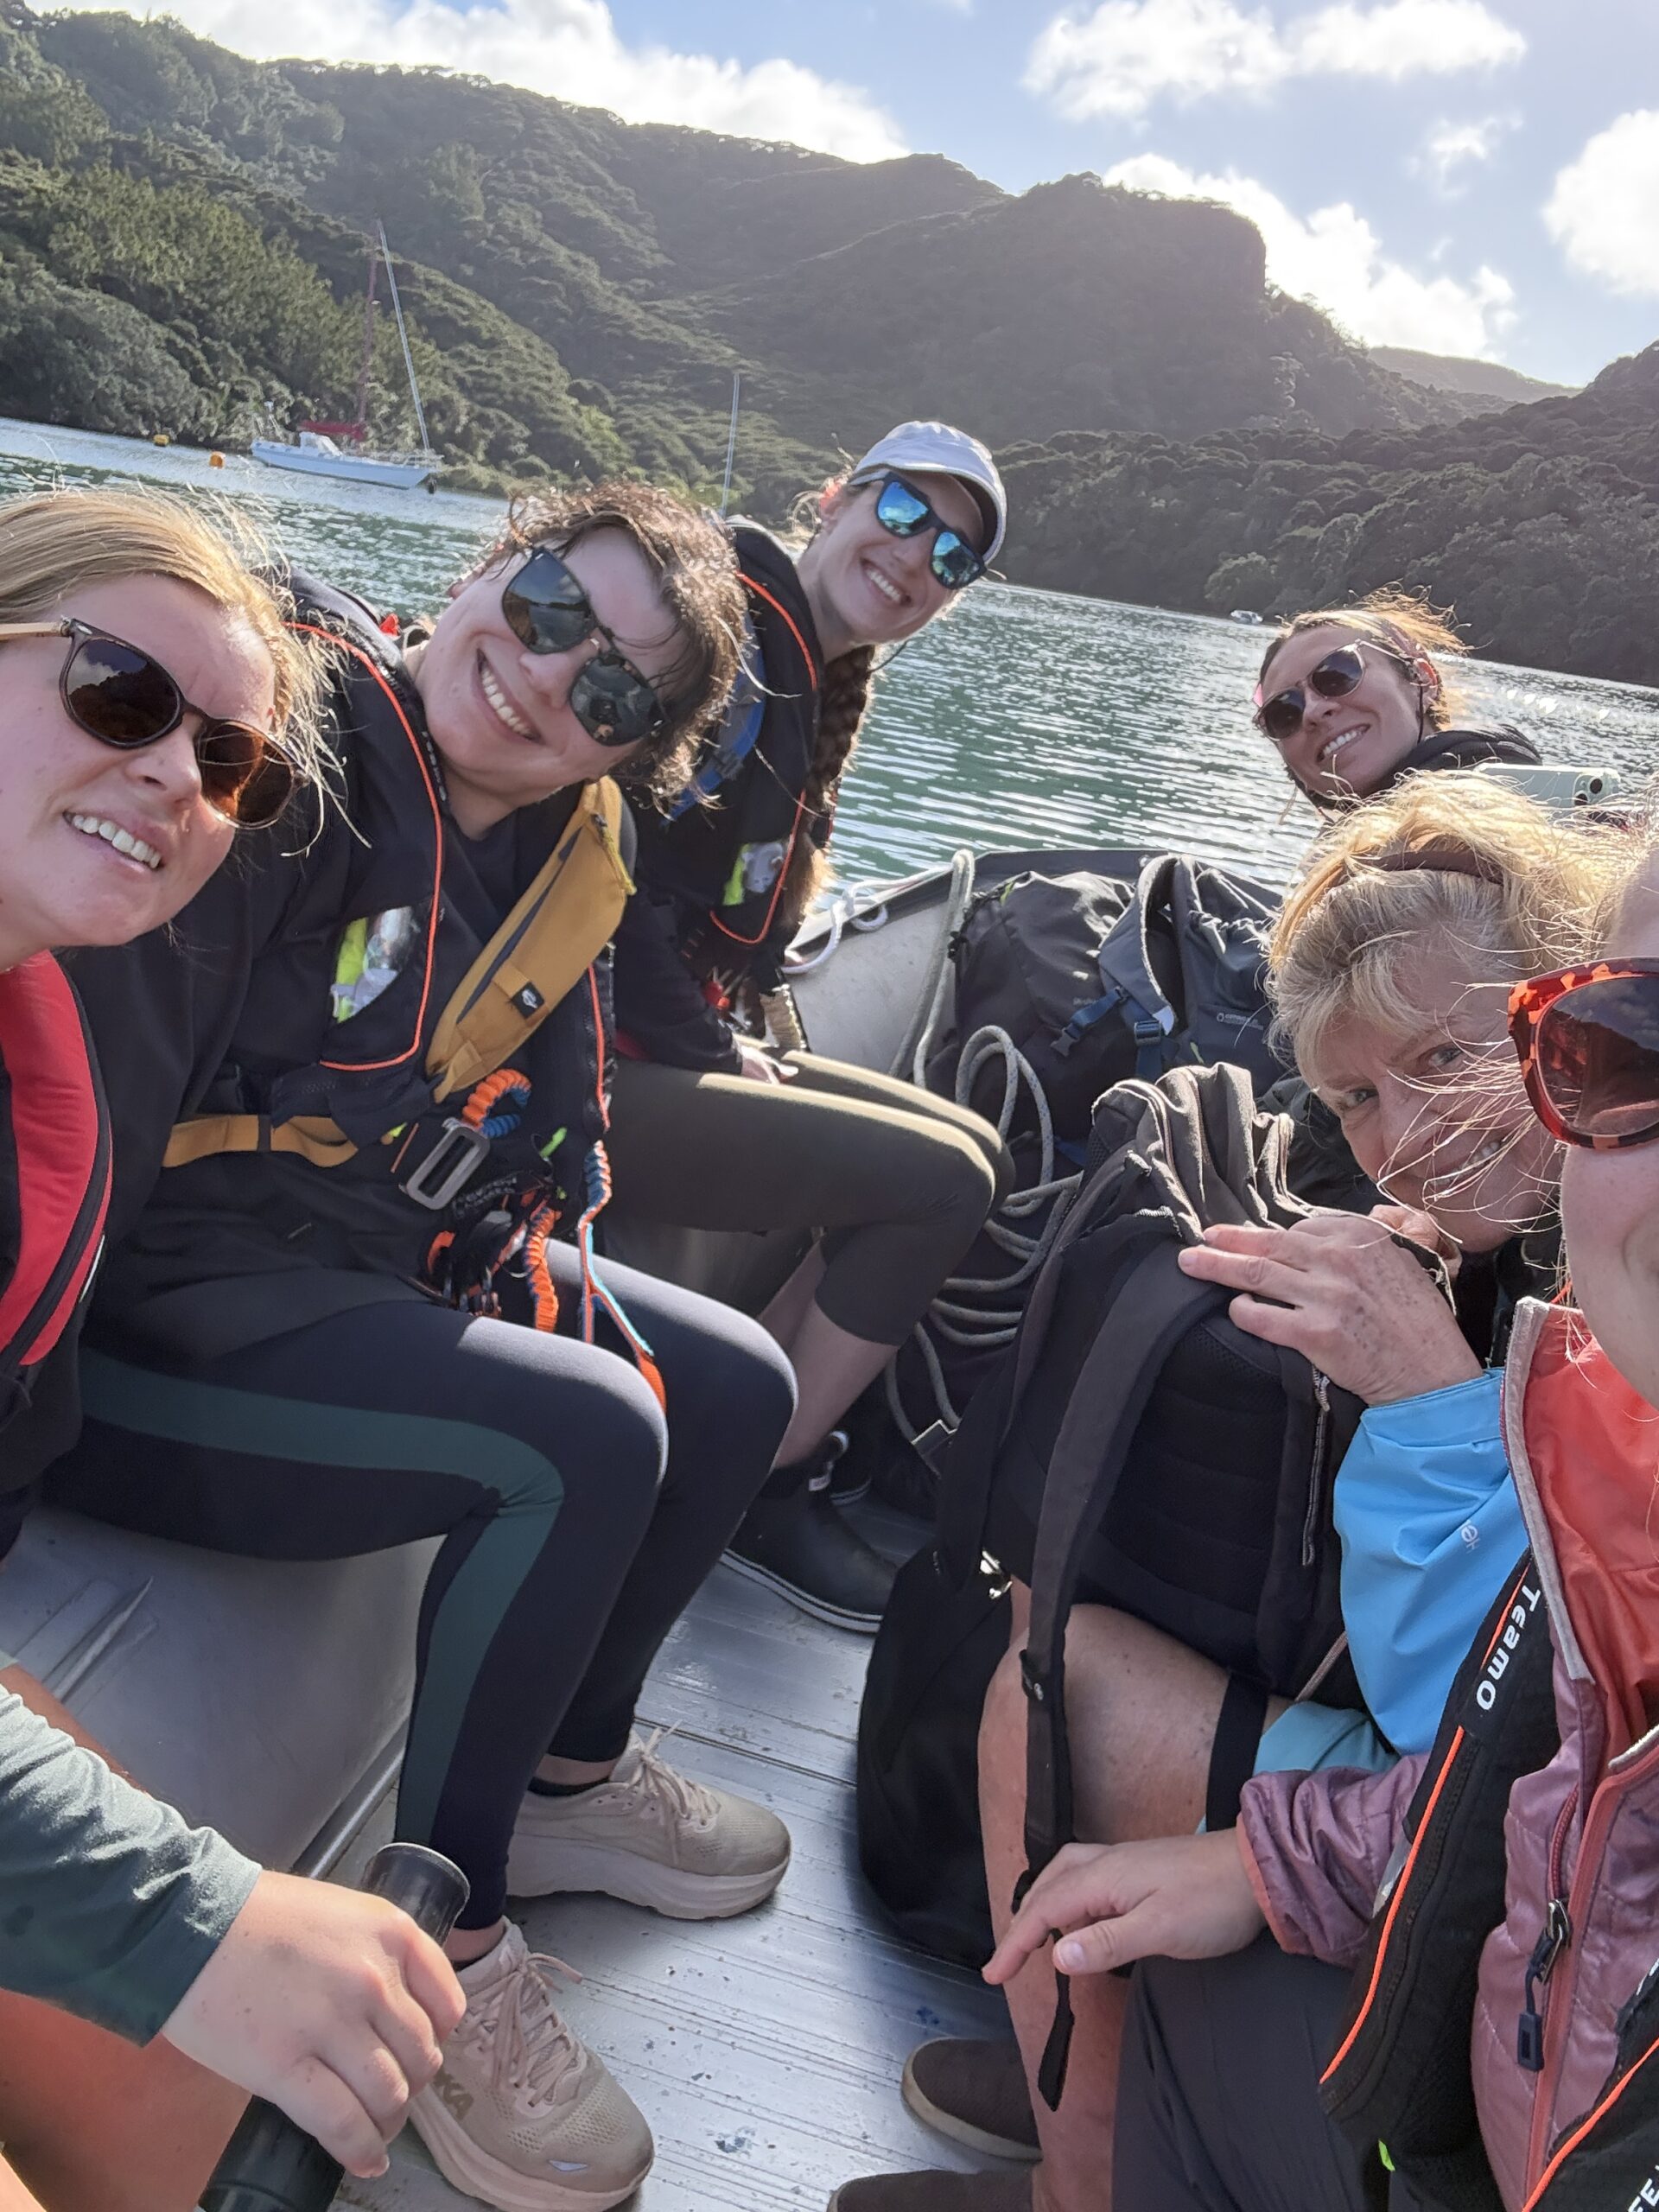
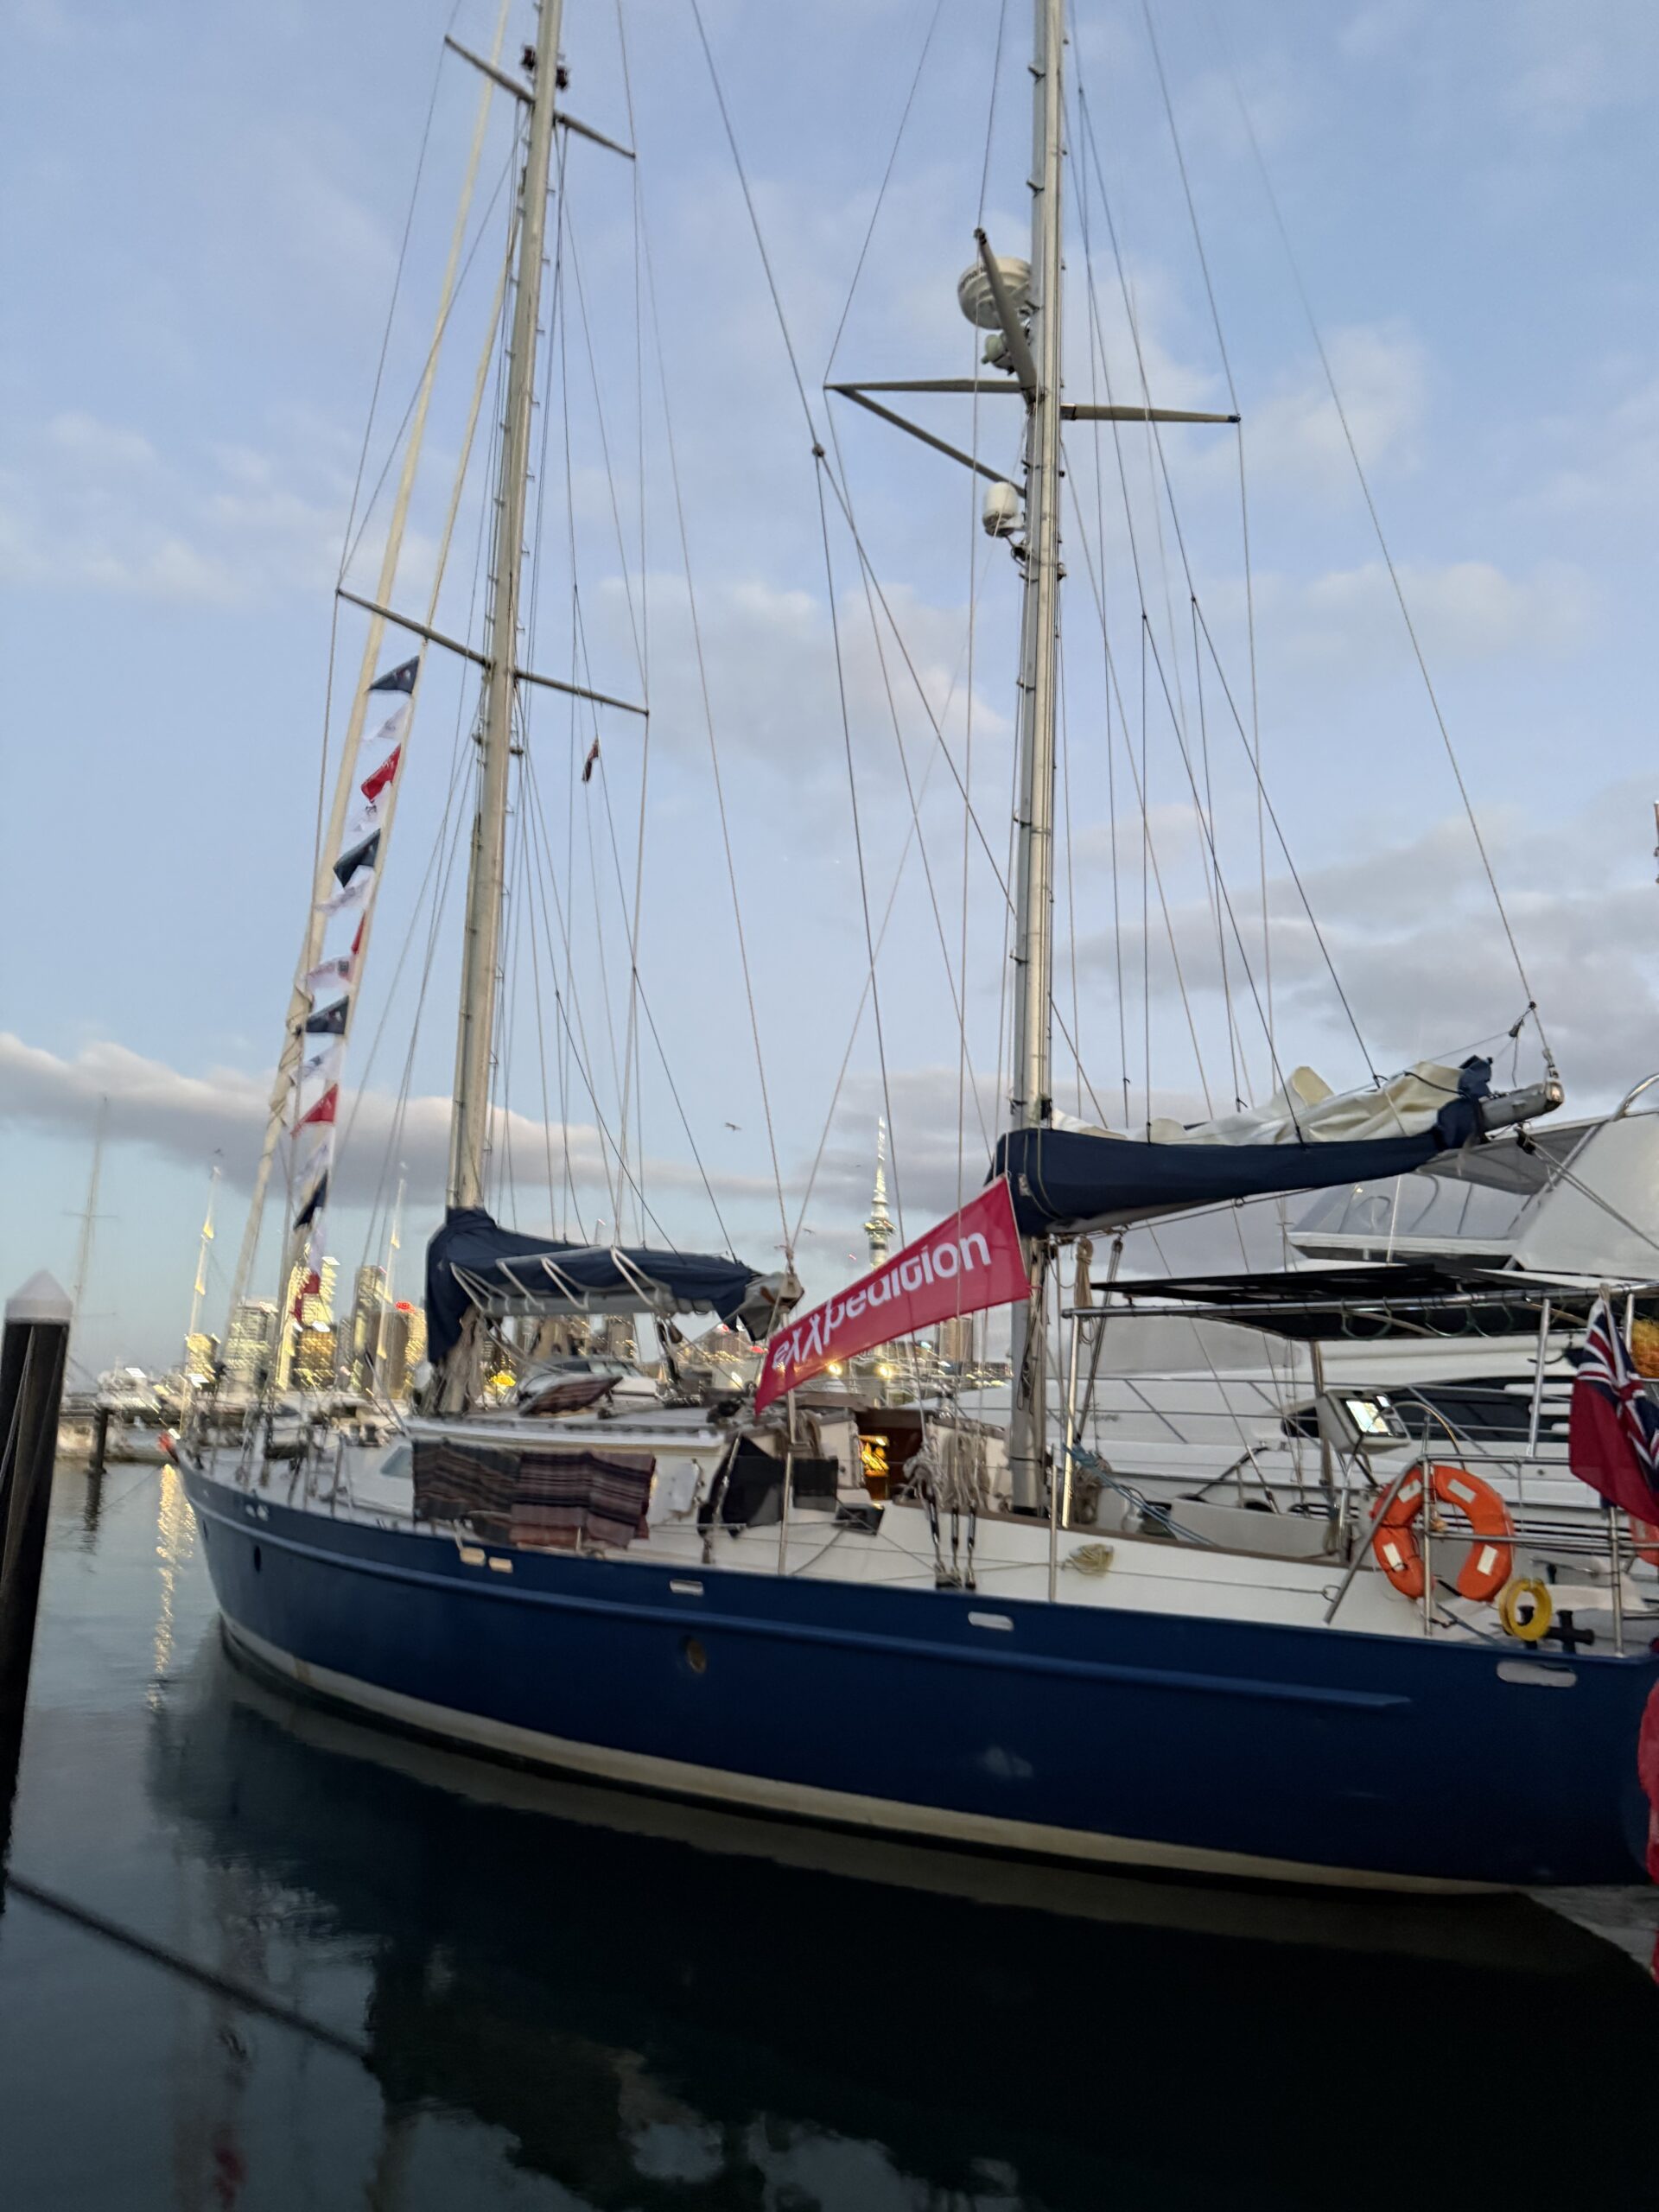
And here’s where it took me! I was thrilled to have the opportunity to join the first leg of eXXpedition’s voyage in the South Pacific this past spring, trading my lab coat for a lifejacket to study microplastics at sea. Sailing from Auckland, New Zealand, to the Bay of Islands aboard the 70-foot research vessel Wind Shift over 10 days, our crew of 12 women conducted ocean water-surface sampling via manta tow nets (a long cone-shaped mesh net), cleaned up debris on remote beaches and examined city streets with measuring tapes and field equipment. Our purpose? To collect key data to help us better understand the flow of plastics from land to sea.
Our all-female guest crew—hence the XX in “eXXpedition”—brought aboard expertise from the fields of structural engineering, circular economy strategy, sustainable fashion, plastics research, robotics and more. Together, we represented a remarkable cross-section of disciplines united around a shared concern for the health of our ocean.
Seeing it with my own eyes
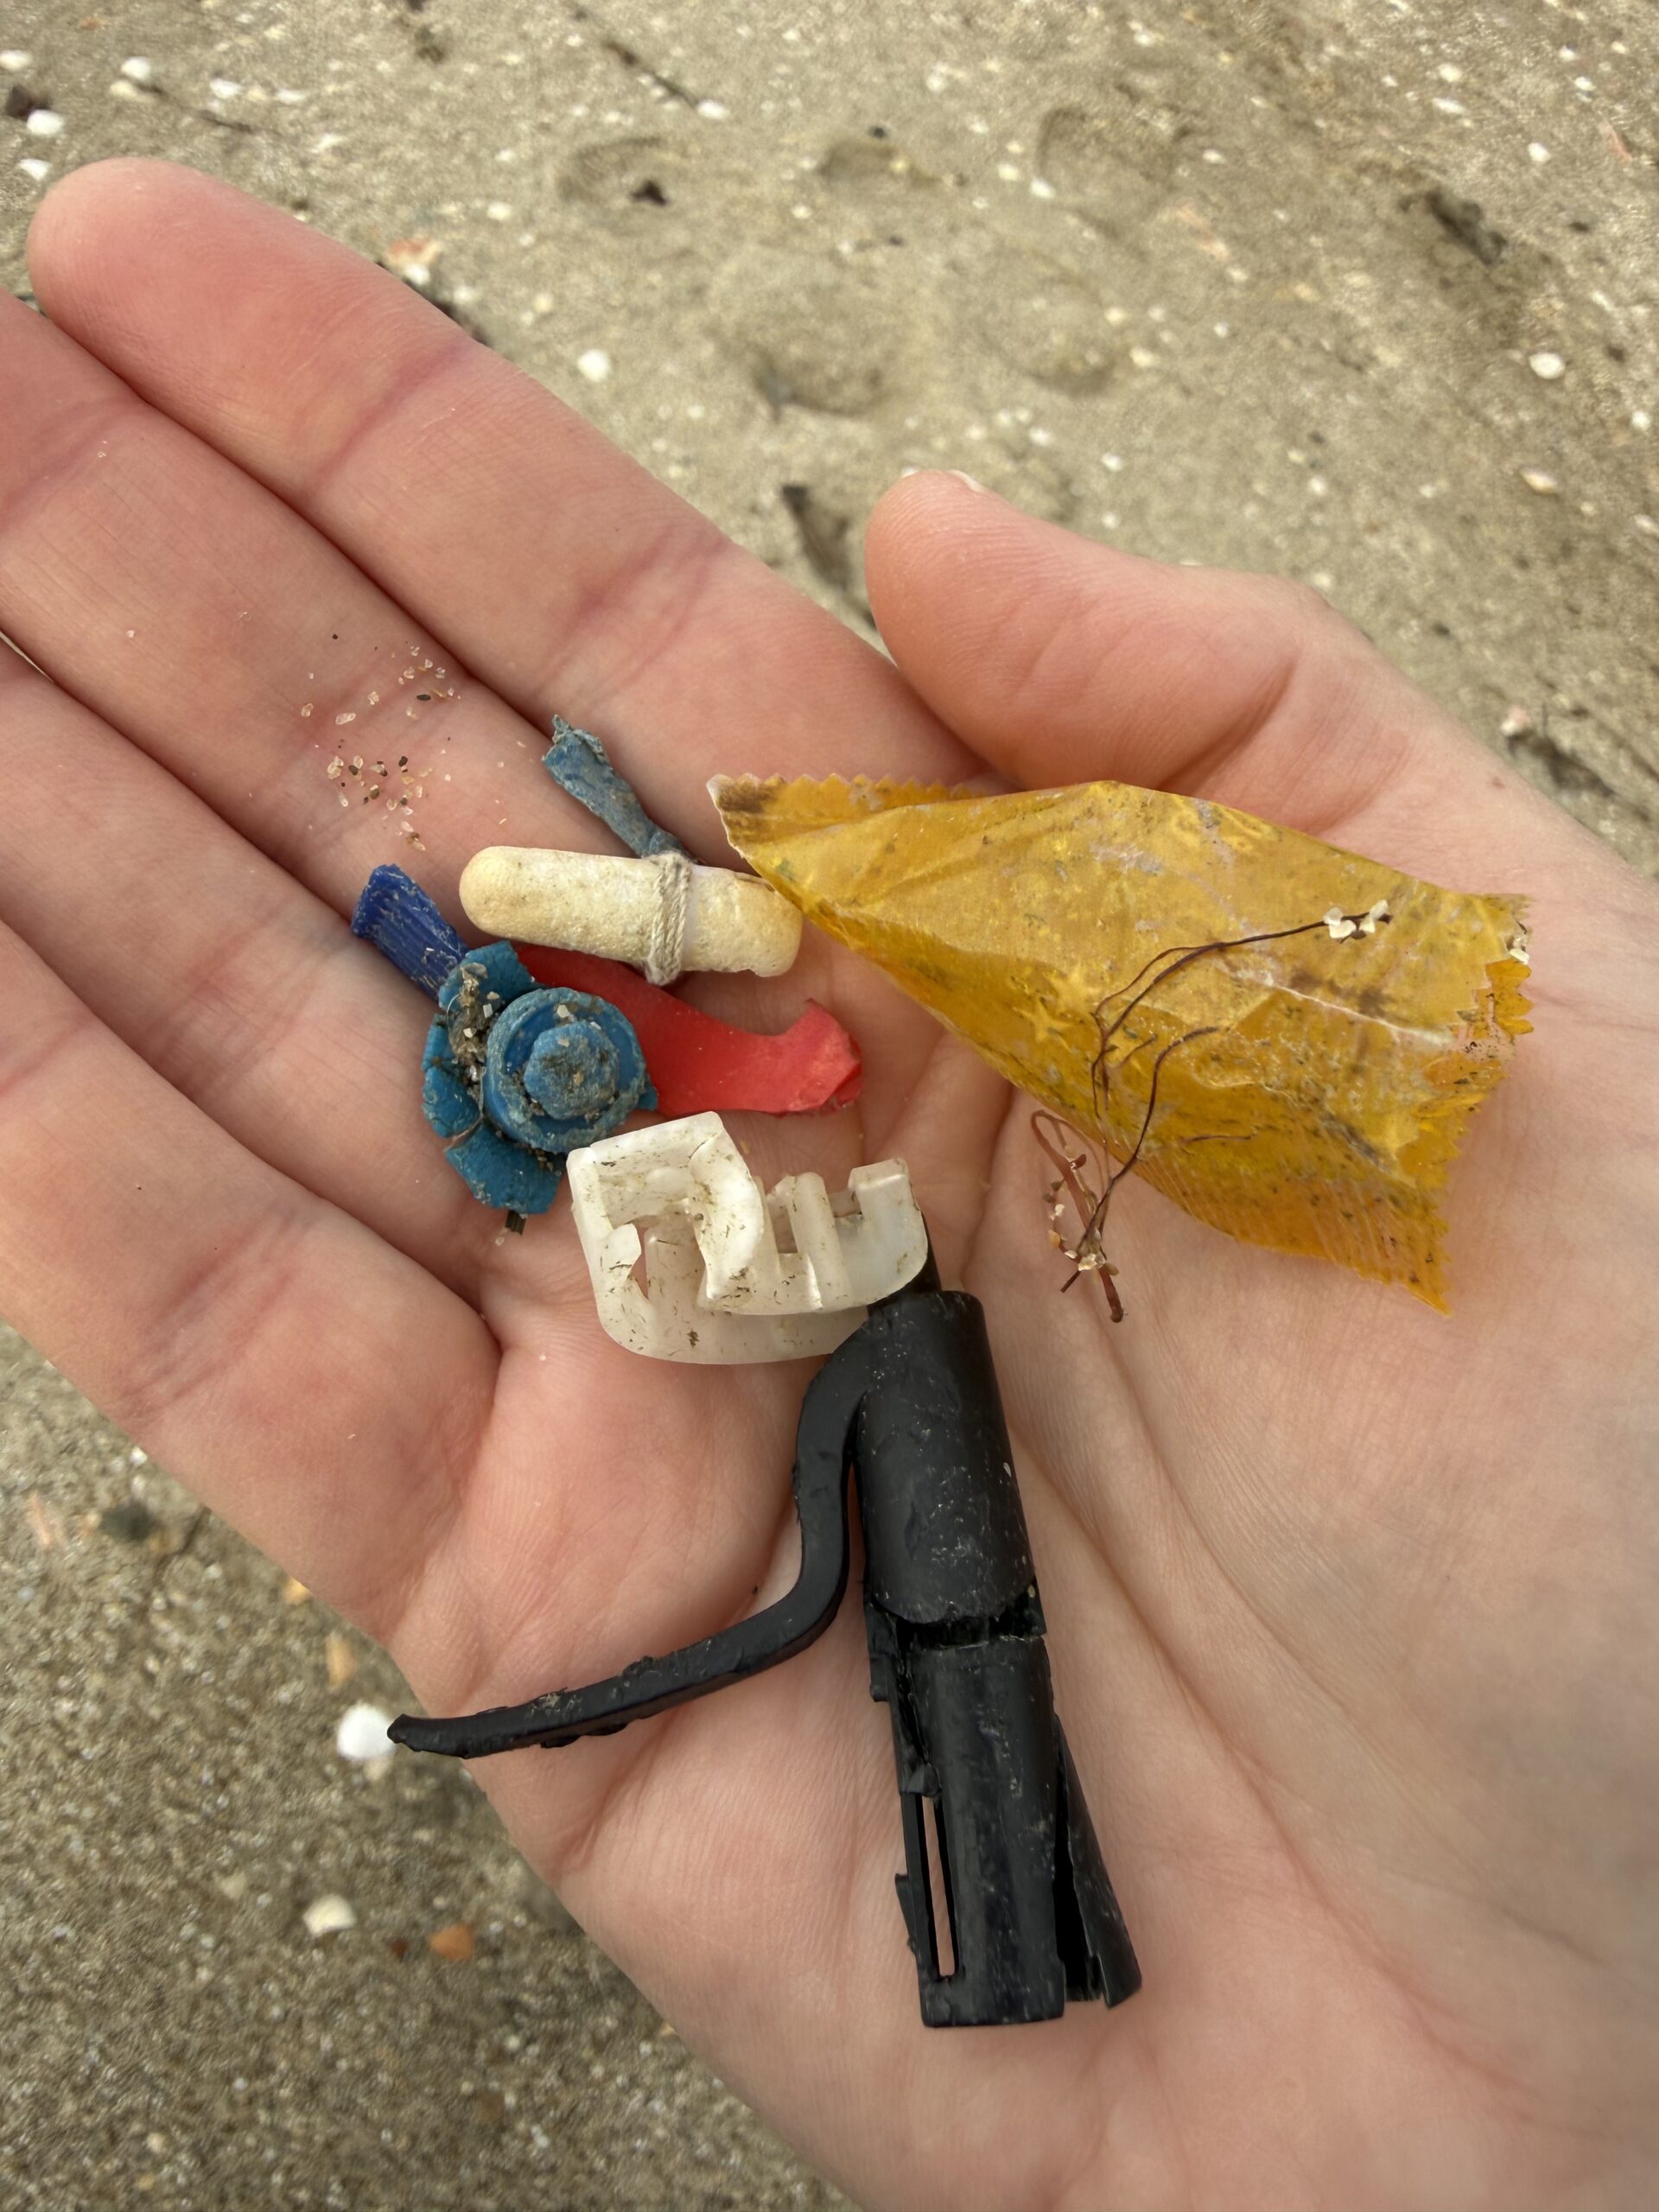
We found plastics of all shapes and sizes everywhere we went—in the city streets of Auckland, while crossing the Hauraki Gulf and even at Aotea Great Barrier Island (one of the most remote and protected stretches of New Zealand’s coastline). Our ocean is vast and some of these places felt far removed from the centers of human activity, but this eXXpedition was a good reminder that plastic doesn’t respect remoteness. It moves, accumulates and shows up where we least expect.
Working alongside local NGO Sustainable Coastlines, we arrived on a remote stretch of beach on Aotea Great Barrier Island to audit and clean up any plastics we came across. What we found there told the same story our Auckland street surveys did: We found bottle caps, food packaging, fragments, plastic pellets and fishing debris. The everyday materials of modern life—but weathered, broken and scattered.
Science at sea
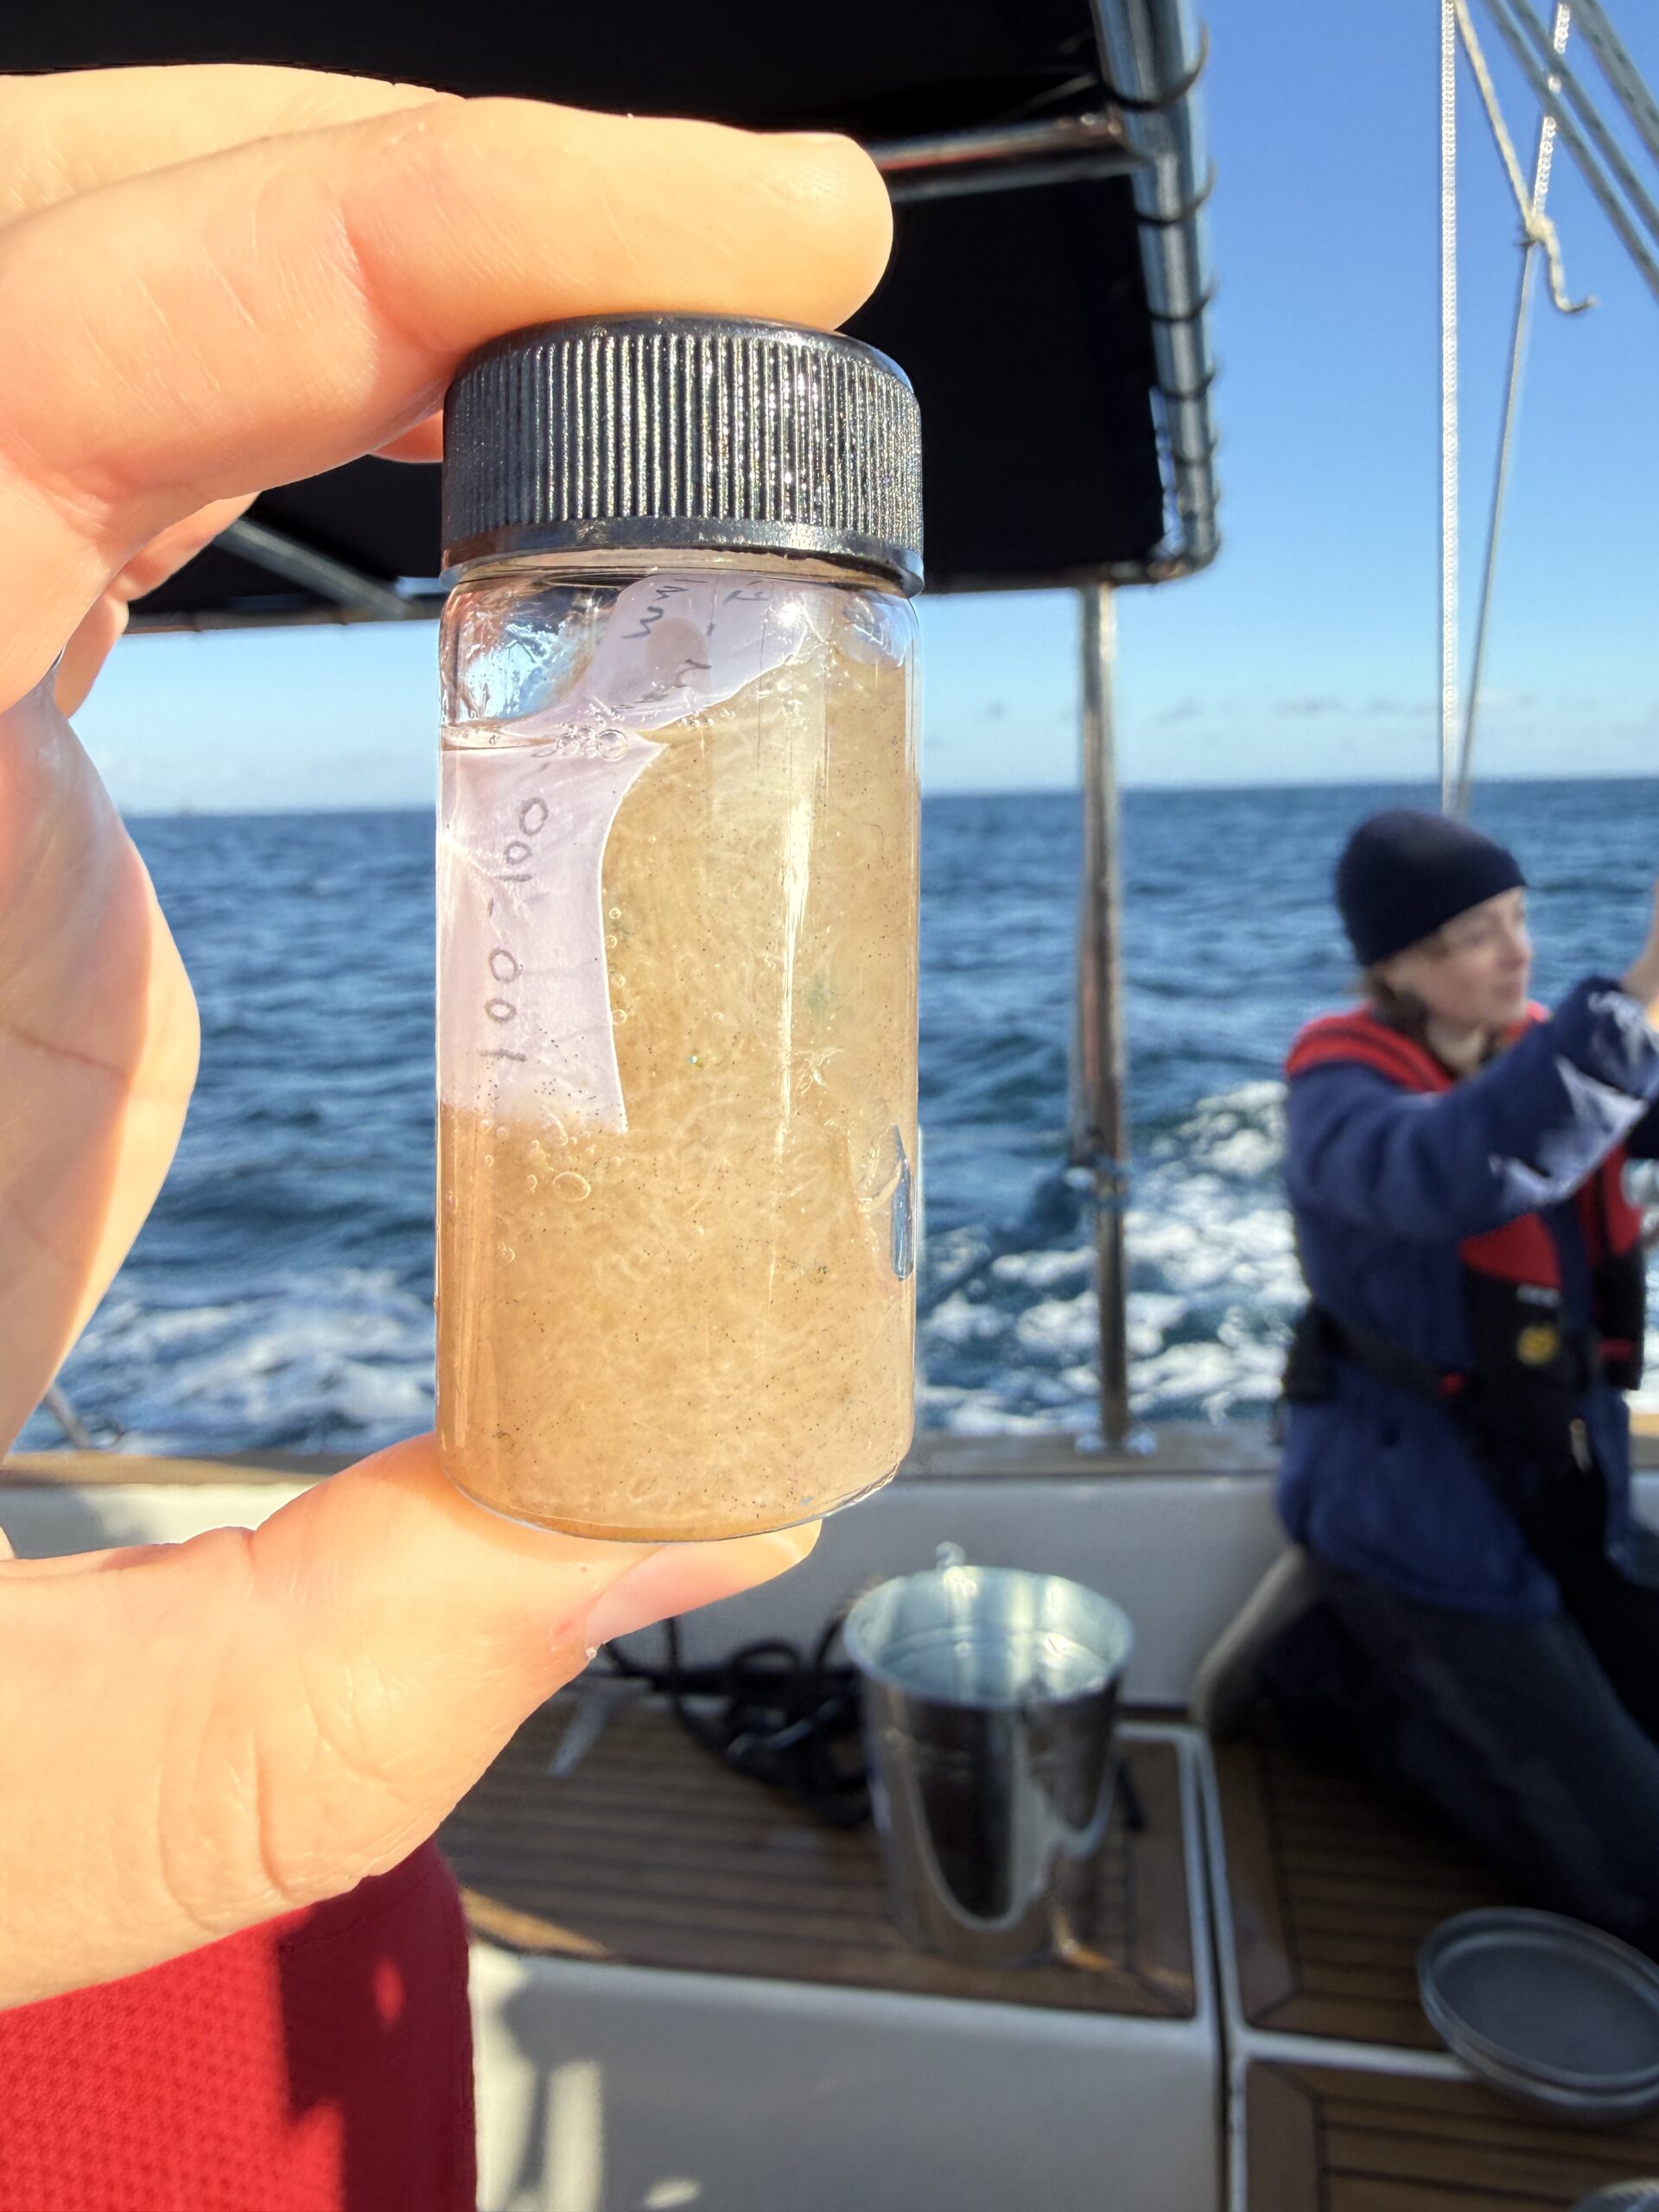
One of my favorite parts of the voyage (which was also one of the most challenging, if I’m being honest!) was the sea-surface manta trawl analyses we did onboard. I found out quickly that sorting microplastics from krill-laden seawater samples under a microscope while sailing is not for the faint of stomach.
The most common plastic culprit we found in those samples? Microplastic fibers. This type of microplastic is no wider than a human hair and is the most common type of microplastic found in the environment. Microplastic fibers can come from a variety of sources like cigarette butts, weathered ropes or wet wipes, but actually, most microplastic fibers shed from synthetic clothing and textiles. Laundering is a major source— shockingly, a single load of laundry can generate up to 18 million microfibers.
And yet, we found these tiny plastic fibers floating in the ocean many miles away from the nearest washing machine.
In my lab research, I have found microplastic fibers time and time again, but there’s something even more sobering about hand-picking them out of a seawater sample collected from pristine-looking waters. It was a good reminder of why understanding where plastic comes from, how it moves and where it ends up is so critical to addressing the problem at its roots.
Filter Out NSFW Microplastics
What I’m bringing back
Studying plastic pollution from the deck of a boat in some of the most remote waters in the Southern Hemisphere made me appreciate the work I do even more. It also made me appreciate how important people are in this giant puzzle of plastic pollution solutions. The plastic pollution crisis is a human problem, and solving it requires all of us. The courage and dedication of the women I shared those 10 days with is something I won’t forget. Going to sea, doing the science and pushing through discomfort to collect data that matters was not easy. We were seasick some days and exhilarated others. Despite that fact, we showed up for it fully, every day.
The plastic is out there, even in far-flung corners of the ocean. And the answer is not to be paralyzed by that fact, but to use it as fuel. Every sample we collected is now a data point in a larger story about where plastic comes from and where it goes. Every cleanup, every surface trawl, every street block walked and every hour spent at a microscope are parts of building the evidence base that informs policies, regulations and systems-level changes that can actually turn this crisis around.
Cleaning up beaches and coastlines is valuable and necessary work. But we also must stop plastic from entering the ocean in the first place—through stronger policy, better product design and real investment in waste management infrastructure everywhere. Luckily, when it comes to the most common microplastics in the ocean— microplastic fibers—there is already an effective, affordable solution to immediately reduce microplastics coming from our laundry by roughly 90%: washing machine filters. These filters act just like laundry lint filters in our dryers, capturing fibers in tightly-woven mesh and effectively preventing them from leaving our homes and leaking into the environment.
What can you do?
There’s no better time to tackle plastic pollution than right now, during Plastic Free July ! Take two minutes to add your name and call on your elected leaders to combat those pesky, dangerous microfibers that are pouring into our ocean daily—like the ones I found from my samples at sea. Together, we can stop plastic pollution at the source and protect our ocean forever and for everyone.
My biggest takeaways from this experience? People are remarkable. Our ocean is remarkable. And our ocean is worth fighting for, including from 70 feet of sailing vessel in the South Pacific, staring down a microscope with a pair of tweezers and a queasy stomach.
The eXXpedition South Pacific I voyage ran from April 27 to May 6, 2026, sailing from Auckland to the Bay of Islands. Learn more about the research team and our itinerary at https://exxpedition.com/voyage/auckland-to-bay-of-islands/.


The post Microplastic Pollution Research at Sea appeared first on Ocean Conservancy.
Our annual Photo Contest is officially wrapped—and wow, you delivered! More than 1,000 ocean lovers shared their incredible ocean and wildlife photos. Thank you for keeping our ocean in focus during National Ocean Month and inspiring us with your creativity.
Now it’s time to meet the favorites. See the stunning photos that captured the hearts of our judges, staff and fellow ocean lovers.
Judges Choice Winner:
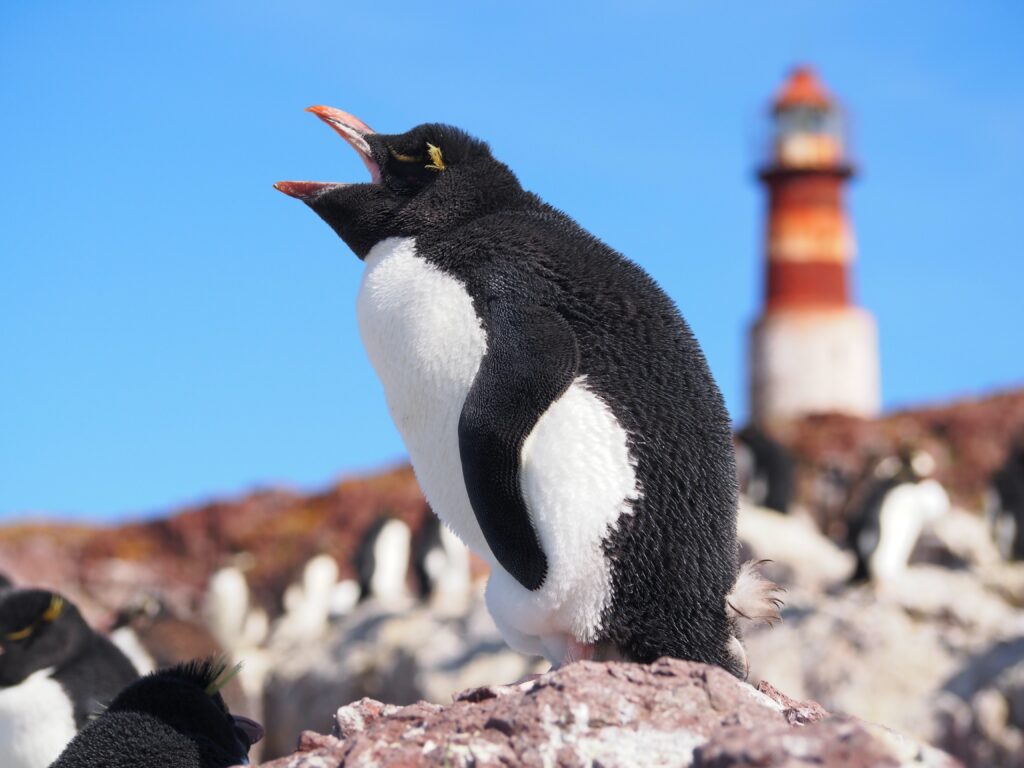
“Walrus Nursing” by Richard Rothstein
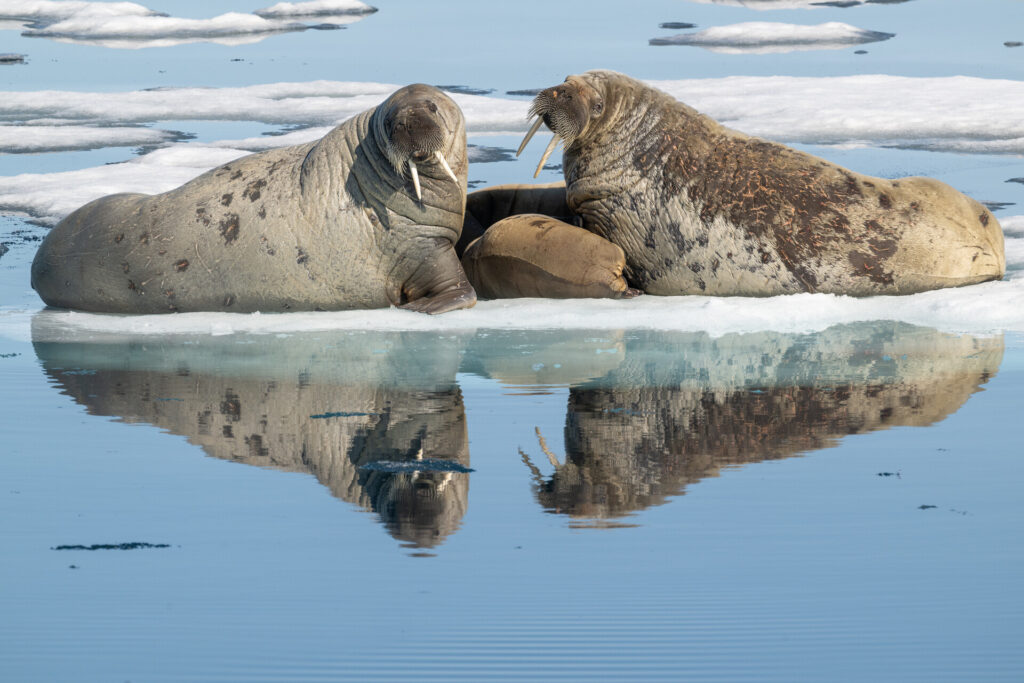
Our group was in a small skiff slowly moving among the icebergs when we came upon the scene in the image. Two female walruses were in what appeared to be a protective posture as one of the females was nursing a small calf. We remained a very respectable distance and did not approach. The walruses seemed to completely tolerate our presence as there appeared to be no alteration of their natural behavior. This was my first encounter with walruses, and it was truly an experience of a lifetime!!
A word from the judges:
“There’s such tenderness in this Arctic moment—two adult walruses framing the calf nursing between them, all mirrored in the glassy meltwater below. That reflection doubles the impact and gives the composition a beautiful symmetry, and the soft, even light shows off every wrinkle and whisker. A quiet, intimate family portrait set against the fragile backdrop of the sea ice these animals depend on.” – Angela J. Farmer
“I love this photograph! The composition is excellent with the reflections and the ice bergs in the background balancing the photograph. I also appreciate that the photographer captured this photo and it does not appear like the animals were stressed out in any way. They are acting and behaving natural in their natural habitat. Very important to me as a photographer to not disturb the animals by my presence. Good job!” – Harvey Hergett
“…Really beautiful and powerful. I loved the calm moment, the reflection and the connection between the walruses. It feels very natural, honest and emotional.” – Andrés Ballesteros
Staff Choice Winner:
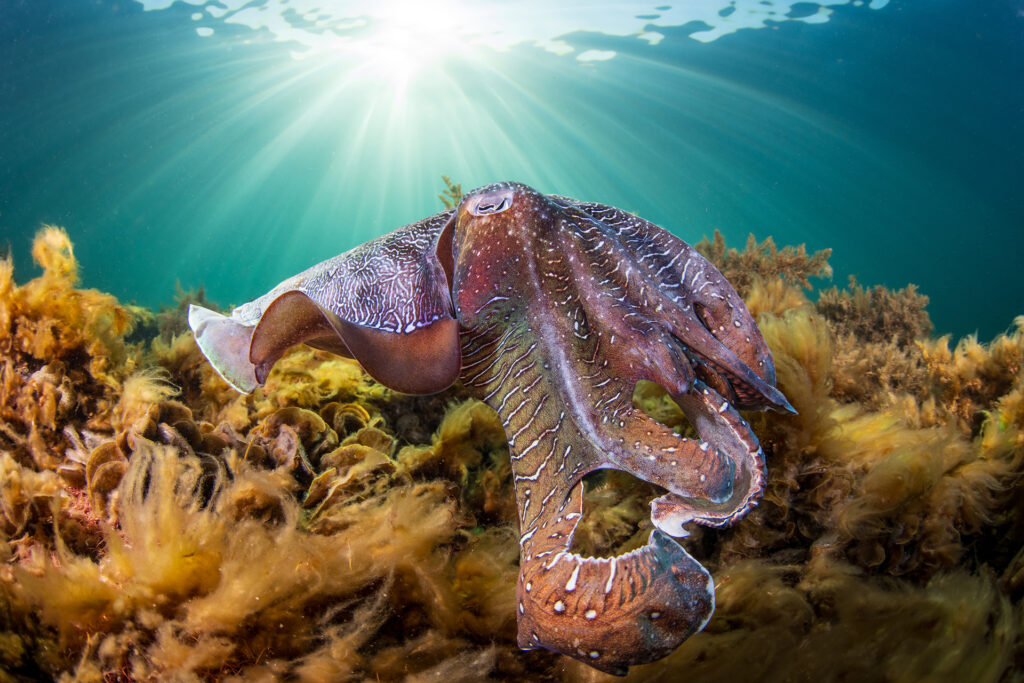
“The Lone Ranger” by Rowan Dear
(Rowan’s Instagram; Rowan’s Website)
A large male Giant Cuttlefish cruises around the shoreline of Whyalla, looking for a mate this season. Most of the Cuttlefish here are smaller and similar size to the females, however you will see some very large males who are 3-4 times the size of some males who will swim around and bully and dominate the other males and sometimes guard up to 3 females. The larger males are probably 2 years old and have been eating their way through summer waiting for the mating season in winter.
A word from the judges:
“This is an absolute showstopper—the sunburst breaking through the surface turns an ordinary dive into something almost cinematic. The cuttlefish’s intricate textures and shifting purple-to-copper tones are stunning, and the way the light rays guide your eye right down to it shows real mastery of natural underwater lighting. A rich, immersive image that makes you feel like you’re in the water with him.” – Angela J. Farmer
“I liked the angle of the shot as shooting upward on the subject gives it a more majestic feel.” – Harvey Hergett
People’s Choice Winner:
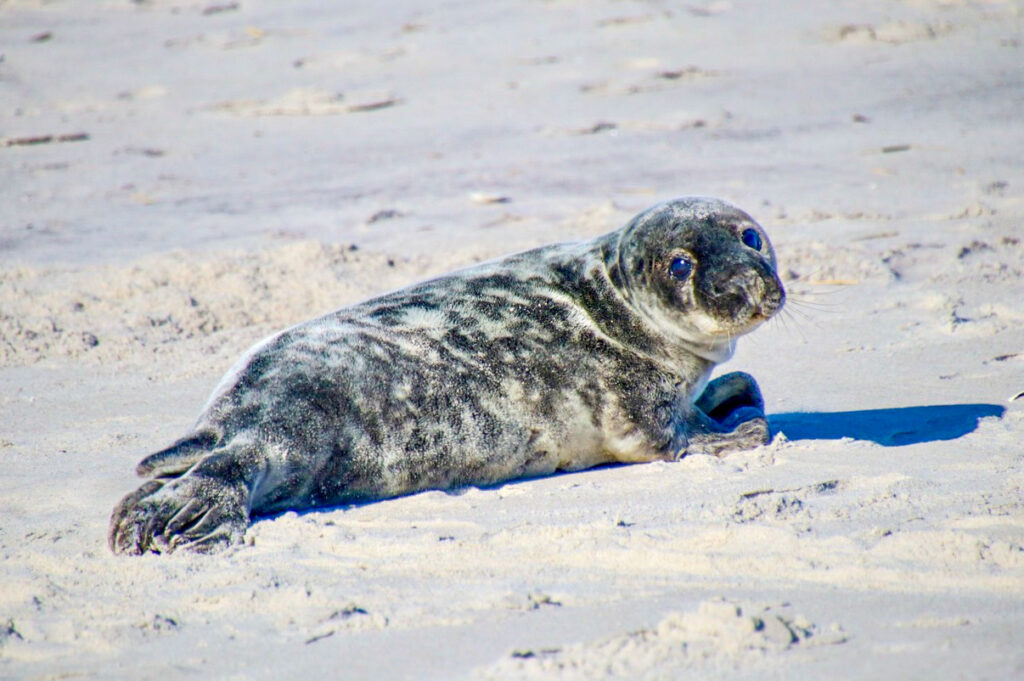
“Sweet Seal” by Nicole Pellegrino
(Nicole’s Instagram; Nicole’s Website)
This sweet seal was resting on the shore of Long Beach, NY on a bright sunny day in April 2024.
A huge thank you to everyone who entered, voted, shared and cheered on this year’s contest. And a mighty thanks to our expert judges: Angela J. Farmer, Harvey Hergett and Andrés Ballesteros. Congratulations to all our talented photographers—we can’t wait to see what you capture in 2027!
Enjoy the contest’s honorable mentions below and we’ll SEA you next year.
The post 2026 Ocean Conservancy Photo Contest Winners appeared first on Ocean Conservancy.
https://oceanconservancy.org/blog/2026/06/30/2026-photo-contest-winners/
Color Theory
Look at this core below (figure 1) and describe the colors and values you see.
Fig. 1) A small section of core: 401-U1611B-41R-2W from expedition 401
Some dark gray stripes, some light gray stripes, maybe some yellowish tones in the lightest stripes. Congratulations! You are applying color theory. Color theory is about describing the behavior of colors, such as mixing, color contrast, and color harmony. How colors look together and how they’re made is the basics of color theory application. It is often used by painters, but color theory is not just applicable for artists. It is necessary for the scientific world, including analysis of the ocean floor. Color theory is used as an aid for the functional applications of color as a science. To practice color science we need to first understand the international standards and practices for imaging.
In color science, we use CIELAB which stands for Commission International de l’Eclairage, or the International Commission on Illumination. They provide the recommendations for lighting, vision, color, and imaging. L*a*b* (pronounced “L star”, “a star”, and “b star”) stands for the coordinates that define a color numerically. The a* and b* signals relate to color, or chromaticity. A is related to redness or greenness. This means that a positive “a*” value (+a*) is more red, and a negative “a*” value (-a*) is more green. B is related to yellowness or blueness, so +b* is more yellow, and -b* is more blue. The values of a* and b* range from -128 to 128. The L* is the lightness channel and represents a value (black to white). L* is on a scale from 0-100, 0 being the whitest white we perceive, and 100 being the blackest black. The color of something can be found in this represented 3-axis model (figure 2).
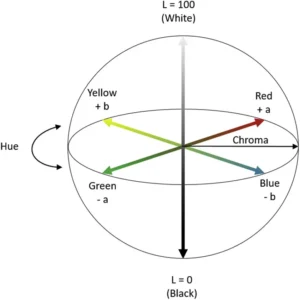
Fig. 2) model of the CIELAB color space using 3-axis
CIELAB is designed to approximate human vision and is great for perceiving small differences in color. Unlike RGB or CMYK, the colors CIELAB defines are not defined by a monitor or printer, but instead relate to the CIE standard observer. The standard observer is an averaging of the results of color matching experiments under that particular laboratory’s conditions to create a set base value for future reflectance recordings. For ocean coring, machines like the Section Half Multisensor Logger (SHMSL) use the CIELAB system for imaging cores.
The SHMSL
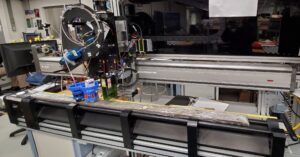
Fig 3.) photo of the Section Half Multisensor Logger on the JOIDES Resolution scanning an ocean core.
The SHMSL measures two things, spectral reflectance and magnetic susceptibility. These are used to create core descriptions. Since the SHMSL uses CIELAB, it requires a standard observer to set the “base” values. To set the standard observer, the SHMSL has a color reflectance control set (figure 4). The reflectance control set is similar to the ColorChecker used in professional photography (figure 5). These color patches have a known spectral reflectance value and are designed to mimic the values of natural objects, or in this case potential sediment and hard rock colors. The SHMSL is calibrated using this control set and a white standard. It then uses this recorded reflectance value to adjust future values.
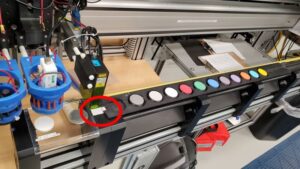
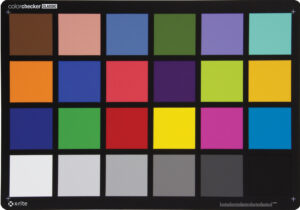
Fig. 4) A photo of the SHMSL color reflectance control set (left). Fig. 5) A photo of the Macbeth ColorChecker commonly used in photography (right).
Once calibrated and properly set up, the SHMSL is ready to read a core! Below is a finished reading of a core (figure 6). The three graphs at the bottom show the L*, a*, and b* values along the length of the core.
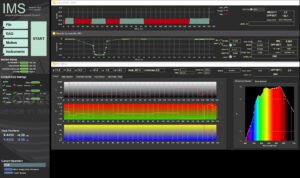
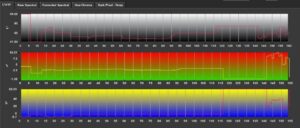
Fig. 6.1) Main IMS- SHMSL Data Acquisition Display (top). Fig 6.2) A zoomed in photo of the Main IMS- SHMSL Data Acquisition Display focusing only on the L*a*b* graph (bottom).
The numbers at the bottom of each L*, a*, and b* graphs match with the length of the core in cm. For example, at 20cm this reading shows that the core had a L* value above 80, an a* value around -30, and a b* value of around 47. This means the color was lighter in value, more green than red and more yellow than blue. A color with these values looks roughly like this (figure 7):

Fig. 7) A photo of a pale, yellow-greenish color.
Machines like the SHMSL are important for identifying colors on ocean cores. As we humans age, the differences in color vision grow wider due to the yellowing of our lens over time. A person in their 50s will see colors in a more yellow tint than someone in their teens due to aging. The SHMSL sets a standard for the lighting and imaging in the laboratory, narrowing the divide to provide the most accurate reading of color on the core possible.
Applying to the core
So now we know how to read the machine, but what does the color of an ocean core actually tell us? Color differences are used to quantify how an object’s color can change over time from light exposure, heat, and humidity. In the case of ocean cores, “spectral data can be used to estimate the abundances of certain compounds,” (TAMU). This means, the light values of a core may tell us about potential organic content. For example, green cores may be an indication of glauconite (depending on location and geological time) which could indicate an ancient shallow marine environment. Look back at figure one. Based on what we know of this area of the ocean floor, this type of color contrast and coloration is a clear example of a dolomotisation sequence (the formation of dolomite). Colors are powerful tools used for studying our oceans, and our oceans are full of colorful knowledge waiting for those with eyes to see it.
Sources:
- Berns, R. S. (2016). Color science and the visual arts a guide for conservators, curators, and the curious. Los Angeles Getty Conservation Institute.
- TAMU. (2026). GCR Section Half Multisensor Core Logger (SHMSL) User Guide. Atlassian.net; Texas A&M University. https://tamu-eas.atlassian.net/wiki/spaces/LMUG/pages/7341017839/SHMSL+User+Guide. Updated 06 March 2026
- Erick Bravo, Imaging Specialist for X401 aboard the JOIDES Resolution. Accessed 28 June 2026.
- Ly, Bao & Dyer, Ethan & Feig, Jessica & Chien, Anna & Bino, Sandra. (2020). Research Techniques Made Simple: Cutaneous Colorimetry: A Reliable Technique for Objective Skin Color Measurement. The Journal of investigative dermatology. 140. 3-12.e1. 10.1016/j.jid.2019.11.003.
- Macbeth ColorChecker. (2026). Imatest.com. https://www.imatest.com/wp-content/uploads/2022/01/msccc_colorchecker_classic_front.jpg
- Banaś, W. (2024). Convert LAB to RGB – colordesigner.io. Colordesigner.io. https://colordesigner.io/convert/labtorgb
Image sources:
Figure 1: Source 3
Figure 2: Source 4
Figure 3-4,6: Source 2
Figure 5: Source 5
Figure 7: Source 6
Written by OCA 2026 Mentor, Kellan Moss


As food shocks spread, citizens are showing more leadership than governments

The Northern Endeavour Saga: Decommissioning, Legal Loopholes, and Toxic, Hazardous Waste

Tropical forest protection fund at risk after UK stalls on pledge
-
Climate Change11 months ago
Guest post: Why China is still building new coal – and when it might stop
-
Greenhouse Gases11 months ago
Guest post: Why China is still building new coal – and when it might stop
-

 Greenhouse Gases2 years ago
嘉宾来稿:满足中国增长的用电需求 光伏加储能“比新建煤电更实惠”
-

 Climate Change2 years ago
嘉宾来稿:满足中国增长的用电需求 光伏加储能“比新建煤电更实惠”
-

 Renewable Energy8 months ago
Sending Progressive Philanthropist George Soros to Prison?
-
Climate Change2 years ago
Bill Discounting Climate Change in Florida’s Energy Policy Awaits DeSantis’ Approval
-

 Carbon Footprint2 years ago
US SEC’s Climate Disclosure Rules Spur Renewed Interest in Carbon Credits
-
Greenhouse Gases12 months ago
嘉宾来稿:探究火山喷发如何影响气候预测