What do you think about when you hear the words “microplastic pollution?” Your mind may immediately go to imagery of colorful fragmented plastics broken off from bottles, buckets and other items we use in our everyday lives. Or, perhaps, you imagine a pile of microplastic fibers—the tiny, squiggly, spaghetti-shaped plastics that shed from our synthetic clothing. You may be surprised to hear there is another major source of microplastic pollution that’s hiding in plain sight, quite literally under our feet, that might change how you think about microplastics: tire particles.
We all know tires wear down over time—that’s why we have to replace them on our cars roughly every 60,000 miles or so. Every time a vehicle accelerates, brakes or simply drives down the road, the friction between its tires and the pavement creates tiny fragments of rubber, known as tire wear particles.
Driving a car or even riding in a bus is a bit like dragging an eraser across the planet, except the crumbs are microplastics. Toxic microplastics.
Tires are made from a complex mix of natural and synthetic rubber along with a range of additives, fillers and chemical compounds—some of which, like the preservative 6PPD, have been shown to be highly toxic to coho salmon when they break down into derivative product 6PPD-Q in the environment—even in tiny concentrations.
Some studies have shown that a single vehicle’s tires can emit more than two trillion particles per mile driven—and that the average person generates nearly two pounds of tire particles per year! Once these particles are shed from tires, they don’t just disappear. Some are small and light enough to become airborne, drifting away from roadways as dust. Others settle on road surfaces, where they accumulate until the next heavy rain washes them into storm drains and from there, into streams, rivers and eventually the ocean.
That’s why tire wear particles are now considered one of the top sources of microplastics to the environment. In fact, until recent developments in analytical methods, scientists weren’t reliably able to detect tire wear particles in microplastic counts—thus, these pesky microplastics may have been evading our detection for years.
Why green infrastructure may be one of our best near-term solutions
Unlike some sources of plastic pollution, we can’t simply stop driving overnight. Reformulating tire rubber to be less toxic or shed less material, while promising, will take time to develop, test and scale across the global vehicle fleet. So, what can we do about tire wear particle pollution right now?
This is where green infrastructure comes in. Green infrastructure refers to engineered natural systems (things like bioswales, rain gardens, roadside buffers and permeable pavement) that are designed to slow down, filter and treat stormwater before it reaches rivers, lakes and coastlines. Instead of routing runoff directly into storm drains and out to sea, green infrastructure gives contaminated water a chance to percolate through soil, plants and other natural filtration media, which helps trap microplastics, including tire wear particles, preventing them moving further downstream.
Early research on green infrastructure has been promising, showing that these systems are quite effective at capturing microplastics and other contaminants carried in road runoff. But there’s a critical piece we still don’t fully understand: What would it take to scale up green infrastructure across an entire city, and how much of a dent would that actually make in long-term tire wear particle pollution?
Our research on green infrastructure capture of tire wear particles
Funded by the Tire Industry Project, our plastics science and policy teams at Ocean Conservancy have partnered with the University of Toronto on a new study evaluating the costs and benefits of scaling up green infrastructure at the city level specifically to capture tire wear particles.
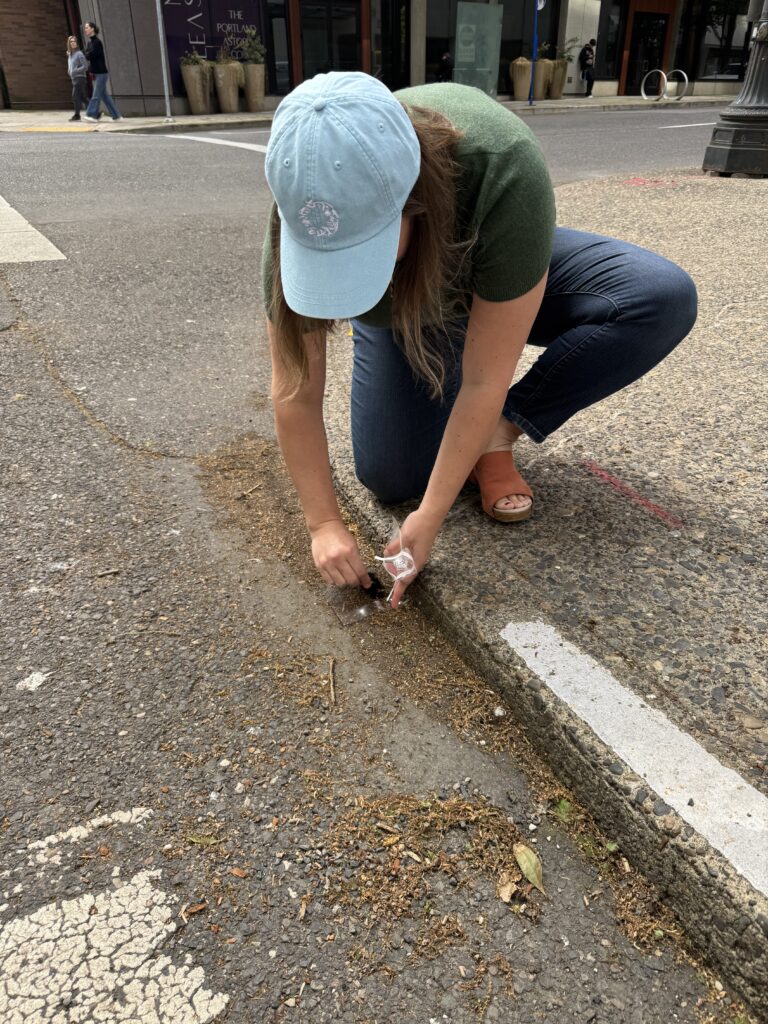
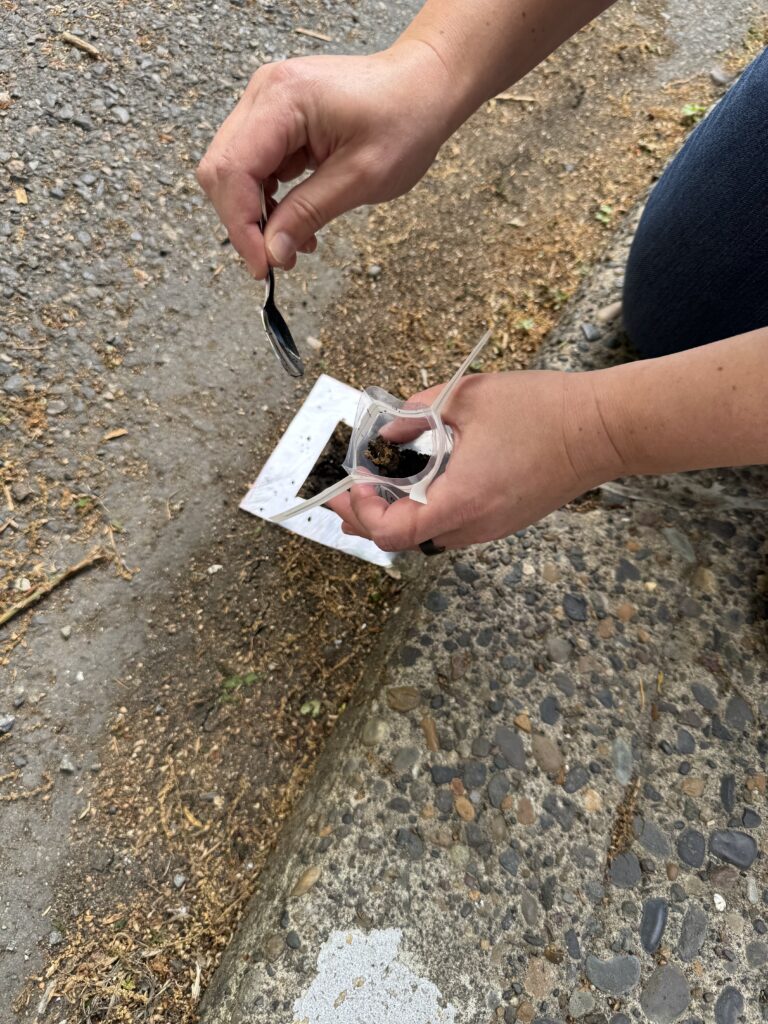
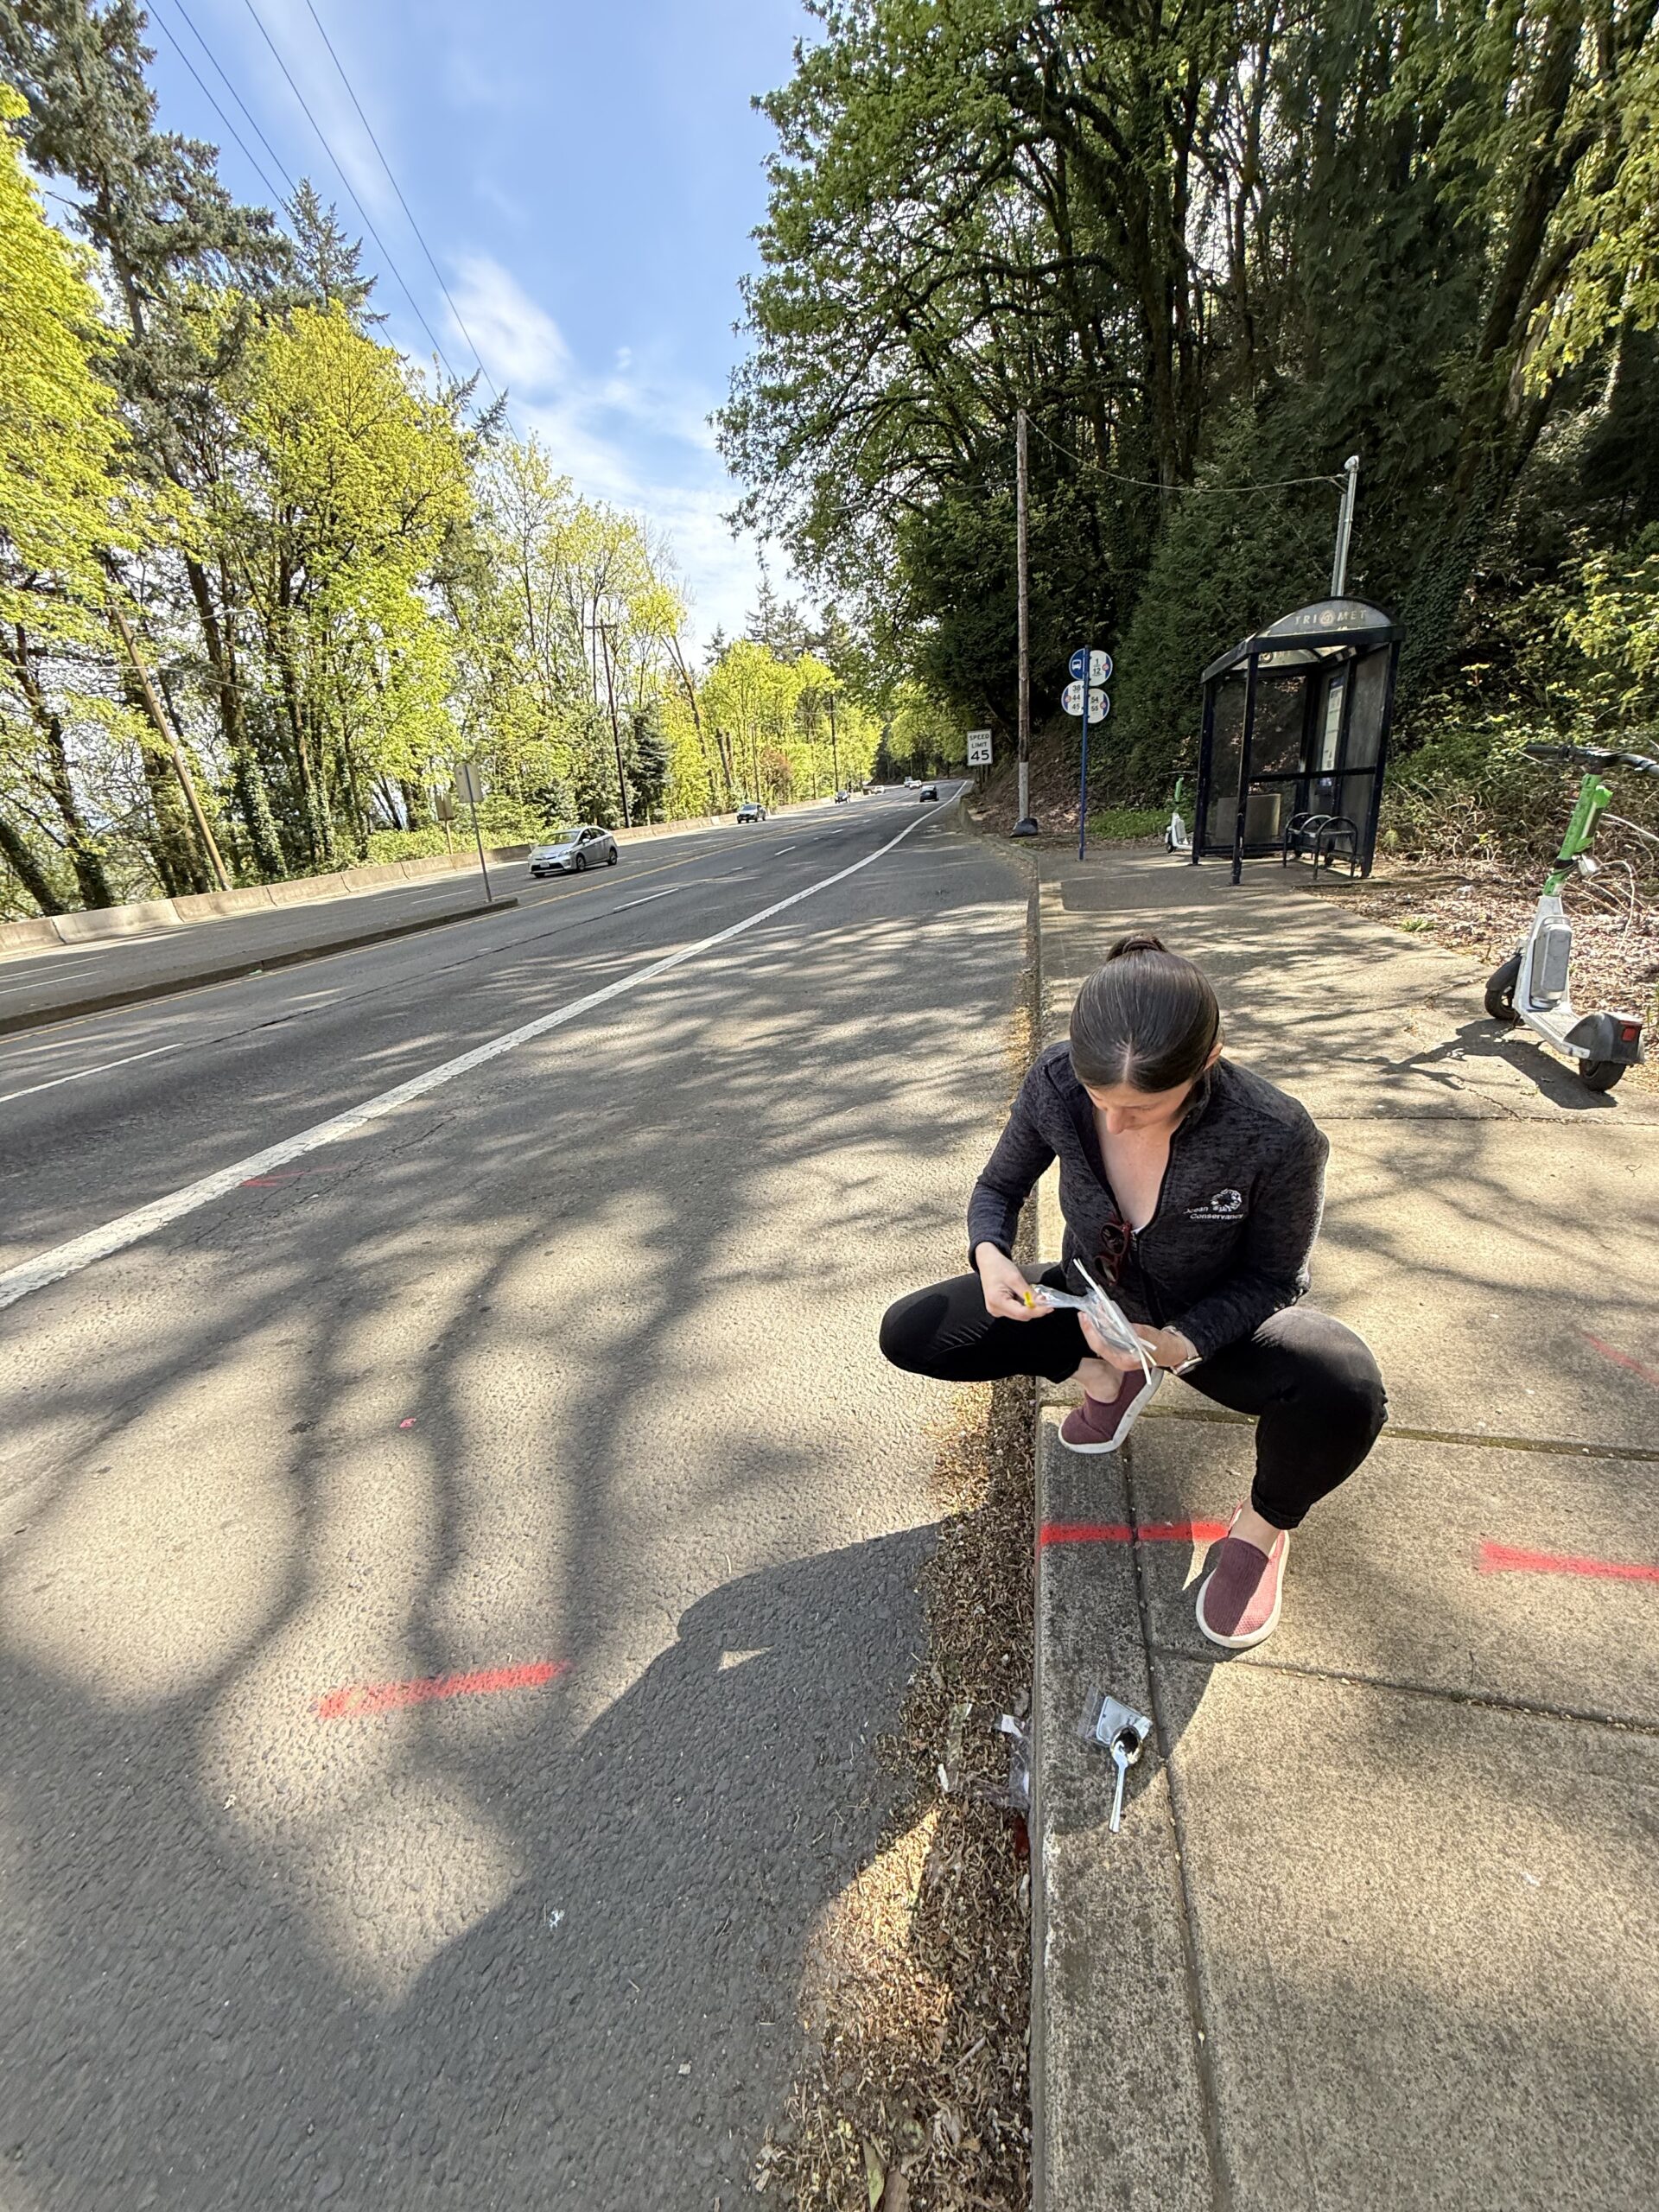
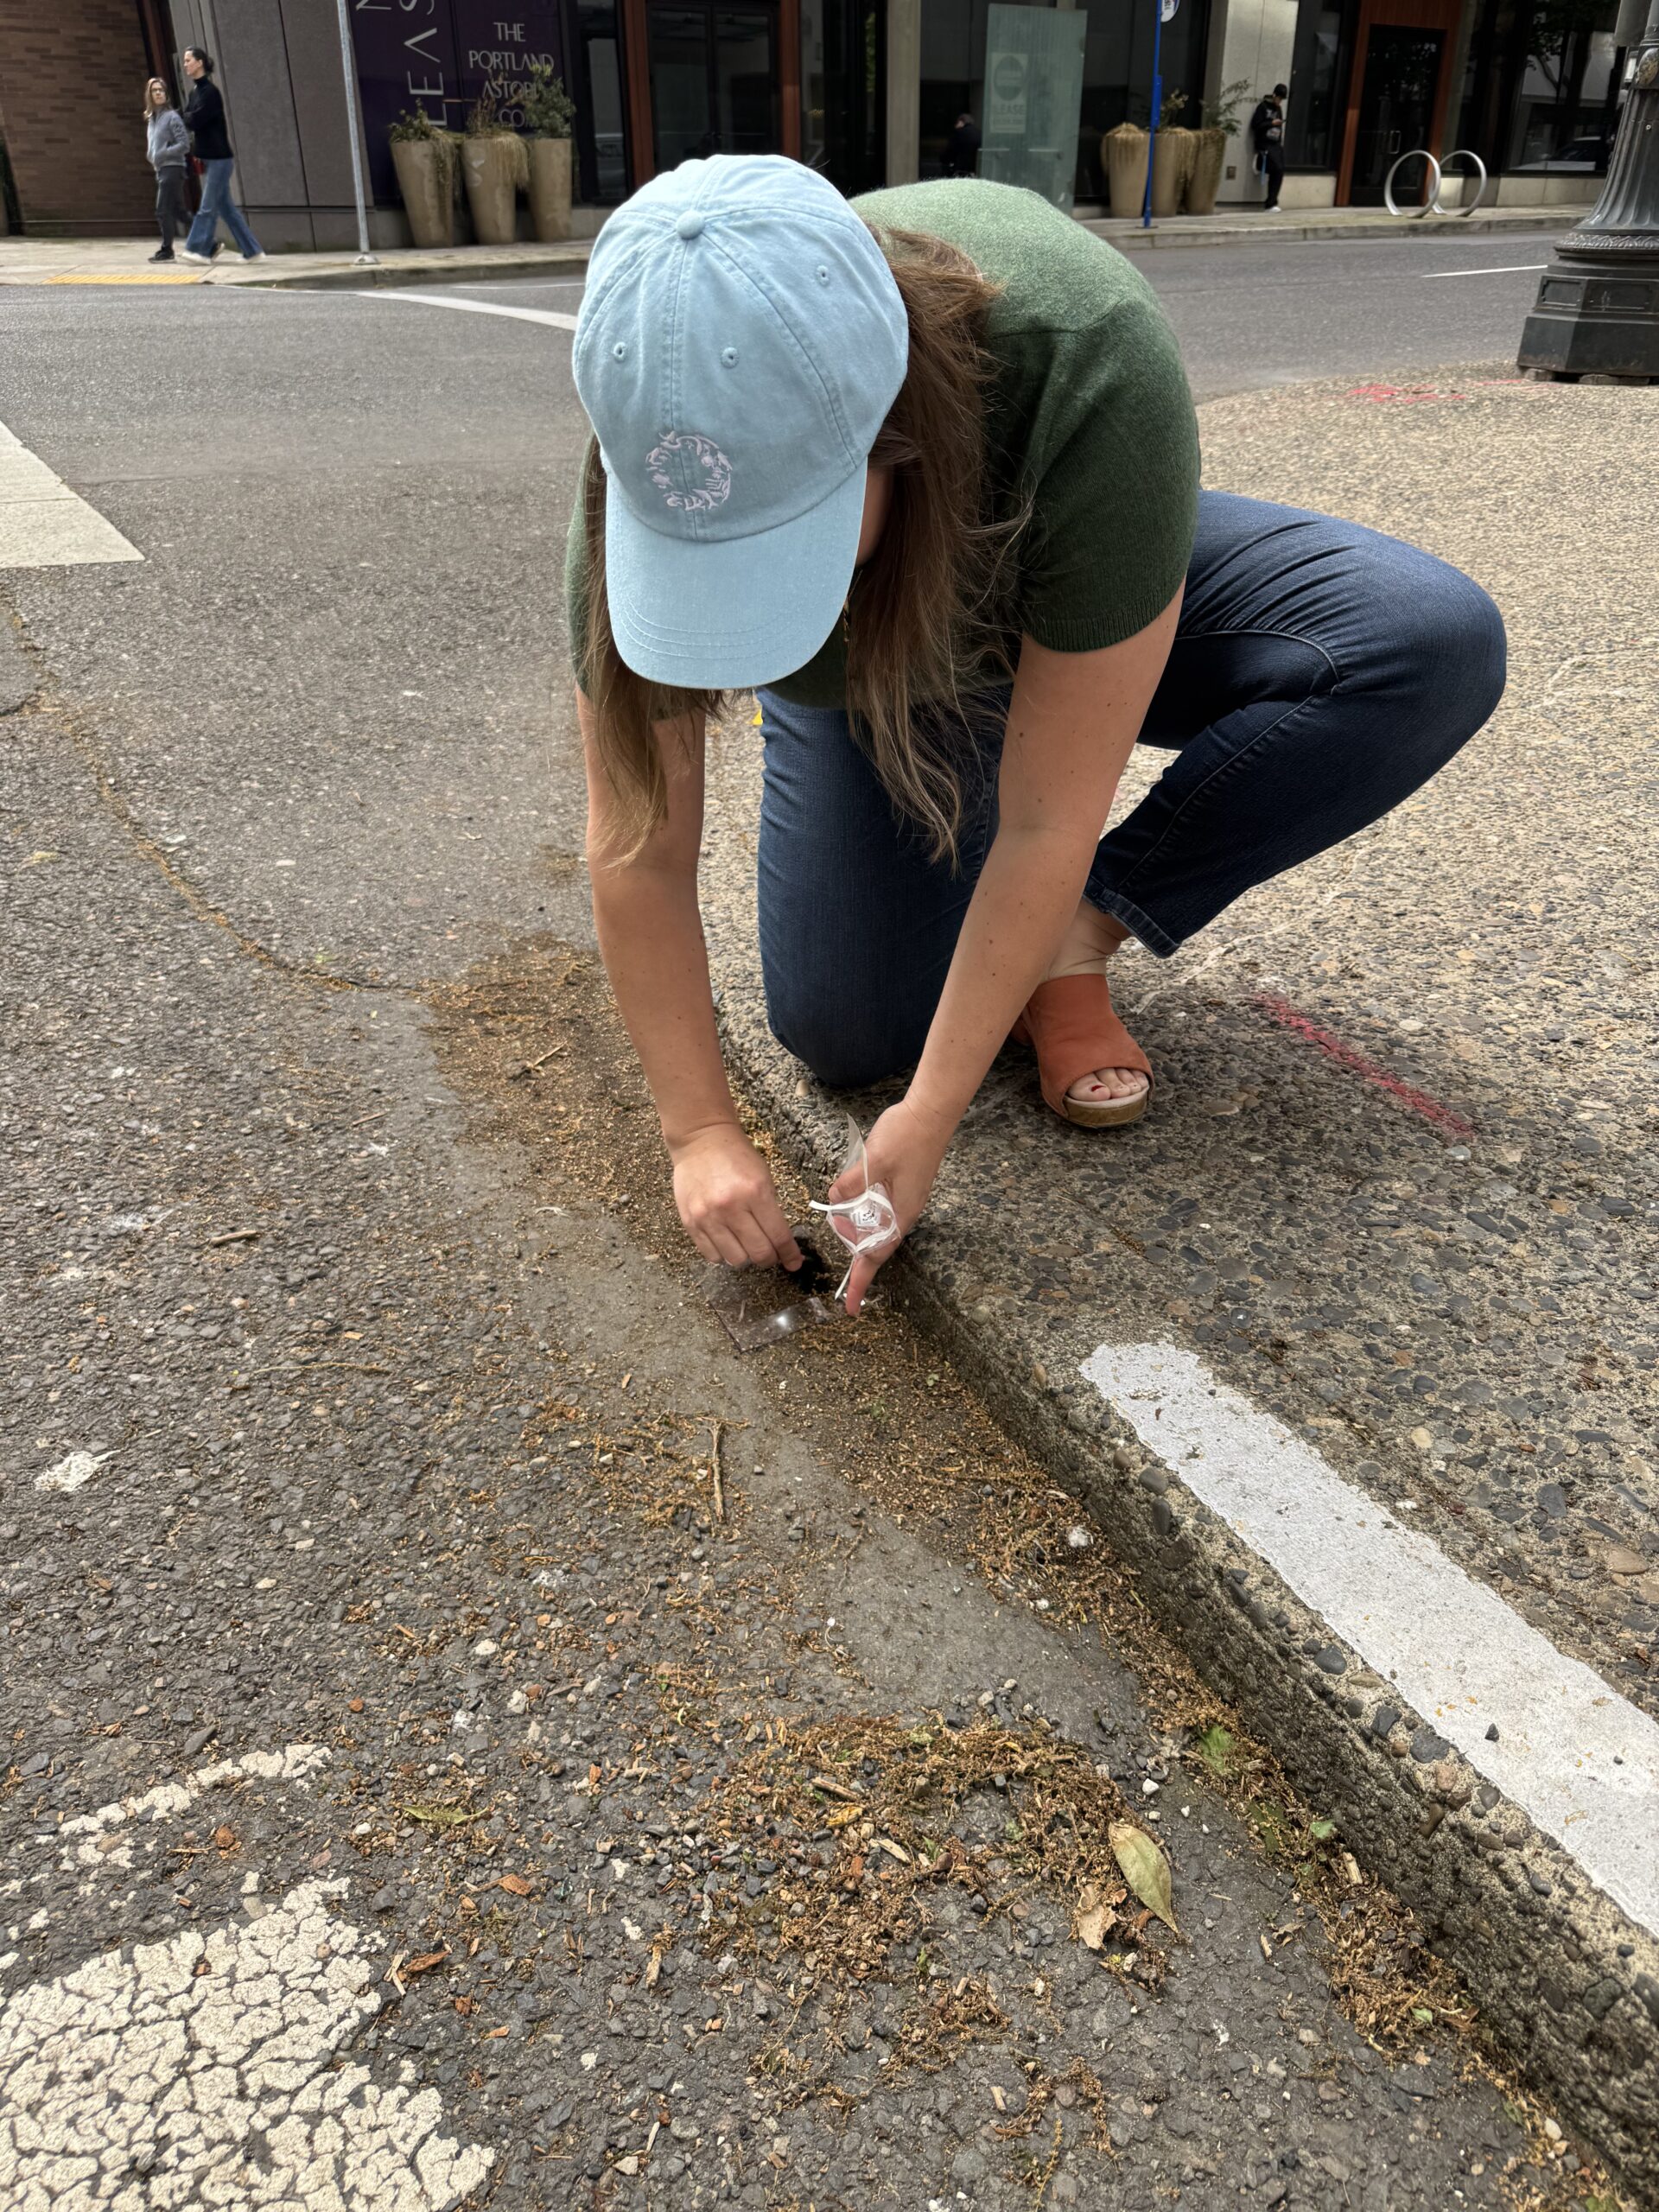
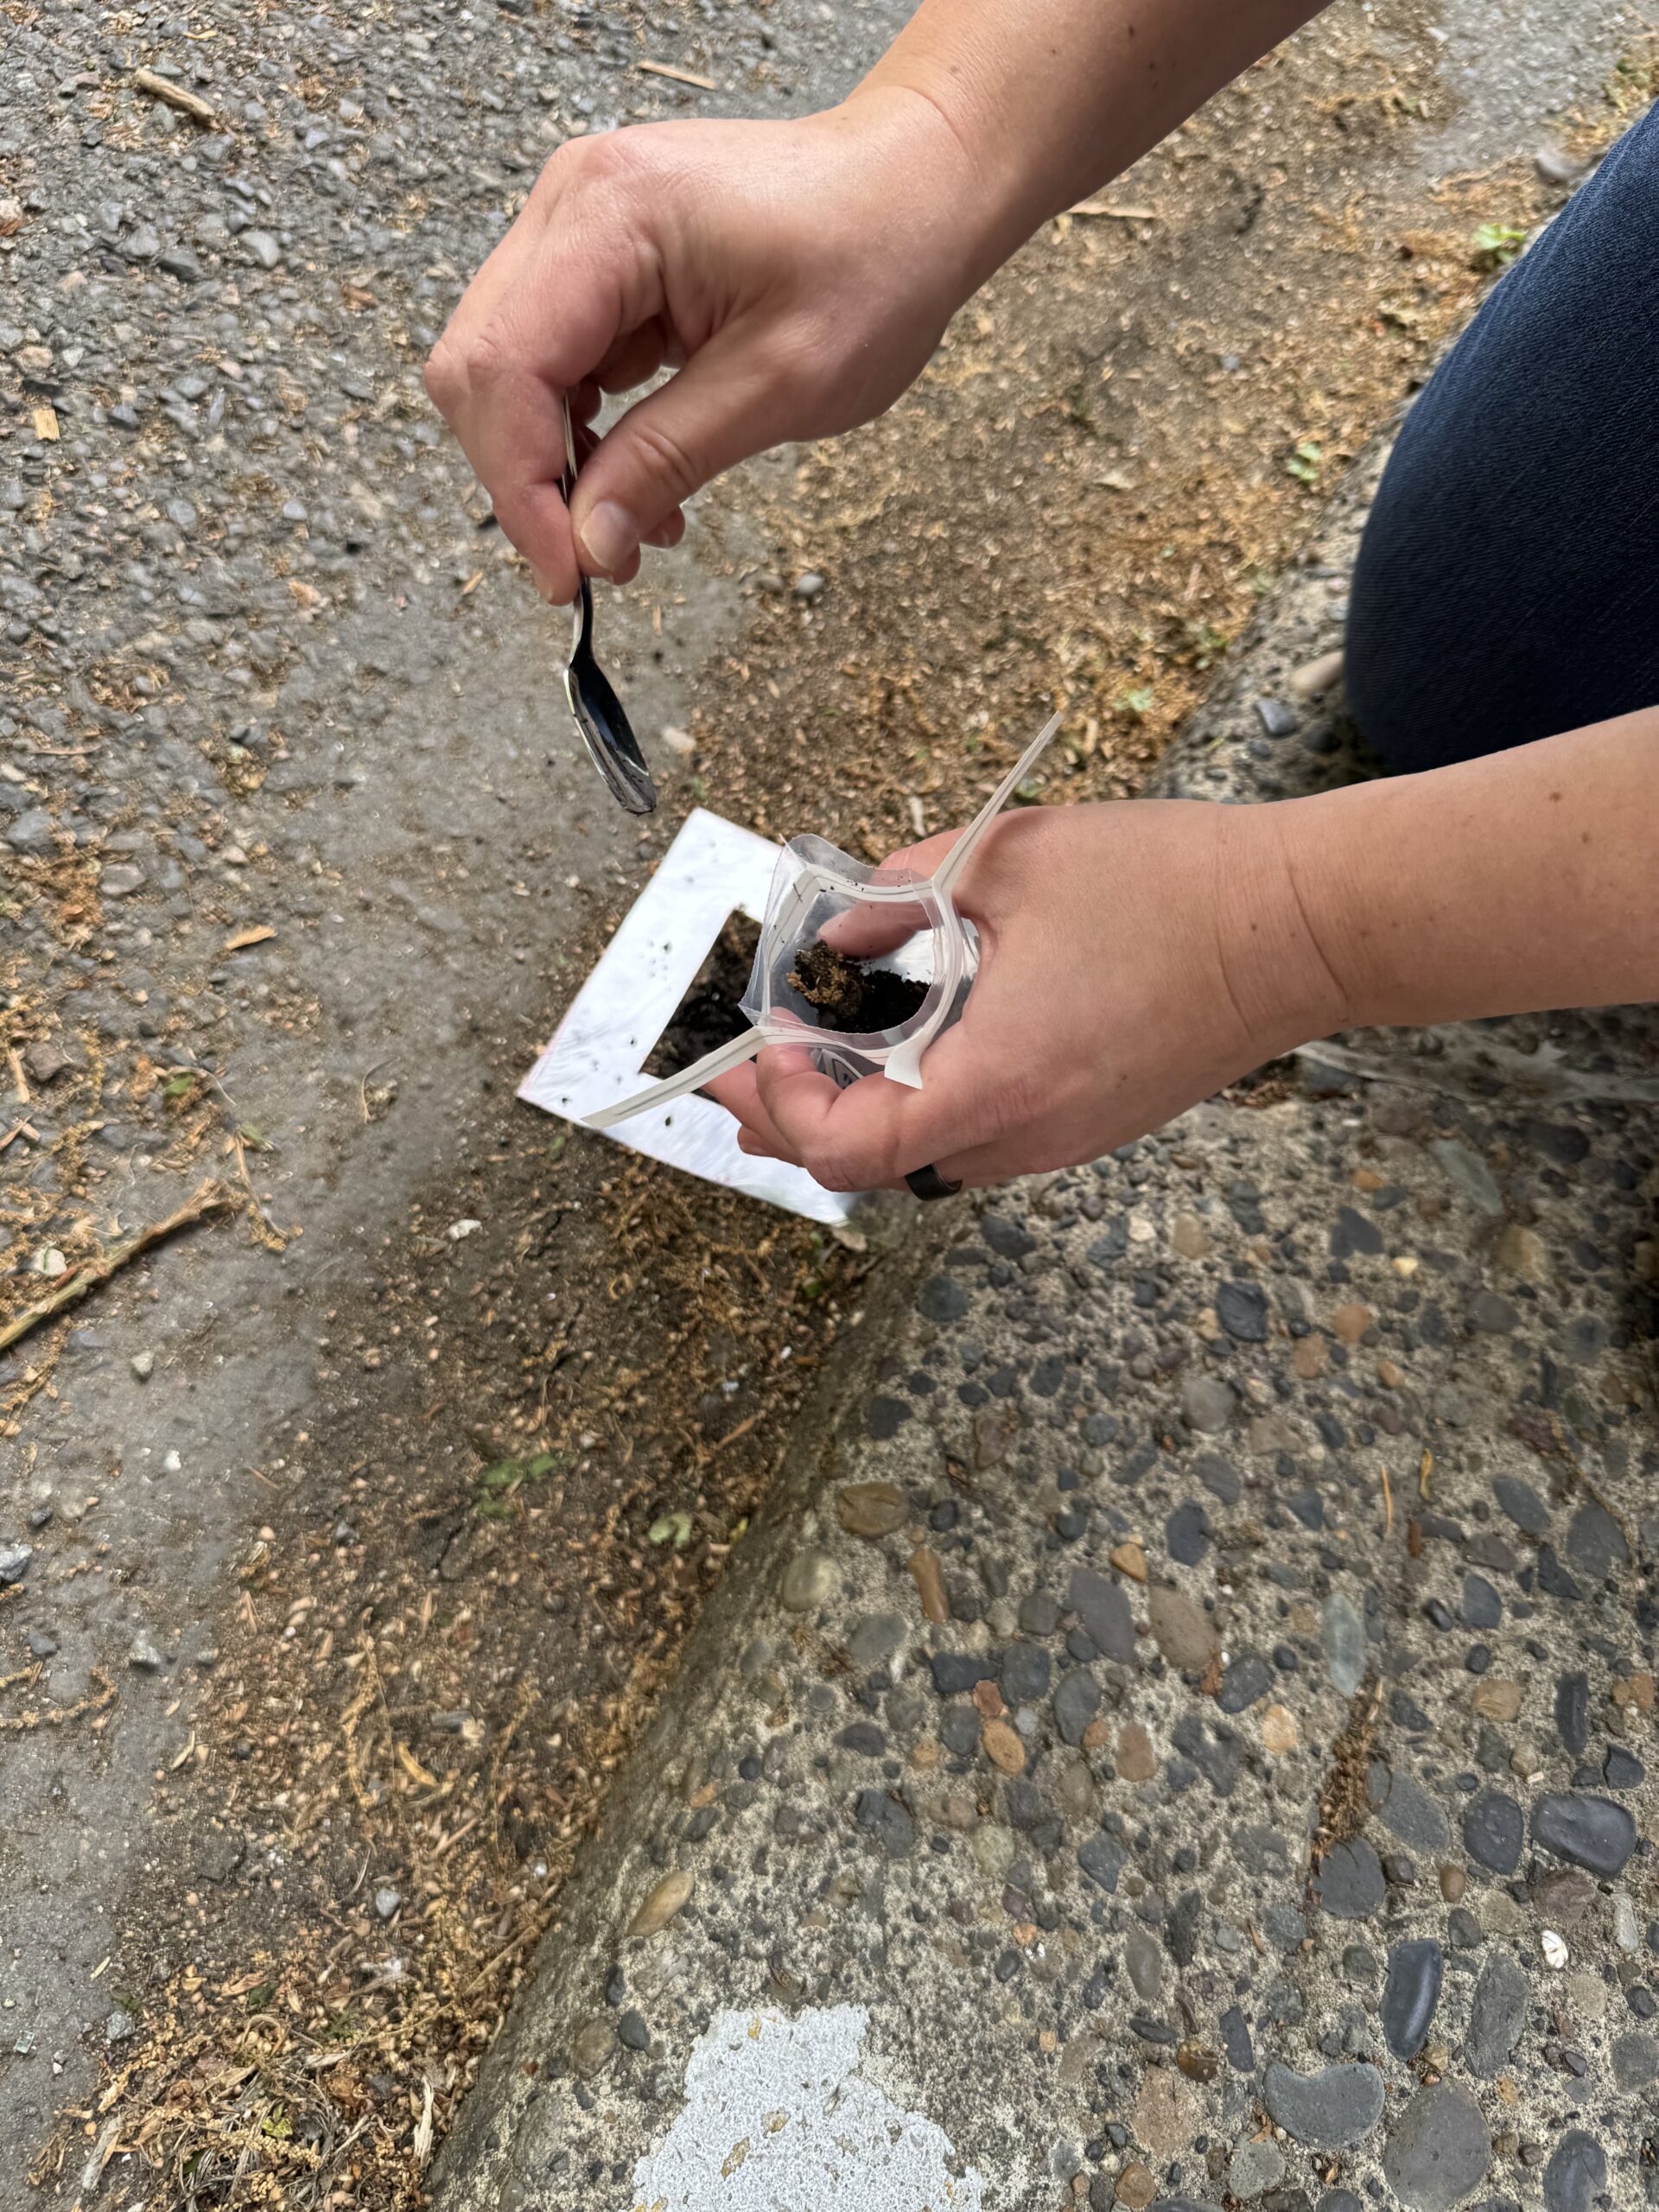
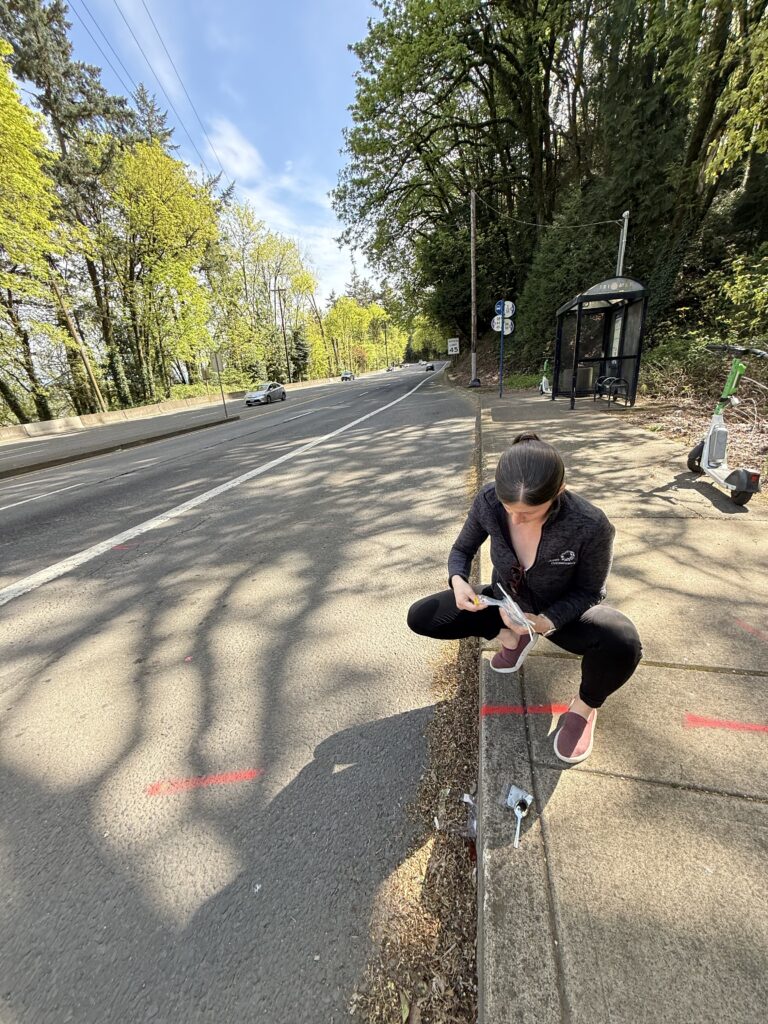
If you happen to be driving on the roadways of Portland, Oregon, you may spot our scientists crouched over, precariously scooping dirt with spoons from a sample area on the roadside. Don’t be alarmed—that’s just us doing science! Feel free to give us a wave.
Ocean Conservancy is currently working to:
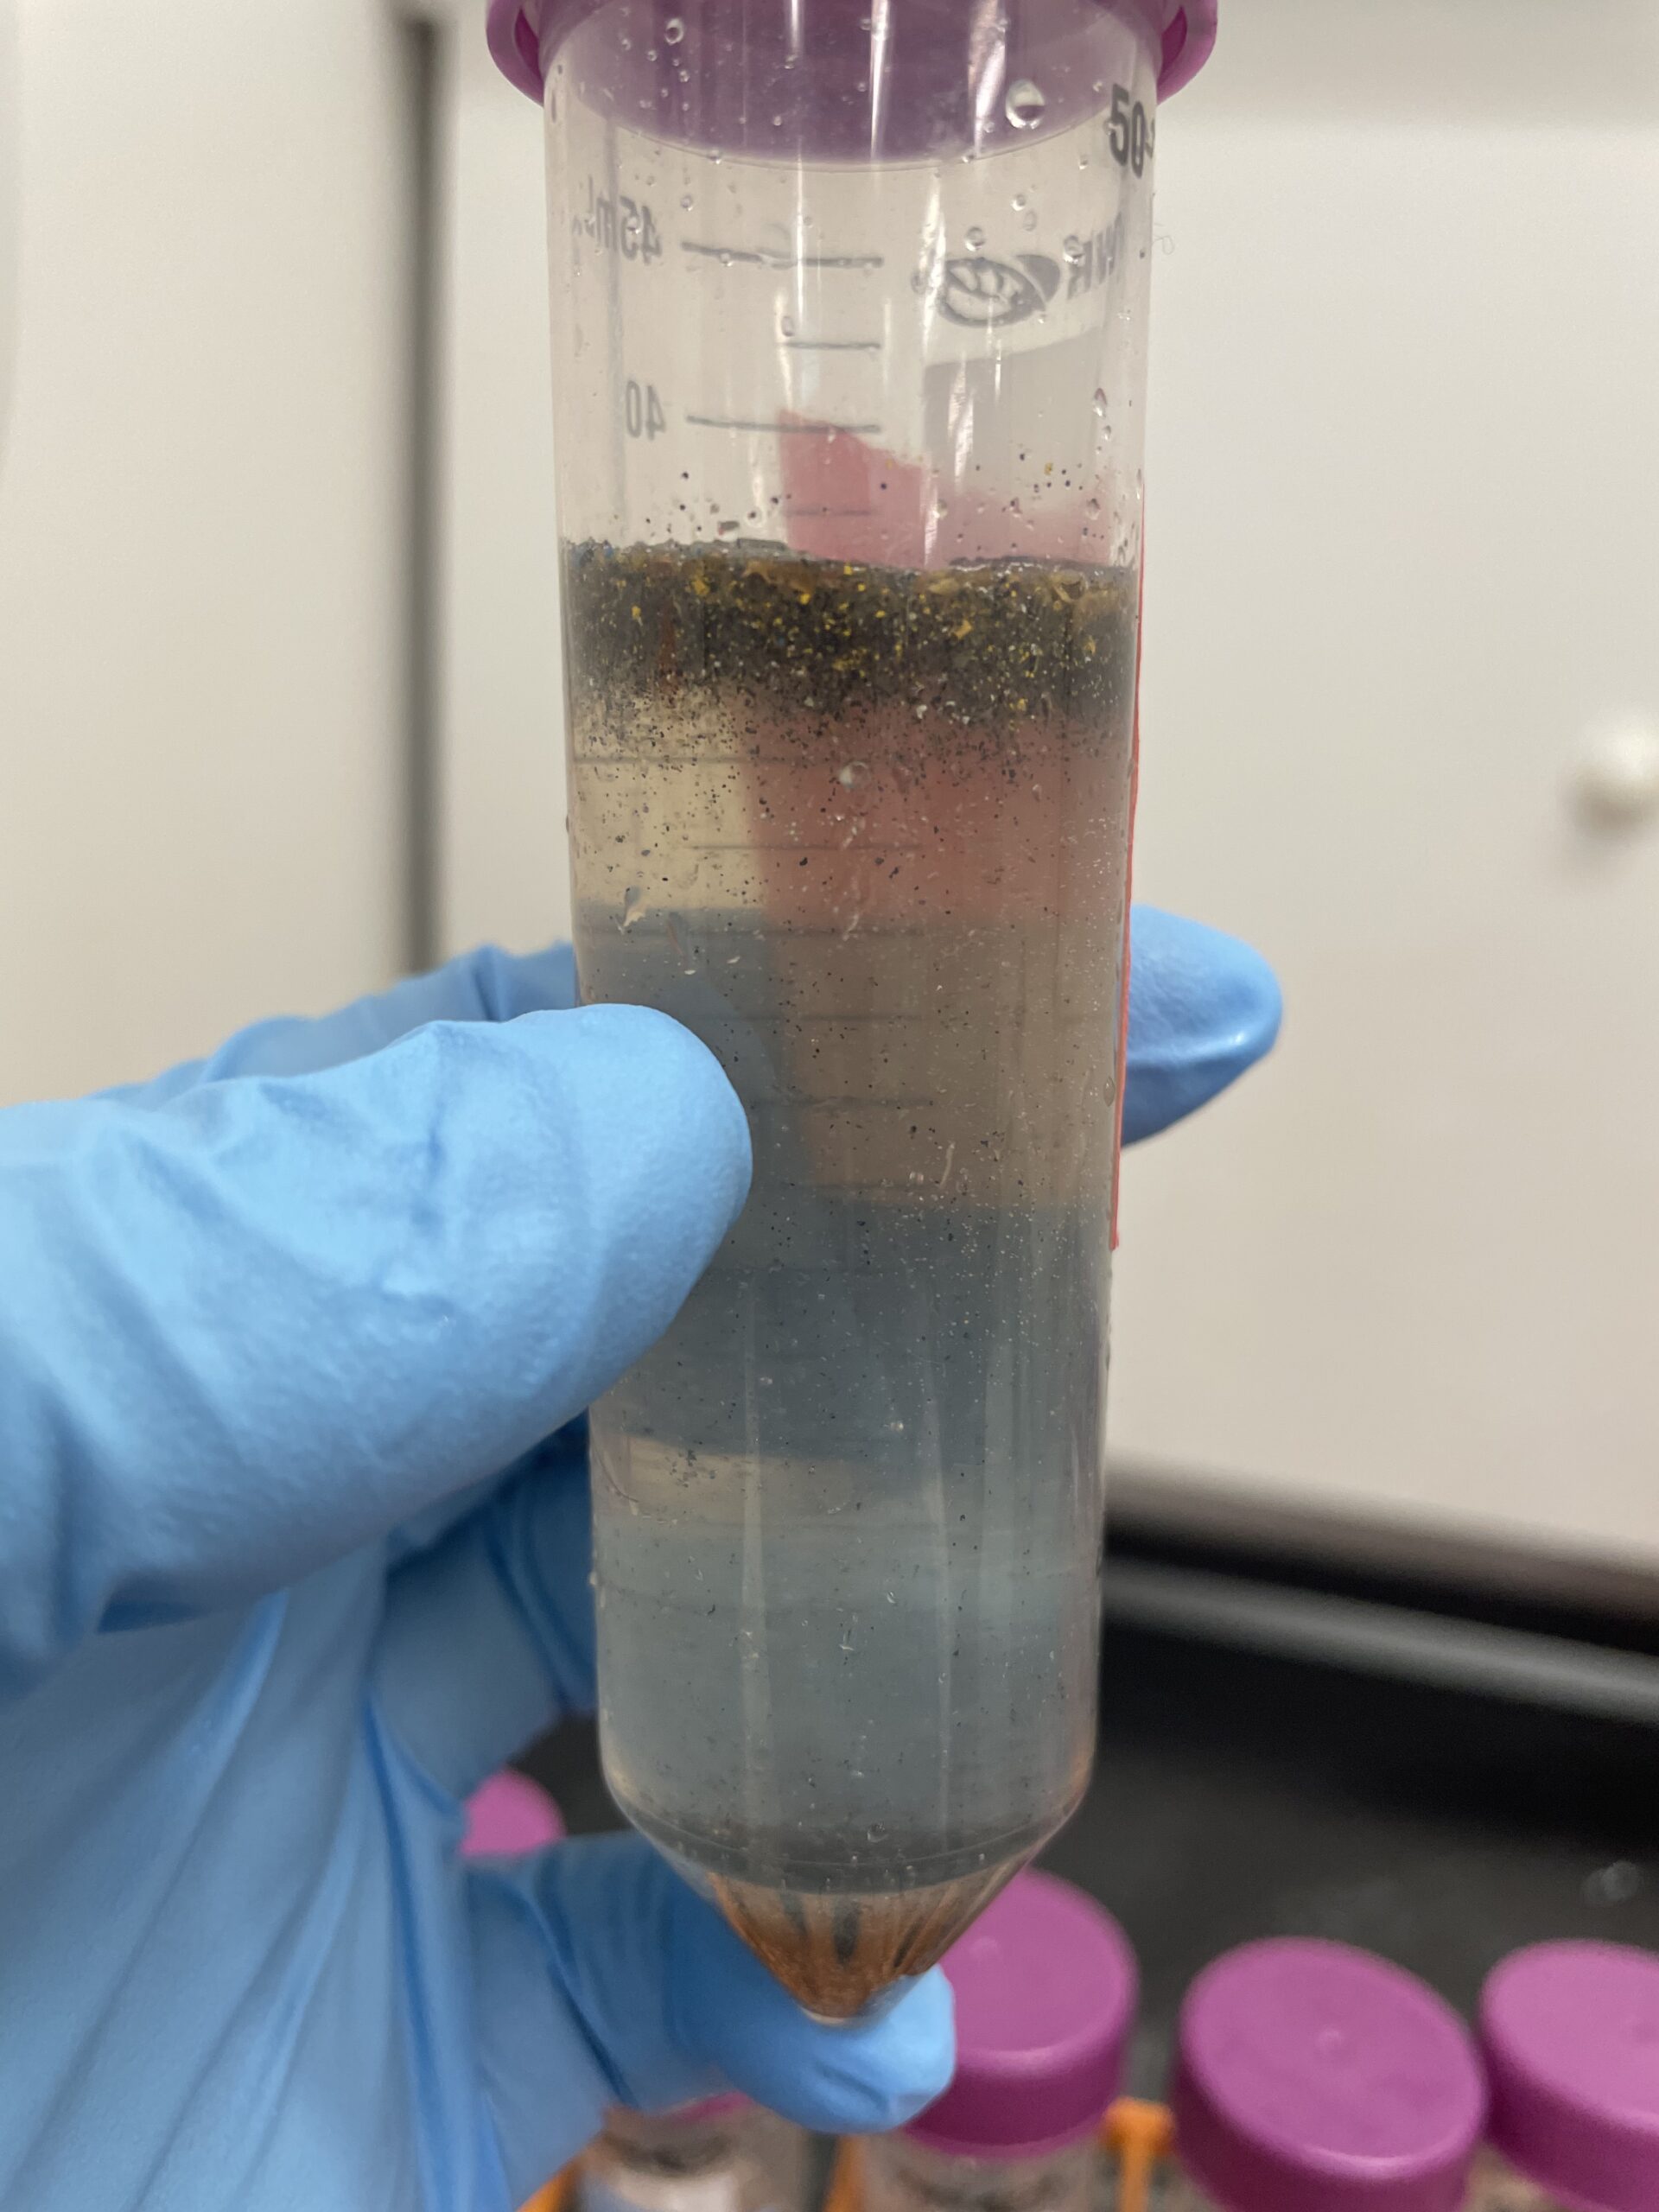
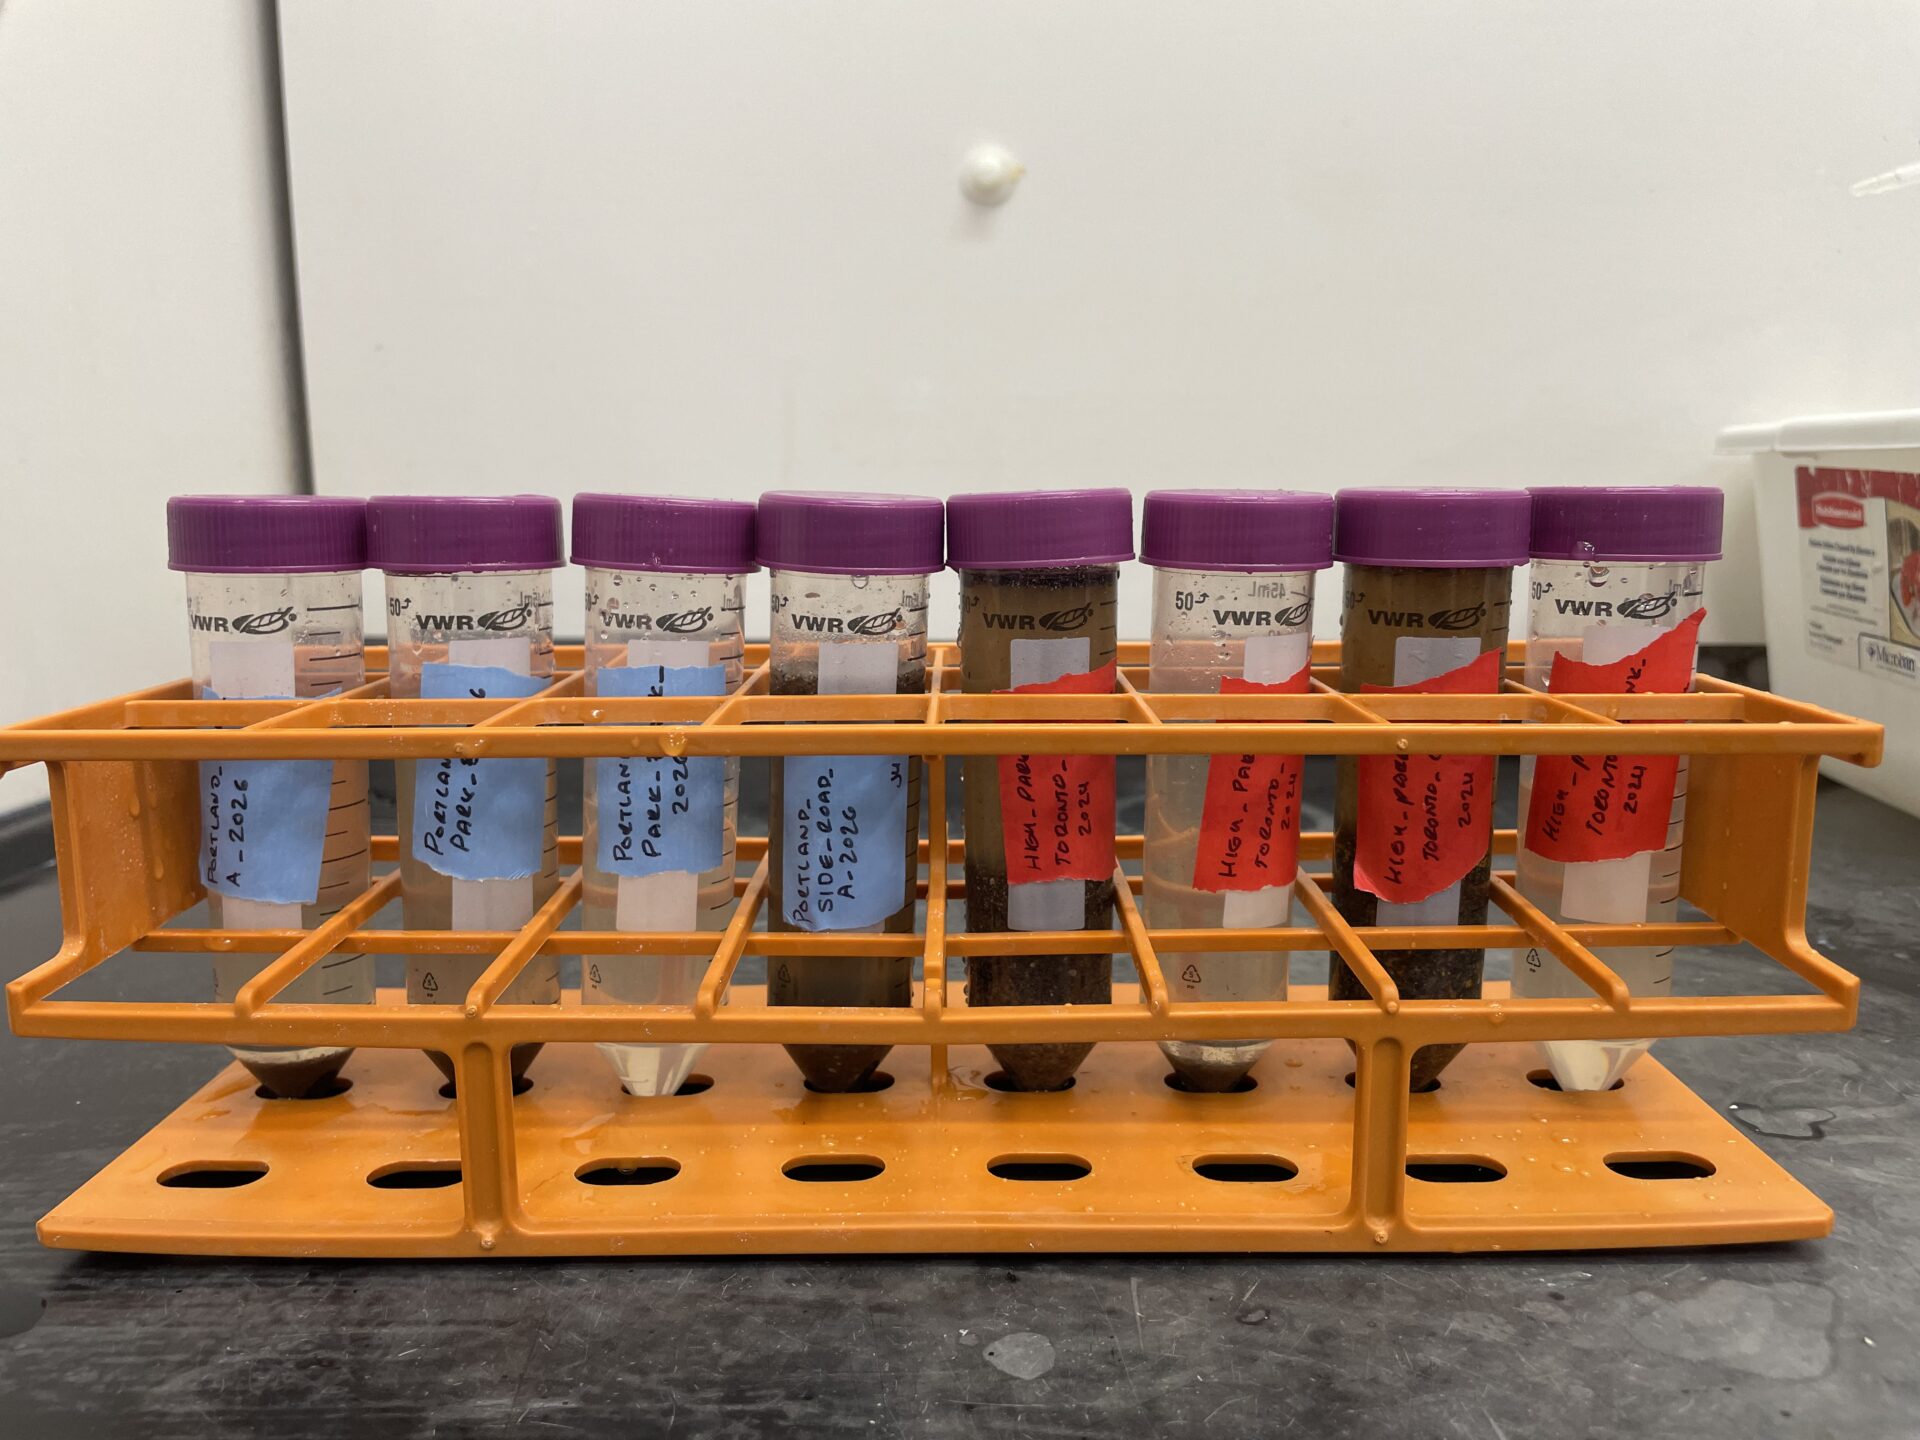
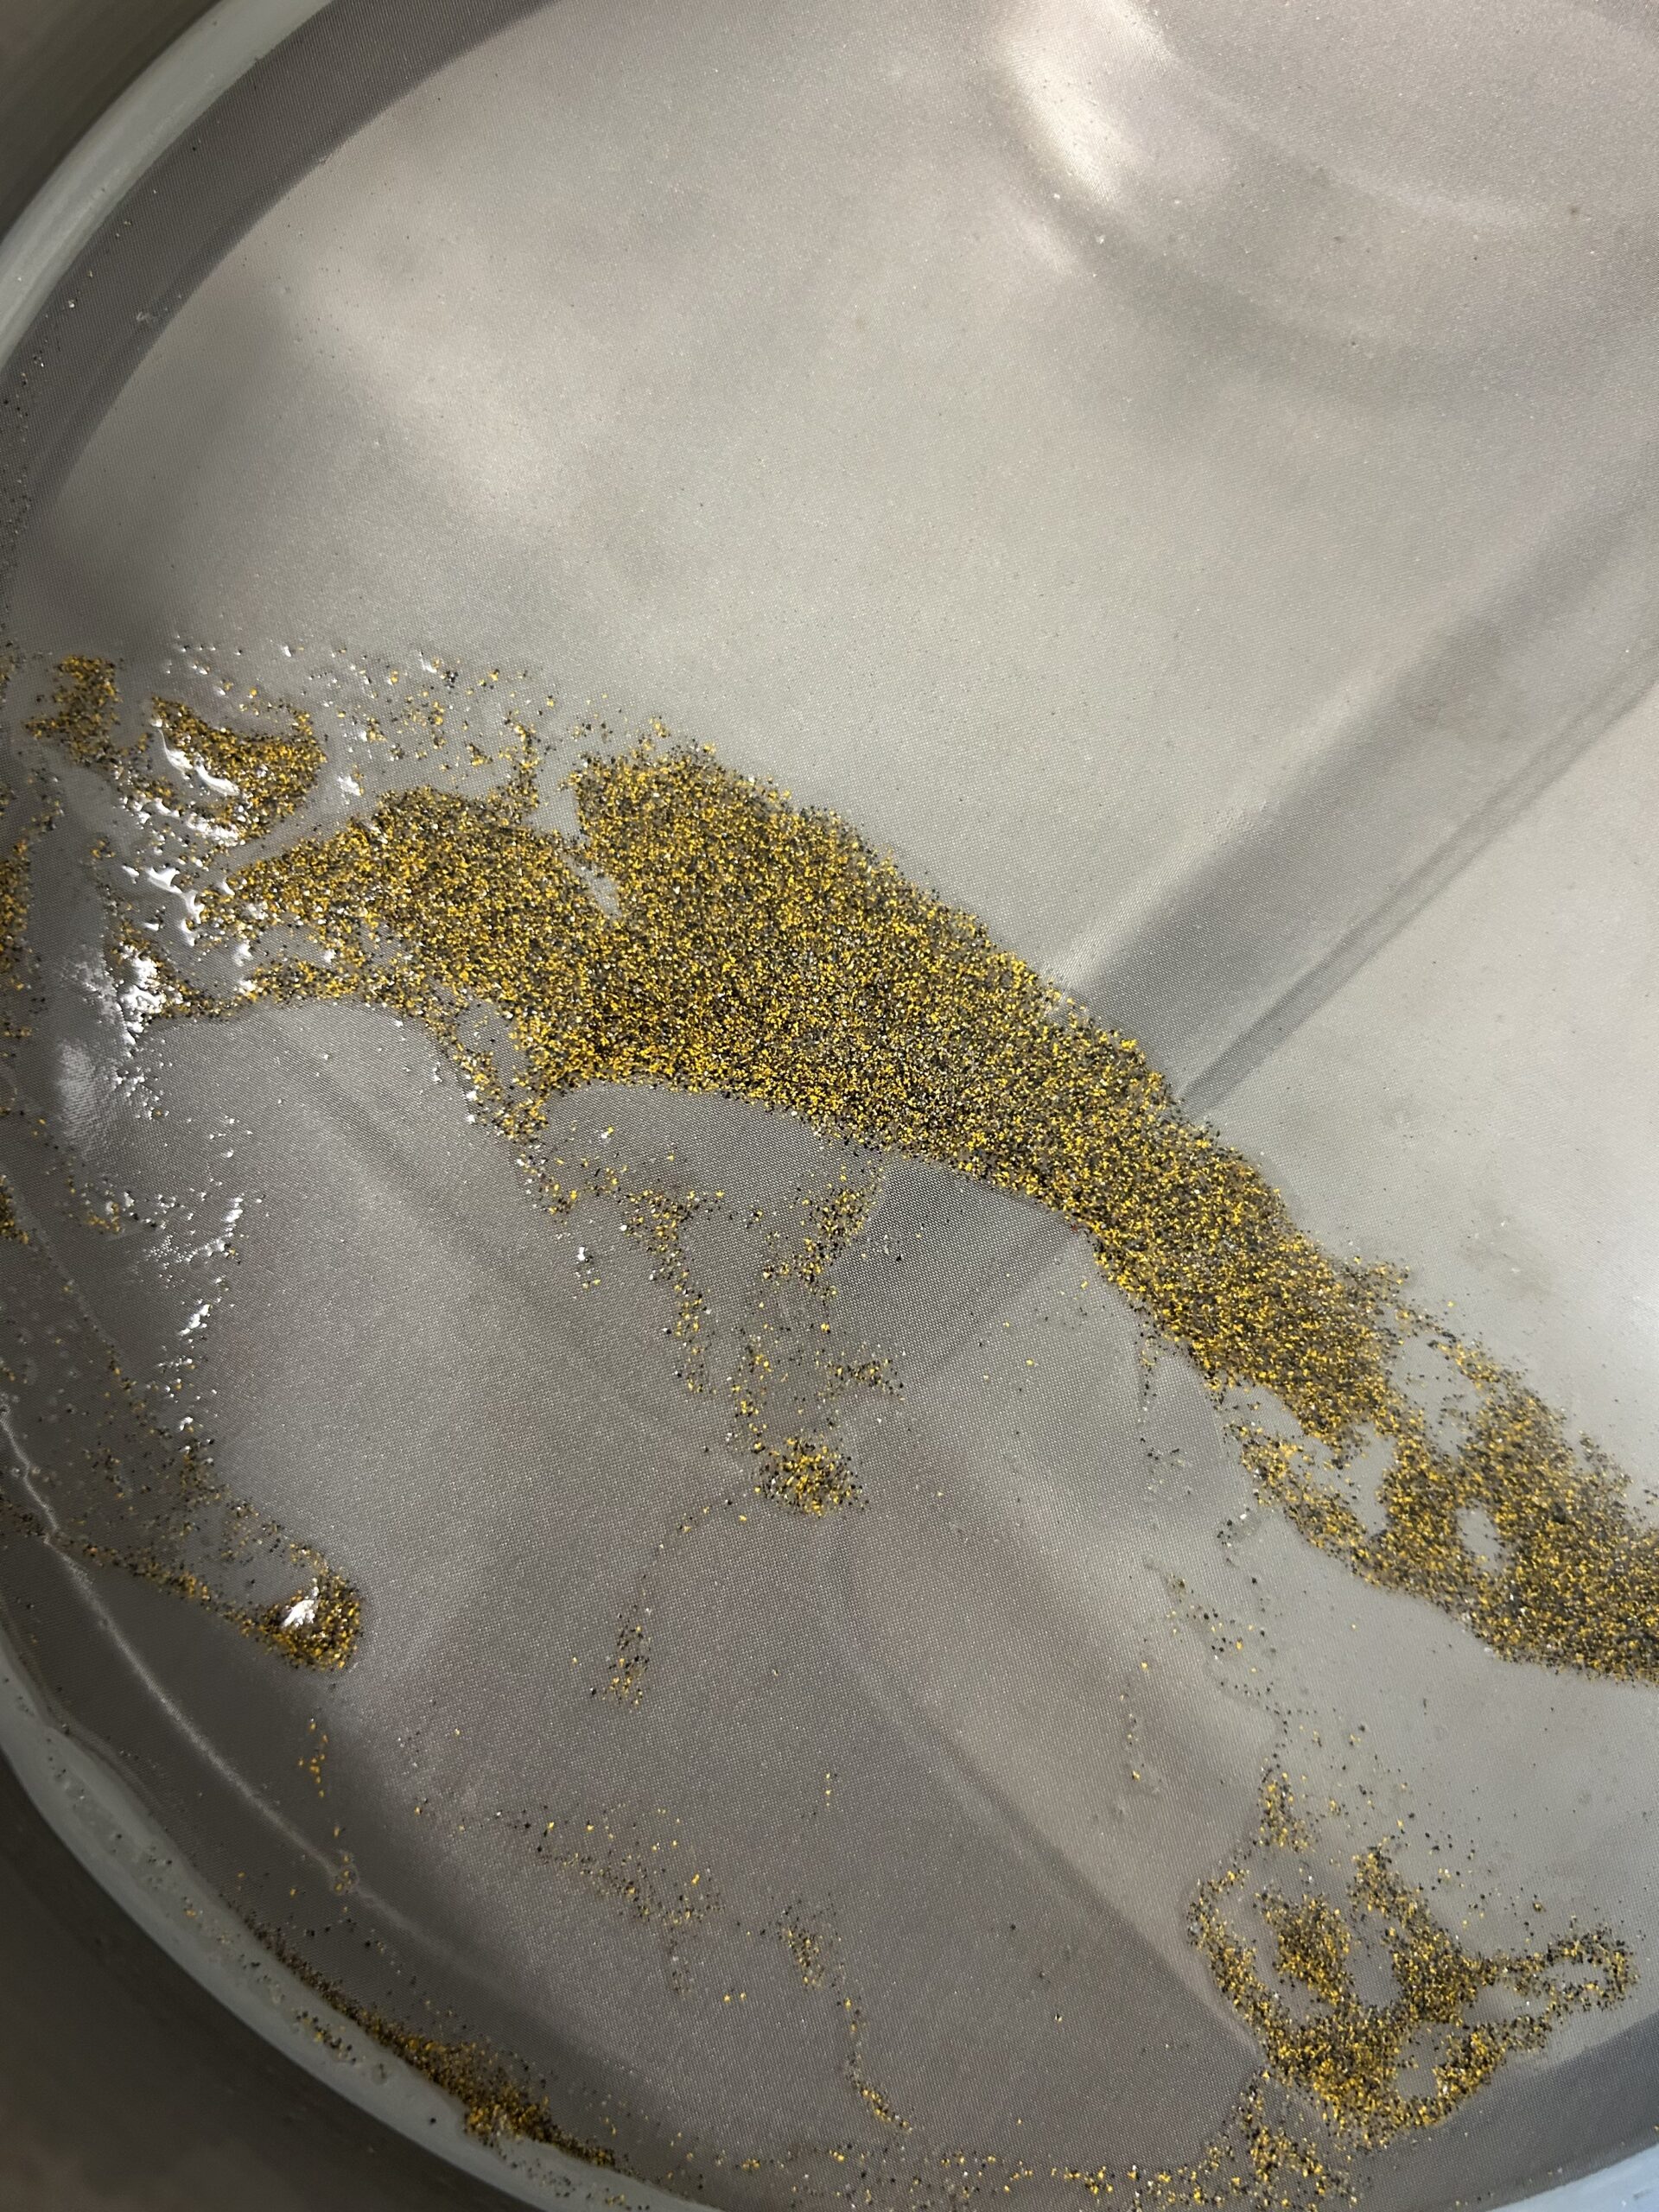
- Quantify the scale of pollution: Collect road dust samples from 30 cities globally to measure both total microplastic and tire wear particle concentrations and determine how different variables (population density, road size, rainfall) might influence those values.
- Assess feasibility: Determine what it would take realistically—logistically, financially and spatially—to scale up green infrastructure across an entire city.
- Model positive impacts: Estimate how much city-scale green infrastructure could reduce tire wear particle pollution entering aquatic ecosystems.
- Compare across cities: Understand how well these solutions might translate across different urban contexts, focusing on Portland, Oregon; Toronto, Canada; and London, England as case-study cities.
- Make our findings accessible: Produce a public-facing toolkit to help city planners, engineers and advocates guide real-world implementation of infrastructure that captures tire-wire particles.
By pairing rigorous science with practical guidance, we hope to help cities move from asking “Could this work?” to confidently building solutions that we know can be effective.
Give today and make a difference!
How can I help?
Tire wear particle pollution can feel like an overwhelming problem. After all, it’s tied to transportation, which most of us rely on every day. But that’s exactly why research like this matters: It gives us a real, near-term path forward that doesn’t require waiting for the entire global transportation system to change first.
You can help by staying engaged with Ocean Conservancy as we continue to dig into solutions for the plastic pollution crisis—one roadway, one storm drain and one city at a time. Together, we can keep working toward a world and ocean free of plastic pollution, forever and for everyone.
The post What are Tire Wear Particles? appeared first on Ocean Conservancy.
Ocean Acidification
A tiny but remarkable visitor in Vejle Fjord-Denmark?
A small jellyfish-like animal recently reported from Vejle Fjord has attracted attention. Clear photographs suggest that it belongs to the genus Gonionemus and may possibly be the clinging jellyfish, Gonionemus vertens (Picture courtesy to Jonas Bøgelund Poulsen)

Unlike the large jellyfish commonly encountered along Danish coasts, Gonionemus vertens is a small hydromedusa, usually only around 1.5–2.5 centimetres across. Its transparent bell reveals four coloured reproductive structures arranged like a cross. Numerous fine tentacles surround the bell, often appearing bent or angled. Small adhesive pads near the ends of the tentacles allow the animal to attach itself to eelgrass, seaweed and other submerged vegetation.
This unusual behaviour explains its English name: the clinging jellyfish. During the day, it often remains attached to vegetation rather than drifting freely with the current. At night, it becomes more active and swims into the water column to feed on zooplankton and small crustaceans. Consequently, it can easily remain unnoticed even in places where it is already established. Another reason the species can be difficult to detect is its life cycle. The visible medusa is only one stage. For much of its life, the animal may persist as a minute polyp attached to a hard surface, shell or vegetation. These inconspicuous polyps can reproduce asexually and later release new medusae when environmental conditions become favourable.
Gonionemus vertens is generally considered native to the northern Pacific but has been introduced into several parts of Europe and the Atlantic. Transport on ship hulls, in ballast water or with movements of oysters and other marine organisms has been suggested as possible pathways, although the pathway responsible for any particular occurrence is rarely known with certainty.
Despite its delicate appearance, the animal should not be touched. Some populations possess powerful stinging cells and have caused intense pain, swelling, muscle cramps and, in rare cases, serious allergic reactions. Sting severity differs considerably among regions, which is one reason researchers suspect that animals currently grouped under the name G. vertens may represent a complex of closely related forms.
The Vejle Fjord observation is therefore scientifically interesting, but it should not yet be presented as a confirmed record of G. vertens. Anyone encountering a similar animal should photograph it without handling it and record the date, exact location, approximate size, number observed and surrounding habitat. Observations can be submitted to Denmark’s national species portal, Arter, where they can be evaluated and contribute to tracking changes in Danish marine biodiversity. Please use either my App: GoJelly JellySpotter or reprot to the Arter.dk: Gonionemus taxon page and Danish species-reporting portal.
References:
Edwards, C. (1977). A study in erratic distribution: The occurrence of the medusa Gonionemus in relation to the distribution of oysters. Advances in Marine Biology, 14, 251–284. DOI: 10.1016/S0065-2881(08)60448-4.
Govindarajan, A. F., Källström, B., Selander, E., Östman, C., & Dahlgren, T. G. (2019). The highly toxic and cryptogenic clinging jellyfish Gonionemus sp. (Hydrozoa, Limnomedusae) on the Swedish west coast. PeerJ, 7, e6883. DOI: 10.7717/peerj.6883.
Ocean Acidification
New Friends, New Addresses
The JOIDES Resolution (JR) was a renowned, international, scientific research ship. It was home to over 190 expeditions, each sailing for 60 days at a time without docking. Scientists and crew members from all over the world met to discover Earth’s secrets through studying ocean cores. Every two months the JR would get a new crew, sailing to an entirely new place. This once in a lifetime experience forms special and unforgettable social connections.
Since working on the JR I’ve kept those connections strong with snail mail. I have always been an avid penpal, so meeting new friends means new addresses to send my letters and postcards to. Experiences like sailing on the JOIDES Resolution or participating in programs like OCEAN CORE Academy is one of the ways I’ve met people from all over the world.
Now that the JR is retired, there is no more scientific research drilling being done through the International Ocean Discovery Program (IODP). But, there is still plenty to learn from ocean cores, and plenty of people to meet through programs like OCEAN CORE Academy (OCA). OCA is an annual summer opportunity from the U.S. Scientific Support Program (USSSP) that hosts undergraduates interested in geoscience related careers. Students can apply to this program for a chance to research and study data recovered from cores originally brought up by the JR, now located at the Gulf Coast Repository (GCR) in College Station, Texas. Students also practice forms of science communication with the guide of mentors. As a science communicator and fan of snail mail, I ran a craft night teaching students how to make and send science-themed postcards.

Fig. 1) students using watercolor to paint onto 4 by 6 inch board paper, a photo of a thin section slide is in the background. Photo by Dr. Leah Joseph.
For this project, we based the cover image of the postcards off of rock thin section slides. These slides are a slice of a hard rock or mineral that’s been glued to a microscope slide, sanded to 0.03 millimeter thickness, and polished. Thin section slides are used to identify grain size, shape, color, and other physical properties. This helps scientists understand the textural relationships between the rocks and determine the origin or evolution of the parent rock. Thin sections can also be helpful for identifying minerals using cross polarized light (XPL). XPL reduces light reflection and glare, commonly used for sunglasses and professional photography, but in a polarizing microscope, XPL is used to create a dark field causing certain minerals to appear brighter and more visible. Different colors are associated with different minerals, and as the stage of the microscope rotates, light passes through the slide in unique ways aiding scientists with identification. Identifying minerals can help scientists in understanding more about where the rocks came from and how old they are. These thin sections are not only informative, but are incredibly beautiful, making unique and stunning postcard covers.

Fig. 2) Examples of thin section slides under a XPL microscope, bronzitite (left) and gabbro (right). Sourced from here.
After the OCA students finished their paintings, my home-made “post card” stamps go on the back, a stamp gets added, and they’re ready to be mailed out. Although most OCA participants this year were U.S. based, they came from all over, ranging from Staten Island to San Francisco to Arizona to Connecticut. In addition to one mentor from New Zealand! For many of these students this was their first time traveling on their own, and their first time forming long-distance connections. With these scientific postcards, OCA students can stay connected by reminding each other of the science they learned together. My experience on the JR taught me great things about geological research, but it also gave me life long connections that I cherish. Although the JR is gone, its legacy lives on in our memories and the ways we stay connected with friends. I’m grateful to know that even without an international ship, I’m still able to add friends to my address book.

Fig. 3) Examples of participant made postcards
Written by Kellan Moss
Ocean Acidification
Color Traditions with Munsell Soil-Color Charts

Fig. 1) an open page of the Munsell Soil-Color Chart book
The Munsell Color Chart has been the national standard and official color system for soil research in the U.S. since the 1930s. For nearly 100 years, geologists and soil scientists have taken these color chip pages into the field to better understand the Earth they are studying, so it comes as no surprise that it is the standard for recording ocean cores brought up by the JOIDES Resolution.
Upon first glance, these charts may look like a page of free paint sample strips you can find at your local hardware store, but they are critical to classifying sediment and understanding the environments they came from and can cost several hundred dollars. The Munsell Color System is a method of numerically describing colors. It specifies colors based on hue, value, and chroma and measures them in a three dimensional space. Hue refers to the dominant color of the soil, value is the lightness of the color (scaled 0-10; 0 being black and 10 being white), and chroma is the intensity or saturation of the color.

Fig. 2) A 3D model representation of the Munsell Color System
There are five primary hues, red, yellow, green, blue, and purple, and five intermediate hues, which are a combination of primary hues such as yellow-red (YR) or green-yellow (GY). The hue of a color is represented as a ring and as the rings go up and down a vertical axis, the value of the color changes. As the color moves horizontally from the vertical axis, chroma or saturation becomes stronger or weaker. A color is specified by listing the three numbers or letters for hue, value, and chroma in that order. In the soil color chart, these number letter combinations correspond with a color. For instance, in figure 1, a 7.5YR 5/6 is also called “strong brown” (seen on the left page, bottom right). The names of colors used in weekly expedition reports are not arbitrary or subjective, they are specific and can be easily and accurately charted by anyone with a Munsell Chart reading the report.
Useful or Just Tradition?
The Munsell Color System has limitations. There are a distinct number of samples and the spacing between colors are large, making it difficult to measure thresholds. This inspired new color measuring methods to develop like CIELAB. Read more about CIELAB and what it means here (blog post “Color Science and Ocean Cores”). Changes to the Munsell system were made, doubling the number of hues in Munsell’s original book from 20 to 40, but CIELAB was already on its way to mainstream.
However, it’s still true that Munsell has been the soil color standard for nearly 100 years. That’s 100 years of geological and earth science research using this method of recording color. If scientists were to change to a system like CIELAB, it would mean having to constantly convert units when comparing previous research. Scientists compare and reference previous work all the time. Comparing sediment core colors from different sites can help support their own scientific findings. So switching to a different color recording method would mean converting all previous research. But is that a good enough reason to stick to tradition?
CIELAB creates a standard observer, which is an averaging of color matching that helps set a base value for recordings. This helps create the most accurate color reading on something such as an ocean core. Using color charts opens up the possibility for disagreements as no two human eyes see colors the same. And this really happens! In 2024 while aboard the JOIDES Resolution, EXP401 sedimentologists held long discussions about shades of grey they were recording differently.

Fig. 3) Photos of “The Great Grey Debate” on EXP401 by Dr. Patty Standring
Machines can record accurately and consistently, so why not switch to CIELAB? Well, expensive machines that use CIELAB, like the Section Half Multi-Sensor Logger (SHMSL) take anywhere from seven minutes to hours, recording only one core at a time. When on a two month cruise, pulling up hundreds of meters of core, time is crucial. Cores dry out and potentially change color as they dry, so it’s important to record fresh colors.
The color of a core can tell scientists so much information so quickly.
“Gradual color changes helped us to identify where we saw facies changes on a larger scale. There were very obvious cyclical color changes at Site U1385 that helped establish that the cores preserved a really good orbitally-driven sediment record. Color differences are also really useful when looking at different grain sizes that help identify turbidites and other sedimentary structures, and burrows from bioturbating organisms,” (Standring)
It’s important that scientists record these fresh colors as quickly and efficiently as possible. Although debates about the color grey can happen, these color discussions and international collaborations are what scientific research is all about. After 100 years, Munsell will stay the golden standard, not because it’s what we’ve always done, but because it’s still the best.
Written by Kellan Moss
Thank you to Dr. Patty Standring and Natacha Fabregas for help with this research
Sources:
Berns, R. S. (2016). Color science and the visual arts a guide for conservators, curators, and the curious. Los Angeles Getty Conservation Institute.
EXP 401 Sedimentologists: Dr. Patty Standring ad Natacha Fabregas
Featured Image: MerlinOne Archive
Fig. 1 Image: Here
Fig. 2 Image: Here
Fig. 3 Images: Dr. Patty Standring from EXP401
-
Greenhouse Gases12 months ago
Guest post: Why China is still building new coal – and when it might stop
-
Climate Change12 months ago
Guest post: Why China is still building new coal – and when it might stop
-
Greenhouse Gases2 years ago嘉宾来稿:满足中国增长的用电需求 光伏加储能“比新建煤电更实惠”
-
Climate Change2 years ago嘉宾来稿:满足中国增长的用电需求 光伏加储能“比新建煤电更实惠”
-
Climate Change2 years ago
Bill Discounting Climate Change in Florida’s Energy Policy Awaits DeSantis’ Approval
-
Renewable Energy9 months agoSending Progressive Philanthropist George Soros to Prison?
-
Carbon Footprint2 years agoUS SEC’s Climate Disclosure Rules Spur Renewed Interest in Carbon Credits
-
Greenhouse Gases1 year ago
嘉宾来稿:探究火山喷发如何影响气候预测