
The “wealthiest 10%” of people on the planet are “responsible” for 65% of the 0.61C increase in global average temperatures over 1990-2020, according to new research.
The study, published in Nature Climate Change, uses a field of climate science called “attribution” to determine the contribution of the world’s “wealthiest population groups” to climate change through the greenhouse gases they emit.
The authors also calculate the contribution of these high-income groups to the increasing frequency of heatwaves and droughts.
For example, the study finds the wealthiest 10% of people – defined as those who earn at least €42,980 (£36,605) per year – contributed seven times more to the rise in monthly heat extremes around the world than the global average.
In another finding, the Amazon rainforest faced a threefold increase in the likelihood of droughts over the period studied, most of which was driven by the wealthiest 10% of the world’s population.
The authors also explore country-level emissions, finding that from the wealthiest 10% in the US produced the emissions that caused a doubling in heat extremes across “vulnerable regions” globally.
One scientist not involved in the study tells Carbon Brief that efforts to attribute global warming to individual income groups is an “important step towards targeted policies” and could support climate litigation.
Emissions inequality
Humans emit more than 40bn tonnes of CO2 into the atmosphere every year. Developed countries are responsible for the majority of global emissions, as a result of the typically more carbon-intensive lifestyles of their residents.
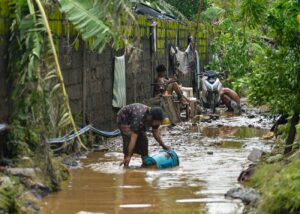
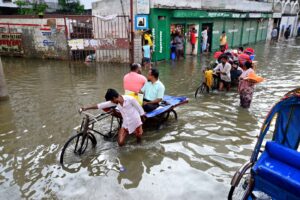
Meanwhile, the most severe impacts of climate change are disproportionately felt by the poorest and most vulnerable people.
The new study uses an income and wealth inequality dataset from the World Inequality Database to track inequality over 1990-2019, showing how much the world’s wealthiest 10%, 1% and 0.1% of society have contributed to warming over 1990-2020. (For details on the method, see the modelling inequalities section below.)
The world’s wealthiest 10% all earn more than €42,980 (£36,605) per year, according to the database. Meanwhile, the world’s wealthiest 0.1% earn more than €537,770 (£458,011) per year.
Of the 0.61C increase in global average temperatures over 1990-2020, the authors estimate that 65% was due to the emissions of the wealthiest 10% of people on the planet. For the wealthiest 0.1%, the estimate is 8%.
The graph below shows how much global temperatures would have risen over 1990-2020 if everyone in the world emitted as much as the world’s poorest 50% (purple), middle 40% (green), richest 10% (orange), richest 1% (blue) and richest 0.1% (pink) people. The grey bar shows how much global temperatures actually rose.
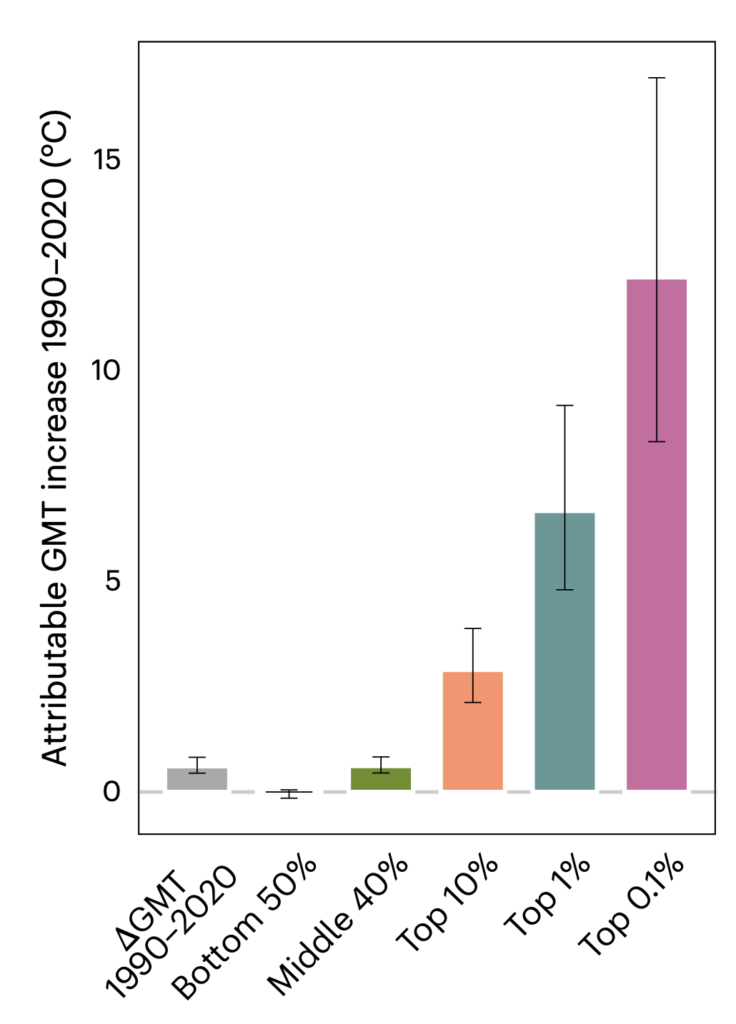
How global temperatures would have risen if everyone in the world emitted the world produced the same amount of emissions, on average, as individuals in the bottom 50% (purple), middle 40% (green), top 10% (orange), top 1% (blue) and top 0.1% (pink) of the world’s emitters. Source: Schöngart et al (2025).
The authors find that if the whole world had emitted as much as the wealthiest 10% of people over 1990-2020, global average temperatures would have risen by 2.9C, instead of 0.61C. If the global population had emissions as large as the wealthiest 0.1%, temperatures would have risen by 12.2C.
Meanwhile, the study calculates that if the whole world had emissions as low as the poorest 50%, global temperatures would have remained close to 1990 levels.
Hot and dry extremes
As greenhouse gas emissions cause the climate to warm, extreme weather events such as heatwaves and droughts are becoming more intense, frequent and long-lasting.
The authors use attribution – a field of climate science that aims to identify the “fingerprint” of global warming on these events – to determine the contribution of the emissions of the world’s wealthiest people to the increasing frequency of heatwaves and droughts.
The authors assess “extremely hot” and “extremely dry” months, defined as the most extreme 1% of months in a pre-industrial climate during the hottest month of the year regionally. (In a pre-industrial climate, only one of each extreme would be expected every 100 years on average.)
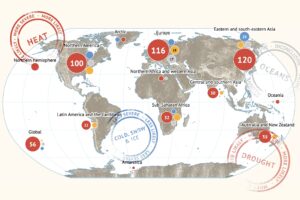
The graphs below show the number of additional heatwaves (left) and droughts (right) that have occurred since 1990 due to climate change in different regions of the world.
The full bar shows the total number of additional heatwaves due to human-cased climate change in each region. The green bar shows additional occurrences due to the wealthiest 1%. The green and orange bars combined show the wealthiest 10%.
The numbers in green and orange show how much the wealthiest 1% and 10% of the planet contributed to the extreme, compared to the global average. (For example, an orange number of 7.0 means that the wealthiest 10% of people contributed seven times more to the extreme event than the global average.)

The study finds that an average of 11.5 additional heat events observed in August – the month where the rise in heat extremes is, on average, most pronounced – are attributable to the wealthiest 10%.
It also calculates that emissions from this group resulted in, on average, an additional 2.3 droughts in the Amazon in October – the month with the strongest attributable drying trend in the region.
Highest emitters
The authors also assess the contributions of the wealthiest people to climate extremes on a country level, identifying the US, the EU, China and India as the world’s four highest emitting regions.
The graphic below shows the increase in frequency of one-in-100 year peak summer heat extremes in selected regions attributable to the wealthiest 10% of people (left) and 1% of people (right) in China (red), the US (pink), the EU (peach) and India (blue).
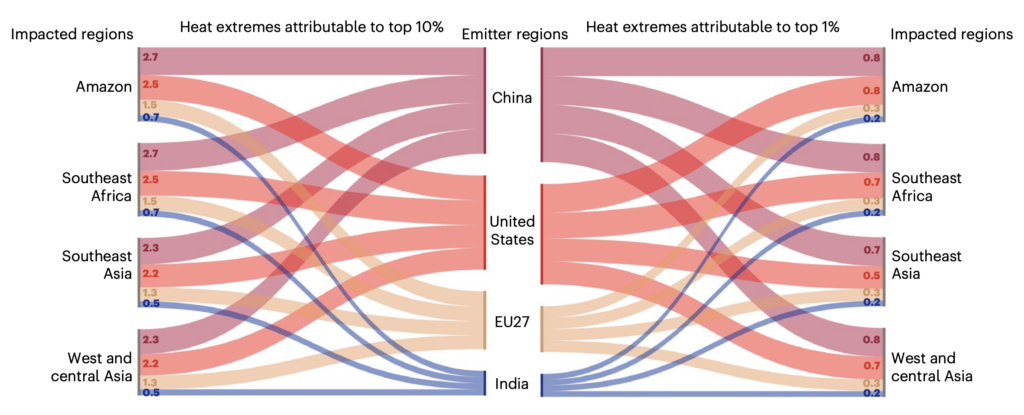
Emissions from the wealthiest 10% in the US resulted in an average of 1.3 extra heat events globally, the authors find. However, this increase is distributed unevenly across the globe.
For example, the authors find this income group was responsible for the emissions that contributed to 2.7 additional heat events in “heat-affected areas” such as the Amazon and south-east Africa.
Emissions from the wealthiest 10% of people in the EU resulted in an additional 1.5 heatwaves in both the Amazon and south-east Africa.
Meanwhile, the Amazon faces 2.1 more heat extremes in 2020 than in 1990 due to the emissions of the richest 1% in the US, China, EU and India.
While inequalities between one country or region and another are well documented, it should also be noted that “inequalities within developing countries are increasing”, Dr Carl Schleussner, study author and leader of the integrated climate impacts research group at the International Institute for Applied Systems Analysis (IIASA), tells Carbon Brief.
For example, he notes that the paper shows “very high levels” of emissions from “the Chinese middle and upper classes”.
However, he says that many existing global frameworks to address climate change “treat countries as a whole” and fail to “differentiate” between income groups within countries.
Schleussner argues that the study highlights the need for “progressive policies” for climate action, which involve “tackling particularly high emitters” in all countries.
Dr Sarah Schöngart, a researcher at ETH Zurich and lead author of the study, tells Carbon Brief that studies such as this could provide important evidence in loss and damage litigation.
Prof Jakob Zscheischler, an Earth system scientist at the Helmholtz Centre for Environmental Research who was not involved in the study, also highlights the ways the findings could be used in climate-change lawsuits. He tells Carbon Brief:
“Quantifying the contribution of individual income groups to global warming and changes in climate extremes is an important step towards targeted policies and further supports climate litigation. Supporting climate injustice with concrete numbers will hopefully help the most vulnerable and least responsible strengthen their case.”
Modelling inequalities
The study uses a range of methods to attribute changes in heat and drought to the emissions of particular wealth groups. To model global greenhouse gas emissions by wealth group, the paper uses a “wealth-based carbon inequality assessment” from a 2022 study.
(See Carbon Brief’s coverage of the 2022 study.)
The study uses income and wealth inequality dataset from the World Inequality Database to track inequality over 1990-2019. It combines economic data with information on per-capita carbon footprints – calculated using “input-output” methodologies combined with data from the “distributional national accounts” project.”
The model considers three factors. The first is private consumption – made up of emissions from the direct use of fossil fuels and emissions embedded into goods and services. The second includes emissions from government spending in that person’s country – such as government administration, public roads or defence. The final component of a person’s carbon footprint is from their investments.
The authors then created a series of “counterfactual” emissions pathways, which imagine the world without the emissions of the wealthiest 10%, 1% and 0.1% of society, respectively. The emissions pathways include CO2, methane and nitrous oxide emissions, expressed as CO2-equivalent.
Lead author Schöngart tells Carbon Brief that including methane in the models is important, because it has “really high potency and near-term warming”. However, she notes that the team needed to make some assumptions about methane emissions – for example, assuming that each income group emits the same relative amount of methane compared to other greenhouse gas emissions.
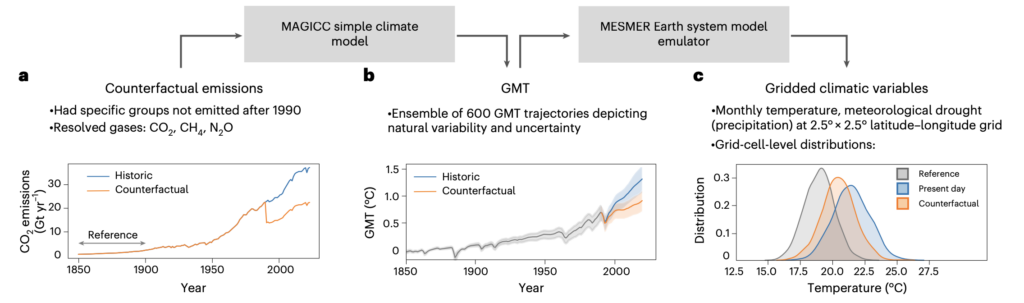
Using a “simple” climate model called MAGICC, the authors model global average temperatures under these counterfactual emissions pathways. This allows them to calculate how much the planet would have warmed over 1990-2020 without the emissions of the 10%, 1% and 0.1% of society, respectively.
The authors use the global average temperature trends to produce temperature and rainfall data for every land-based grid square on Earth via a climate model emulator called MESMER.
Schöngart tells Carbon Brief that an emulator is “an approximation of an Earth system model” which “allows us to generate incredible amounts of data”, while using less computing power and taking less time to run.
The study authors then use attribution methods to identify how the emissions from the world’s wealthiest members of society have affected the frequency of heatwaves and droughts, by comparing the world as it is to a “counterfactual” world without human-caused climate change.
The graphic below shows these steps.
Earth system scientist Zscheischler praises the methods in the study. He tells Carbon Brief that “the main innovation of work lies in its novel combination of relatively simple emulators that capture the most important relationships between emissions and global warming and changes in extremes”.
He adds that emulators have been evaluated in other studies and are “trustworthy for this type of delicate analysis”.
Prof Wim Thiery – an associate professor at Vrije Universiteit Brussel, who was not involved in the study – also commends the use of emulators. He tells Carbon Brief that “producing the information presented in this study with a suite of full-blown Earth system models is impossible from a computational cost and human effort perspective”.
The post Two-thirds of global warming since 1990 caused by world’s ‘wealthiest 10%’ appeared first on Carbon Brief.
Two-thirds of global warming since 1990 caused by world’s ‘wealthiest 10%’
Climate Change
Cropped 8 April 2026: Iran war drives up food prices | Two nature talks conclude | Return of UK’s tallest bird
We handpick and explain the most important stories at the intersection of climate, land, food and nature over the past fortnight.
This is an online version of Carbon Brief’s fortnightly Cropped email newsletter.
Subscribe for free here.
Key developments
Iran war and food systems
PLANTING AT RISK: The war in the Middle East “has hit the epicentre of global fertiliser production”, threatening both the spring planting season in the northern hemisphere and winter planting in Australia, according to a comment by the Daily Telegraph’s world economy editor. Ambrose Evans-Pritchard noted that the supply of urea, ammonia and sulphur transported through the Persian Gulf has been “shut off” for nearly a month. The world’s two largest fertiliser producers, China and Russia, have recently reduced fertiliser exports, he added.
COMING CRISIS: Fuel costs and food prices are skyrocketing in Asia and Africa as the Iran war unfolds, reported the Financial Times, ahead of the new “two-week ceasefire”. According to the outlet, the impacts “could be even bigger than the crisis triggered by Russia’s 2022 full-scale invasion of Ukraine”. Even regions less directly exposed to the conflict, such as the US, “will feel the effects through higher [food] prices”, the outlet added.
CLIMATE FACTORS: New Scientist noted that the severity of the rise in food prices will depend on the length of the conflict and “how hard global warming-fuelled weather extremes” impact crops this year. A separate New Scientist piece pointed out that reducing farming’s dependence on fossil fuels could “prevent this from happening again [and] help slash the massive greenhouse gas emissions from farming”.
Nature talks outcomes
CONSERVATION WINS: The 15th Conference of the Parties to the UN Convention on Migratory Species ended on 29 March with an agreement to add 40 migratory species, including cheetah, striped hyena and snowy owls, to the convention’s “protected list”, reported Down To Earth. The conference in Brazil also delivered plans for conserving multiple species that live in the same ecosystems, such as the Amazon. The convention’s executive secretary said the new conservation rules are expected to be implemented “immediately”, added the outlet.
-
Sign up to Carbon Brief’s free “Cropped” email newsletter. A fortnightly digest of food, land and nature news and views. Sent to your inbox every other Wednesday.
MARINE PROTECTION: The conference was considered a “significant step forward” for marine species, as it reached a number of agreements, including commitments for reducing bycatch and a decision for countries to include “critical marine designations into their national biodiversity strategies”, reported Oceanographic. The meeting also adopted transboundary action plans for conserving the “critically endangered” European eel and the tope shark, it said.
HIGH SEAS MEETING: The final preparatory meetings for the High Seas Treaty ended on Friday with “meaningful progress in several key areas”, according to the Fishing Daily. Countries agreed on the “functioning of most subsidiary bodies” and several financial matters, but the “negotiations lost momentum toward the end of the session”, noted the outlet. The Financial Times reported that China is pushing to host the UN permanent body that will oversee High Seas Treaty talks. Earth Negotiations Bulletin reported that the treaty’s first summit will likely take place in New York in January 2027.
News and views
- FOREST LOSS: Deforestation in Indonesia surged by 66% in 2025, hitting its highest rate in eight years as a “result of weak environmental protections and an ambitious food and energy self-sufficiency drive”, said Reuters.
- DEFORESTATION REGULATION: Brazil introduced a new regulation last week requiring banks to use satellite data provided by the government to verify if borrowers of rural loans have deforested farmlands in the Amazon or other forests since July 2019, reported Folha de São Paulo.
- FACTORY FARMING: The UK government is overhauling planning rules to “make it easier to build intensive livestock farms despite concerns about water pollution, air quality and local opposition”, according to documents obtained under the freedom-of-information act by the Guardian.
- INITIATIVE ‘ABANDONED’: The European Commission has officially “abandoned” its sustainable EU food system initiative, according to the commission’s website. The framework was meant to integrate sustainability into all food-related policies, including for food labelling and public procurement.
- BLUE MILESTONE: The UN Environment Programme’s World Conservation Monitoring Centre announced that 10% of the global ocean is officially protected; however, the figure needs to triple for the world to meet its conservation commitments by 2030, according to EFE Verde.
Spotlight
Return of UK’s tallest bird
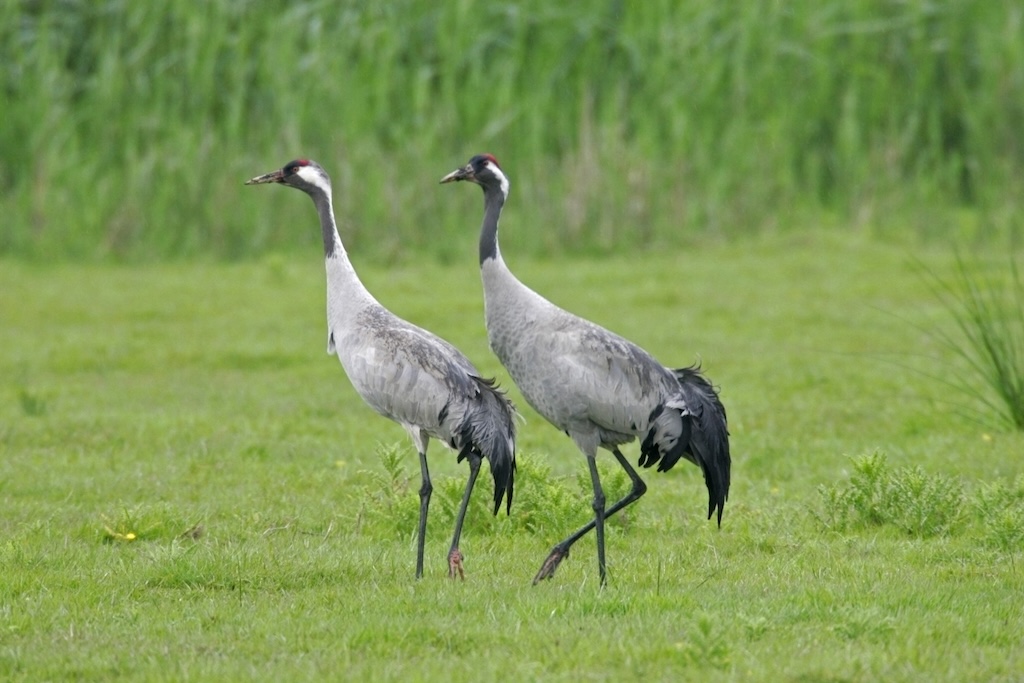
This week, Carbon Brief reports on how cranes, the UK’s tallest bird at more than 1 metre high, are making a remarkable comeback from extinction.
Standing at more than 1m with a 2m wingspan, cranes are comfortably the tallest bird in the UK.
Hundreds of years ago, they were a common sight in the UK. But, in the 1600s, they went extinct in the UK, due to overhunting and the large-scale loss of their wetland habitat. (Henry III reportedly served 115 cranes at one of his Christmas feasts in 1251.)
However, in 1979, a small number of wild cranes flew in from Europe and settled in Norfolk, eastern England. As efforts to restore and protect the UK’s wetland habitats have grown over the past few decades, so has the number of cranes.
In 2025, cranes had a record breeding season in the UK, with 87 pairs raising 37 chicks, according to data from the Royal Society for the Protection of Birds (RSPB). This has brought the total number of cranes in the country to around 250, says the charity.
Cranes and carbon
The majority of the UK’s growing crane population can be found in wetland areas that have been actively restored and protected by the RSPB and other conservation groups.
This includes Lakenheath Fen, a former carrot field in Suffolk, eastern England, that over the past 30 years has been restored into a diverse wetland habitat for birds, otters and water voles, among other species.
Cranes first arrived at Lakenheath from Europe in 2007, site manager Dave Rodgers explained to Carbon Brief:
“The conditions we created – a patchwork of developing reedbed, interspersed with shallowly flooded areas – were perfect for cranes. In 2007, there was an influx of birds from Europe. Two pairs flew over Lakenheath, landed and they’ve been nesting here ever since.”
As well as providing a home for cranes and other vulnerable water birds, the restoration of Lakenheath Fen and other sites like it is also helping to reduce the UK’s greenhouse gas emissions.
This is because Lakenheath Fen is a peatland.
Peatlands are waterlogged environments where plants decay very slowly, eventually forming a carbon-rich soil called peat. Across the world, peatlands cover just 3% of land area, but store more carbon than all of Earth’s trees combined.
In the UK, around 80% of all peatlands are degraded, with the greenhouse gases they emit accounting for around 5% of the country’s total emissions.
Rodgers explained:
“By re-wetting the peat, we’re almost completely preventing further loss of carbon from the soil.”
Flying future
According to the RSPB, cranes are now found at multiple wetland sites in the south-east and south-west of England. Some have even settled as far as Scotland.
With wetland restoration taking place across the country, including in cities such as London and Bristol, it is likely the birds will continue to spread to new areas, said Rodgers:
“There are a lot of wetlands around the country that would be suitable for cranes to nest in that are not currently occupied.
“With care, we should see cranes expand more widely across the country so that people who don’t currently have them might see them within the next 10 years.”
Watch, read, listen
NEW CHANCE FOR BEAVERS: A video from the Guardian showed the positive effects of the reintroduction of beavers into the wild in England.
INKCAP RELAUNCH: The UK online nature publication, Inkcap, headed by former Carbon Brief journalist Sophie Yeo, has relaunched with a new look.
BIRDS ARE BACK: Mongabay covered five bird species thought extinct that were rediscovered in 2025.
GREAT SHIFT: This Nature Answers podcast told the story of a community in Côte d’lvoire, where farmers moved from climate scepticism to adopting climate-adaptation measures.
New science
- Many insects in the tropics are already approaching their heat limits – the upper bound of the temperatures at which they can live | Nature
- More than 8,000 species could face increased exposure to wildfires by 2100 as a result of climate change under a moderate-warming scenario | Nature Climate Change
- Two temperate tree species, European beech and downy oak, can adapt to rising temperatures – but not when those high temperatures are accompanied by drought | Proceedings of the National Academy of Sciences
In the diary
- 10 April: Djibouti presidential election
- 12 April: Hungary presidential election
- 13-18 April: World Bank/International Monetary Fund spring meetings | Washington DC
- 21-22 April: 17th Petersberg climate dialogue | Berlin, Germany
- 21-25 April: UNFCCC climate week 1 | Yeosu, South Korea
Cropped is researched and written by Dr Giuliana Viglione, Aruna Chandrasekhar, Daisy Dunne, Orla Dwyer and Yanine Quiroz. Please send tips and feedback to cropped@carbonbrief.org
The post Cropped 8 April 2026: Iran war drives up food prices | Two nature talks conclude | Return of UK’s tallest bird appeared first on Carbon Brief.
The Indian government has quietly withdrawn its offer to host the COP33 climate summit in 2028, Climate Home News has learned.
An Indian official informed other nations of the decision on April 2, saying the offer – first made by Prime Minister Narendra Modi in December 2023 – was being withdrawn “following a review of its commitments for the year 2028”.
No additional explanation has been provided. The Indian government has not publicly announced the decision and did not immediately respond to a request for comment. Climate Home News is the first to report the withdrawal.
The decision leaves uncertainty over the host of COP33, which will follow COP31 in Türkiye and COP32 in Ethiopia. South Korea is now the only country to have expressed interest in hosting the 2028 summit, with a decision expected later this year.
The right to host the annual climate COP negotiations rotates between the UN’s five regional groups. This year’s COP31 will be co-hosted by Türkiye and Australia – both members of the Western Europe and Others Group – and next year’s will be in the capital city of Ethiopia, a representative of the African Group.
-
Colombia pledges to exit investment protection system after fossil fuel lawsuits
Experts warn that unwinding the Investor-State Dispute Settlement system will be complex, especially without international coordination -
Funding gap threatens next round of IPCC climate science reports, chair warns
The latest IPCC session in Bangkok was clouded by persistent differences over when its flagship reports should be published and concern over cost-cutting proposals -
Nepal’s EV revolution pays off as oil crisis causes pain at the pumps
Import subsidies, abundant hydropower and charging investments have spurred EV adoption, with electric vehicles now making up about three-quarters of new car sales


The Asia-Pacific Group is next in line. India had been widely expected to host COP33 after Modi announced the country’s bid at COP28 in Dubai in 2023.
In July 2025, the BRICS group of Brazil, Russia, India, China and South Africa said in a joint statement that they “welcomed” India’s candidacy to host COP33.
In the same month, The Hindu reported that the Indian government had set up a “cell” under the climate change division of the environment ministry to prepare for the summit.
But a letter dated 2 April – seen and verified by Climate Home News – confirms the reversal. In it, Rajat Agarwal, the environment ministry official responsible for liaising with the UNFCCC, informed the chair of the Asia-Pacific Group that India is withdrawing its candidacy.
The four-paragraph letter says India will continue to engage constructively with the international community on climate action and appreciates the “support and solidarity” of the Asia-Pacific countries during its bid for candidacy.
The post India withdraws bid to host COP33 climate talks appeared first on Climate Home News.
Climate Change
Alabama’s Governor Signed a Landmark Utility Regulation Bill Into Law. Many Say It’s a Win For Alabama Power.
The legislation was weakened so significantly its original sponsor ultimately voted against it. Alabamians say they’ll continue to push for real reform.
BIRMINGHAM, Ala.—Alabama Power customers aren’t giving up yet. On Monday, around two dozen of them marched from Birmingham’s Kelly Ingram Park to the nearby headquarters of the investor-owned utility company to make that much clear.

Cropped 8 April 2026: Iran war drives up food prices | Two nature talks conclude | Return of UK’s tallest bird

India withdraws bid to host COP33 climate talks

Best of Sustainability In Your Ear: Plastic Bank’s David Katz on Grassroots Recycling Solutions
-
Climate Change8 months ago
Guest post: Why China is still building new coal – and when it might stop
-
Greenhouse Gases8 months ago
Guest post: Why China is still building new coal – and when it might stop
-

 Greenhouse Gases2 years ago
嘉宾来稿:满足中国增长的用电需求 光伏加储能“比新建煤电更实惠”
-
Climate Change2 years ago
Bill Discounting Climate Change in Florida’s Energy Policy Awaits DeSantis’ Approval
-

 Climate Change2 years ago
嘉宾来稿:满足中国增长的用电需求 光伏加储能“比新建煤电更实惠”
-
Climate Change Videos2 years ago
The toxic gas flares fuelling Nigeria’s climate change – BBC News
-

 Renewable Energy6 months ago
Sending Progressive Philanthropist George Soros to Prison?
-

 Carbon Footprint2 years ago
US SEC’s Climate Disclosure Rules Spur Renewed Interest in Carbon Credits