

Disseminated on behalf of Sierra Madre Gold & Silver Ltd.
Silver is prized for its beauty and use in jewellery, but its true value today lies in technology. Silver is now a key material as the world shifts to renewable energy, electric vehicles, and advanced electronics. Its high conductivity and reflectivity make it essential for solar panels, EV batteries, and 5G networks.
For investors, this shift marks a new chapter for the silver market – one driven less by fashion and more by function. Companies like Sierra Madre Gold & Silver are ready to meet this growing demand for industrial and investment needs.
Rising Demand from the Green Transition
The clean energy transition is rapidly changing how silver is used. The Silver Institute reports that global silver demand hit a record 1.2 billion ounces in 2024. More than 30 percent of this was for industrial uses, mainly in solar power and electronics. That figure is set to rise as countries expand renewable energy capacity.
In 2024, industrial silver use hit an all-time high of 680.5 million ounces, driven by solar manufacturing, electric vehicles, and electronics. Solar energy alone now accounts for more than 30 percent of industrial demand.
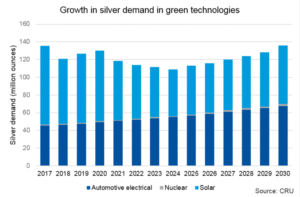
Each photovoltaic (PV) panel has 15–25 grams of silver. By 2030, solar installations may top 500 gigawatts each year. This could mean the sector needs 250 million ounces of silver annually.
Electric vehicles are another major source of growth. A single EV uses up to 50 grams of silver, roughly twice that of a traditional car. As production expands, the automotive sector’s silver demand could triple by 2030.
These trends are tightening the global silver market. Inventories are falling, and analysts warn of persistent supply deficits through the end of the decade.
The Supply Challenge: Falling Mine Output
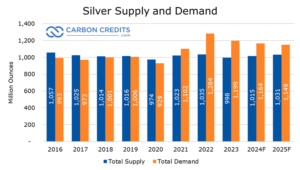
While demand surges, mine output is not keeping pace. The Silver Institute estimates global silver production at about 819.7 million ounces in 2024, up less than 1 percent from the previous year.
Even with this small rise, the world will have a 117.6 million-ounce supply deficit in 2025. This shows ongoing long-term shortages.
Mexico remains the world’s largest silver producer, contributing about 23 percent of global output. But much of this comes from aging or polymetallic mines, where silver is a by-product. New producers like Sierra Madre Gold & Silver attract investors. They blend modern exploration with production. This is happening in one of the richest silver belts on Earth.
Sierra Madre’s Portfolio: Reviving Proven Silver Assets
Sierra Madre Gold & Silver Ltd. (TSXV: SM, OTCQX: SMDRF) is advancing two key projects in Mexico’s Sierra Madre mineral belt: La Guitarra and Tepic. Together, they represent a blend of production and exploration upside.

- La Guitarra Mine (State of Mexico):
La Guitarra, acquired from First Majestic Silver Corp., is a fully permitted and producing underground operation. It already has processing infrastructure in place. The company reached commercial production at 500 tonnes per day in January 2025, with plans to expand to up to 1,500 tonnes per day by 2027. La Guitarra could restore one of Mexico’s best-known silver mines to its former prominence. - Tepic Project (Nayarit):
Tepic is a high-grade epithermal gold-silver deposit. It has near-surface mineralization, which means there’s great exploration potential. This also allows for options for future growth.
Sierra Madre cuts costs and timeline risks by targeting assets with established infrastructure and clear development paths. This approach is safer than working with early-stage explorers.
Positioned for the New Industrial Cycle
The global shift to cleaner energy sources is reshaping the silver market into something closer to a strategic commodity. Governments and industries now view silver as vital to achieving energy-transition goals. As demand outpaces supply, producers with near-term restart potential stand to benefit most.
Sierra Madre fits neatly into that narrative. The La Guitarra project has restarted production much quicker than greenfield developments. Those often need years for permits and construction. At the same time, its exploration project adds scalability and long-term growth potential.
Mexico has a strong mining infrastructure and a skilled workforce. It’s also close to North American industrial hubs. This gives Sierra Madre a big logistical advantage. The U.S. is putting policies in place to secure supply chains for key materials. This makes Mexico a more important and reliable supplier.
Market Dynamics: Silver as a Strategic Metal
Silver’s 2025 price action underscores profound shifts in its role within both industrial and investment spheres. After climbing nearly 25 percent year-to-date, silver shattered previous records by reaching its all-time high of $54.24 per ounce in October before correcting and settling in the high-$40 range.
Major analysts such as Metals Focus project that prices could breach the US$60 mark by late 2026 if current supply deficits and clean energy demand trends persist, citing strong industrial momentum – particularly in solar and electronics – as critical drivers.

Supporting this rally, silver exchange-traded products (ETPs) absorbed 95 million ounces in the first half of 2025, pushing global holdings to 1.13 billion ounces – just 7 percent below their all-time peak.
According to data from the World Silver Survey 2025, industrial fabrication demand reached a new record of 680.5 million ounces in 2024, maintaining upward momentum through 2025. The supply side remains structurally tight: analysts project a market deficit of roughly 149 million ounces this year, marking five consecutive years where demand has outpaced annual mine production.
Why Sierra Madre Stands Out
- Production: La Guitarra restart completed, targeting output ramp-up in 2026 and 2027.
- High-Quality Assets: Two projects in Mexico’s most productive silver-gold belt.
- Operational Readiness: A fully permitted plant and infrastructure at La Guitarra reduced start-up costs.
- Strong Market Tailwinds: Silver demand from solar, EVs, and electronics continues to set records.
- Experienced Leadership: Proven management team with expertise in Mexican mining operations.
These factors make Sierra Madre a unique mix of production, exploration, and expansion potential, and access to one of the fastest-growing industrial metals globally.
A New Chapter for Silver – and for Sierra Madre
Silver’s growing role in the clean-energy transition marks a turning point for the mining industry. Once seen mainly as a precious metal, it is now a cornerstone of the technologies driving global decarbonization.
Sierra Madre Gold & Silver is one of the few junior miners that successfully restarted a permitted mine in Mexico’s silver heartland and is planning a near-term expansion. This positions them well to benefit from the current structural shift. With rising demand and limited supply, the company is ready to continue with its strategy for La Guitarra. This move connects Mexico’s rich mining history with a clean-energy future.
- READ MORE: Reviving Mexico’s Silver Belt: How Sierra Madre’s La Guitarra Mine Is Leading the Comeback
DISCLAIMER
New Era Publishing Inc. and/or CarbonCredits.com (“We” or “Us”) are not securities dealers or brokers, investment advisers, or financial advisers, and you should not rely on the information herein as investment advice. Sierra Madre Gold and Silver Ltd. (“Company”) made a one-time payment of $25,000 to provide marketing services for a term of one month. None of the owners, members, directors, or employees of New Era Publishing Inc. and/or CarbonCredits.com currently hold, or have any beneficial ownership in, any shares, stocks, or options of the companies mentioned.
This article is informational only and is solely for use by prospective investors in determining whether to seek additional information. It does not constitute an offer to sell or a solicitation of an offer to buy any securities. Examples that we provide of share price increases pertaining to a particular issuer from one referenced date to another represent arbitrarily chosen time periods and are no indication whatsoever of future stock prices for that issuer and are of no predictive value.
Our stock profiles are intended to highlight certain companies for your further investigation; they are not stock recommendations or an offer or sale of the referenced securities. The securities issued by the companies we profile should be considered high-risk; if you do invest despite these warnings, you may lose your entire investment. Please do your own research before investing, including reviewing the companies’ SEDAR+ and SEC filings, press releases, and risk disclosures.
It is our policy that the information contained in this profile was provided by the company, extracted from SEDAR+ and SEC filings, company websites, and other publicly available sources. We believe the sources and information are accurate and reliable, but we cannot guarantee them.
CAUTIONARY STATEMENT AND FORWARD-LOOKING INFORMATION
Certain statements contained in this news release may constitute “forward-looking information” within the meaning of applicable securities laws. Forward-looking information generally can be identified by words such as “anticipate,” “expect,” “estimate,” “forecast,” “plan,” and similar expressions suggesting future outcomes or events. Forward-looking information is based on current expectations of management; however, it is subject to known and unknown risks, uncertainties, and other factors that may cause actual results to differ materially from those anticipated.
These factors include, without limitation, statements relating to the Company’s exploration and development plans, the potential of its mineral projects, financing activities, regulatory approvals, market conditions, and future objectives. Forward-looking information involves numerous risks and uncertainties, and actual results might differ materially from results suggested in any forward-looking information. These risks and uncertainties include, among other things, market volatility, the state of financial markets for the Company’s securities, fluctuations in commodity prices, operational challenges, and changes in business plans.
Forward-looking information is based on several key expectations and assumptions, including, without limitation, that the Company will continue with its stated business objectives and will be able to raise additional capital as required. Although management of the Company has attempted to identify important factors that could cause actual results to differ materially, there may be other factors that cause results not to be as anticipated, estimated, or intended.
There can be no assurance that such forward-looking information will prove to be accurate, as actual results and future events could differ materially. Accordingly, readers should not place undue reliance on forward-looking information. Additional information about risks and uncertainties is contained in the Company’s management’s discussion and analysis and annual information form for the year ended December 31, 2024, copies of which are available on SEDAR+ at www.sedarplus.ca.
The forward-looking information contained herein is expressly qualified in its entirety by this cautionary statement. Forward-looking information reflects management’s current beliefs and is based on information currently available to the Company. The forward-looking information is made as of the date of this news release, and the Company assumes no obligation to update or revise such information to reflect new events or circumstances except as may be required by applicable law.
For more information on the Company, investors should review the Company’s continuous disclosure filings available on SEDAR+ at www.sedarplus.ca.
Disclosure: Owners, members, directors, and employees of carboncredits.com have/may have stock or option positions in any of the companies mentioned: None.
Carboncredits.com receives compensation for this publication and has a business relationship with any company whose stock(s) is/are mentioned in this article.
Additional disclosure: This communication serves the sole purpose of adding value to the research process and is for information only. Please do your own due diligence. Every investment in securities mentioned in publications of carboncredits.com involves risks that could lead to a total loss of the invested capital.
Please read our Full RISKS and DISCLOSURE here.
The post Silver’s New Role in the Clean Energy Era – and What It Means for Sierra Madre Investors appeared first on Carbon Credits.
For most businesses, the emissions that matter most sit outside their own walls. Scope 3 emissions, everything generated across your value chain, from the suppliers who make your inputs to the customers who use your products, typically make up the majority of a company’s total carbon footprint. Under the Corporate Sustainability Reporting Directive (CSRD), those value-chain emissions now have to be measured and disclosed with a rigour that spend-based estimates alone struggle to satisfy. This guide sets out how to improve Scope 3 data accuracy for CSRD: the calculation methods open to you, how to move from estimates to verified supplier data, and how to govern that data so it holds up to audit.
![]()
A carbon credit is a commitment that extends well into the future. The tonne of CO₂ compensated for today from a nature-based carbon project must remain out of the atmosphere for good, which means the forest behind the credit has to remain standing long after the transaction is complete. For any buyer, this raises a defining question: What ensures that the forest endures?
![]()
What replaced the cheap REDD credit on the boardroom slide deck, and why procurement is leading the rewrite.
Three years ago, a corporate slide showing a portfolio of cheap REDD+ credits could carry a board meeting. The number was big, the price was low, and the press release wrote itself. Today, that same slide gets sent back with questions. The questions are uncomfortable, the answers are unclear, and your general counsel is suddenly in the room.
Conventional carbon offsets are not dead. The voluntary carbon market retired 202 million tonnes in 2025, and the Morgan Stanley Institute for Sustainable Investing survey published in January 2026 confirmed that interest from corporate buyers remains substantial. What changed is the credibility threshold. The integrity floor has risen, the disclosure scrutiny has tightened, and the buyer profile has shifted. This article tracks what changed, what sophisticated buyers now ask before signing, and what serious corporates are putting on the board slide instead.
What boards used to buy, and why it stopped working
The 2020 to 2022 model was simple: buy a large tranche of avoidance credits at low single-digit prices, retire them against the company footprint, announce the carbon-neutral claim, and move on. Most of those credits came from REDD+ projects, renewable energy installations in countries where the renewable energy was already economic, or methane projects with thin documentation.
Several things broke that model. Academic research published in 2023, including a widely cited Science paper, found that the majority of REDD+ credits issued under the most common methodologies did not represent additional reductions when tested against rigorous counterfactuals. The Voluntary Carbon Markets Integrity Initiative published its Claims Code of Practice, which sets requirements for what companies can credibly claim from credit use. The European Union finalised its Green Claims Directive, restricting how companies can describe products as climate-neutral. France’s Décret 2022-539 already restricts carbon neutrality advertising. California’s AB 1305 imposes disclosure requirements on any company making net-zero or carbon-neutral claims while doing business in the state.
The collective effect: the cheap credit no longer buys the announcement, and the announcement now carries litigation risk.
The integrity reset: ICVCM, VCMI, and what changed
The Integrity Council for the Voluntary Carbon Market published the Core Carbon Principles in 2023 and began assessing methodologies against them in 2024. The first methodologies received the CCP label later that year. The point of the label is to give corporate buyers a defensible quality screen they can cite in disclosure.
The Voluntary Carbon Markets Integrity Initiative complements this on the demand side. Its Claims Code of Practice defines what a buyer can say (Silver, Gold, or Platinum claims, with associated requirements) based on the quality of credits used and the underlying decarbonisation strategy. Together, CCP and VCMI build a quality stack: CCP on the supply, VCMI on the claim, with the science-based target sitting underneath both.
The reset is not a ban on offsets. It is a ratchet. Credits that meet the new bar continue to clear; credits that do not, do not. The Morgan Stanley survey found that 61% of current buyers like the CCP label concept but that supply of labelled credits remains limited. That supply constraint is now visible in pricing.
What sophisticated buyers ask before they sign
The questions on the procurement scorecard have changed. A 2022 buyer might have asked about price, vintage, and project type. A 2026 buyer asks five different questions before any of those.
- What does the counterfactual look like, and who validated it.
- What is the permanence regime, and what is the buffer pool exposure.
- What is the leakage risk, and how is it mitigated.
- What rating has the project received from the independent ratings agencies (Sylvera, BeZero, Calyx Global), and what was the rationale.
- What is the documentation discipline that survives an audit four years from now when the procurement team that signed the contract has moved on.
If the vendor cannot answer those five questions on a first call, the conversation ends. Conversely, if the vendor can answer them with documented specificity, the conversation often expands beyond a single transaction toward a multi-year engagement.
Where this leaves your near-term commitments
You probably have near-term commitments that pre-date the integrity reset. Public targets to be carbon neutral by 2025 or 2030. Product-level claims that ran in last year’s marketing. Disclosed reduction trajectories that assumed continued access to cheap credits.
You have three workable paths. The first is to re-baseline your strategy, replacing the most exposed credits with higher-quality alternatives and adjusting the public language to match what you can defend. The second is to shift the underlying spend from offsetting outside your value chain to investing inside your value chain, where reductions count against Scope 3 directly and the audit trail is cleaner. The third is to keep the strategy and absorb the risk, which is increasingly the most expensive option once you price in litigation, restatement, and reputational exposure.
Most serious buyers are choosing the second path. It moves the carbon spend from a compliance cost to a procurement and resilience investment, and it removes the central failure point of the legacy model: the disconnect between where the emissions occurred and where the reductions sat. Nature-based supply chain investments, structured under the GHG Protocol Land Sector and Removals Standard and aligned to the SBTi FLAG Guidance, are the asset class that fits this brief. They generate inventory-grade reductions, they produce audit-grade documentation, and they survive the new claim restrictions because the carbon math sits inside the value chain that the disclosure already covers.
If you are reassessing a carbon strategy under the new integrity bar, or rebuilding a board narrative that has to survive a more skeptical audience, the carbon and sustainability experts at Carbon Credit Capital can help. The Dual-Value Model gives you a defensible alternative to legacy offset purchases, with the documentation and operational integration that survives the procurement scorecard and the audit. Schedule a consultation.


-
Climate Change11 months ago
Guest post: Why China is still building new coal – and when it might stop
-
Greenhouse Gases11 months ago
Guest post: Why China is still building new coal – and when it might stop
-

 Greenhouse Gases2 years ago
嘉宾来稿:满足中国增长的用电需求 光伏加储能“比新建煤电更实惠”
-

 Climate Change2 years ago
嘉宾来稿:满足中国增长的用电需求 光伏加储能“比新建煤电更实惠”
-
Climate Change2 years ago
Bill Discounting Climate Change in Florida’s Energy Policy Awaits DeSantis’ Approval
-

 Renewable Energy9 months ago
Sending Progressive Philanthropist George Soros to Prison?
-

 Carbon Footprint2 years ago
US SEC’s Climate Disclosure Rules Spur Renewed Interest in Carbon Credits
-
Greenhouse Gases1 year ago
嘉宾来稿:探究火山喷发如何影响气候预测