
The global carbon credit market reached a clear turning point in 2025. Volumes declined. Prices rose. Buyer behavior shifted. Policy signals strengthened. At the same time, long-term commitments surged through record-breaking offtake deals.
These changes show a market moving away from scale at any cost. Instead, quality, integrity, and compliance eligibility now shape value. This article reviews the major trends that defined the carbon credit market in 2025 using various industry reports and explains what they mean for 2026 and beyond.
Why 2025 Marked a Turning Point for the Carbon Credit Market
For much of the past decade, growth in the voluntary carbon market was driven by volume. More credits were issued. More were retired. Prices stayed low. Quality concerns often came second.
That model no longer holds.
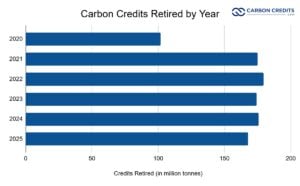
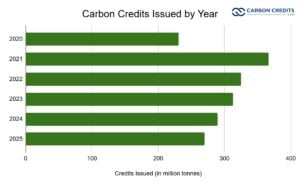
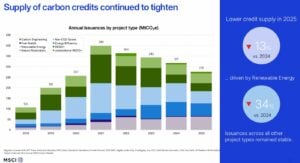
In 2025, total credit retirements fell to about 168 million tonnes, down 4.5% year on year, according to Sylvera report. New issuances also declined, reaching roughly 270 million tonnes, the lowest level since 2020. On the surface, this looks like a contracting market.
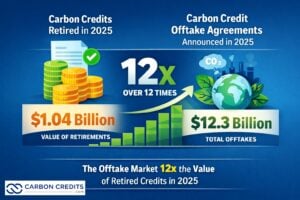
Yet market value moved in the opposite direction. Total spending on carbon credits rose to around $1.04 billion, up from about $980 million in 2024. The average price paid increased to roughly $6.10 per credit.
This shift matters. It shows that market growth is no longer tied to volume alone. Instead, it is driven by higher prices for credits seen as credible, durable, and compliant with future rules.
The reports point to two forces driving this change. First, buyers are paying more for higher-quality credits. Second, compliance-driven demand is starting to reshape the market. Together, these forces signal a transition toward a more structured and selective market.
Supply, Demand, Issuances, and Retirements: What Really Changed in 2025
The balance between supply and demand changed in important ways during 2025.
On the supply side, issuances declined across several major project types. Renewable energy credits saw the sharpest drop. These projects have long faced questions around additionality. Many buyers now see them as low impact. As a result, fewer new renewable credits entered the market.
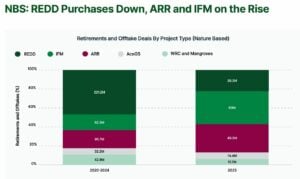
Nature-based credits still dominate total volumes. Forestry and land-use projects remain the largest source of issued and retired credits. However, within this category, the mix is changing.
Buyers are moving away from older REDD+ projects and toward improved forest management, afforestation, reforestation, and agriculture-based projects. Allied Offsets data show the following mix:
On the demand side, retirements fell slightly, but this does not signal weakening interest. Corporate demand remained stable in terms of buyer count. What changed was how companies bought credits and what they were willing to pay.
Importantly, compliance use now accounts for about 23% of all retirements. Programs in California, Quebec, South Africa, and Chile contributed to this growth. This share is expected to rise as new compliance systems scale up.
Another key signal comes from inventory data. Credits rated BBB or higher have been in deficit since 2023. In 2025, this deficit continued for a third straight year. At the same time, lower-rated and unrated credits remained heavily oversupplied. Unrated credits alone added an estimated 88 million tonnes to inventory in 2025.
This split highlights a structural imbalance. The market does not lack the credits overall. It lacks the credits that buyers trust.
Nature, Tech, and Removals: The Credit Mix Evolves
The mix of credit types continued to rotate in 2025, reflecting buyer concerns about integrity and future eligibility.
-
Nature-based credits
Nature-based credits still make up the majority of market activity. However, not all nature credits are treated equally.
Legacy REDD+ projects lost market share. High-profile integrity concerns reduced buyer confidence. Prices weakened for lower-rated REDD+ credits. In contrast, well-rated afforestation and reforestation (ARR) projects gained ground. Buyers showed a clear preference for projects with stronger monitoring, permanence, and land tenure controls.
Agriculture-based credits also expanded. These projects often offer measurable co-benefits for soil health and livelihoods. Buyers increasingly value these attributes.
-
Technology-based avoidance credits
Credits from renewable energy projects continued to decline. Waste management, landfill gas, and industrial efficiency projects filled some of this gap. These projects often face lower additionality risks and clearer baselines.
-
Carbon removal credits
Carbon removal credits remain a small share of current retirements. In 2025, durable removals accounted for well under 1 million tonnes of issuances and retirements.
Yet removals are central to the market’s future. This is most visible in the forward market. Most large offtake deals focus on durable carbon removal, such as direct air capture, biochar, BECCS, and enhanced mineralization.
The CDR-focused report highlights why. Net-zero targets increasingly require removals to address residual emissions. Avoidance credits alone are not enough. This structural demand explains why removals command much higher prices and long-term commitments.
Prices, Quality Premiums, and What Buyers Are Paying For
Headline prices only tell part of the story.
In 2025, the average spot price was around $6.10 per credit. But actual prices varied widely by project type, rating, and co-benefits.
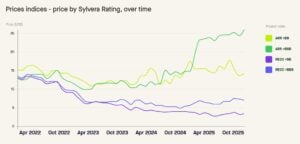
Afforestation and reforestation credits traded anywhere from $2 to over $50. Half of the ARR credits fell between $5 and $25. REDD+ credits showed similar dispersion but at lower levels. Quality became the main driver of these differences. For the first time, ratings were clearly embedded in pricing.
ARR projects rated BBB or higher averaged about $26 per credit. Lower-rated ARR projects averaged closer to $14. Unrated projects traded even lower. A similar pattern appeared in REDD+ credits.
Co-benefits added another layer. Projects with strong biodiversity or community outcomes earned clear price premiums. Buyers were willing to pay more for credits that delivered visible social and environmental value beyond carbon.
In the forward market, prices looked very different. Offtake agreements signed in 2025 implied average prices of around $160 per credit. These prices reflect the high costs and limited supply of durable removals, not spot market conditions.
The result is a two-tier market. One tier is a fragmented spot market with wide price ranges. The other is a concentrated forward market built around high-integrity removals.
Investments and Movers: Who’s Driving the Market
Private investment in carbon removal companies between 2021 and 2025 reached approximately $3.6 billion, with direct air capture (DAC) attracting the largest share of capital over that period.
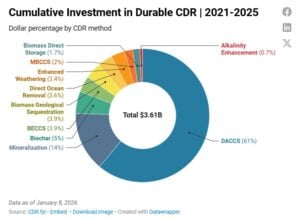
However, investment activity contracted in 2024 and continued into 2025, even as offtake deals expanded. This highlights a gap between commercial commitments and early‑stage funding scaling.
Major Corporate Buyers and Retirees
Corporate engagement shapes much of the 2025 retirement landscape. Several household names emerged as significant purchasers and retirees:
- Microsoft remained the single largest buyer of carbon removal credits, accounting for over 90% of removal volume in the first half of 2025.
- Energy and utility firms accounted for a sizable portion of total retirements, as indicated in broad market data on retiree sectors.
- While comprehensive ranked data for all major buyers in 2025 is not fully disclosed publicly, MSCI analysis of prior data indicates that energy companies, transport firms, and services sectors have historically been among the top retirees when disclosure is available.
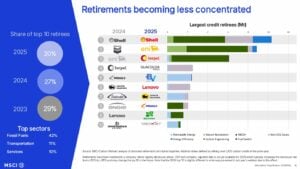
Regional retirements also suggest significant corporate participation from Asia, Europe, and North America. This reflects global corporate climate commitments.
Offtake Spotlight: Forward Deals Speak Louder Than Volumes
Offtake agreements were one of the clearest signals of future market direction in 2025.
The total value of offtake deals announced during the year reached about $12.25 billion, up from roughly $4 billion in 2024. This is more than 12 times the value of credits retired in the spot market.
Yet the volumes involved remain modest. These deals are expected to deliver around 10 million credits per year through 2035. That is less than 10% of current annual retirements.
This gap matters. It shows that buyers are willing to commit large sums to secure limited volumes of high-quality supply. A small group of buyers dominates this space. Microsoft alone accounted for the vast majority of durable removal offtake volume in 2025.
These agreements serve two purposes. They secure future supply in a tight market. They also send strong price signals. If even a fraction of spot market demand shifts toward similar quality thresholds, total market value could grow significantly without higher volumes.
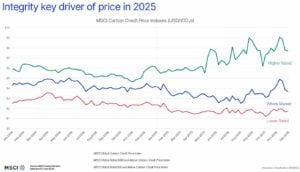
Integrity Meets Policy: Compliance and Ratings Reshape Value
Integrity concerns shaped much of the market’s evolution in 2025.
Buyers are no longer satisfied with claims alone. Ratings, improved methodologies, and third-party assessments now influence decisions. This shift is reinforced by policy.
Compliance and voluntary markets are converging. Credits that can meet compliance rules often command higher prices. This is especially true for credits eligible under CORSIA or aligned with ICVCM’s Core Carbon Principles.
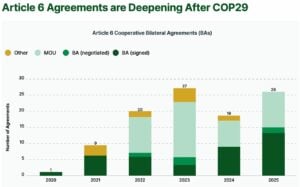
In 2025, nearly half of all credits issued came from methodologies potentially eligible for CORSIA. This share continues to rise. At the same time, Article 6 moved from theory to practice. Twenty new bilateral deals were signed in 2025, bringing the total to over 100 agreements.
Moreover, corresponding adjustments emerged as a central issue. Credits with a corresponding adjustment are now clearly differentiated from those without. This distinction affects pricing, eligibility, and long-term demand. Some analysts expect corresponding adjustments to become a tradable element of the market.
Policy signals also strengthened corporate demand. Draft updates to the SBTi Net-Zero Standard clarified how credits can be used alongside emissions reductions. This reduced uncertainty for buyers planning long-term strategies.
The Outlook for 2026 and Beyond
The near-term outlook points to a tighter and more complex market.
In 2026, supply constraints for high-quality credits are likely to persist. New issuances are not rising fast enough to meet demand for BBB+ credits. Prices for trusted nature-based projects are likely to remain firm or increase.
Compliance demand will continue to grow. Modeling suggests compliance use could exceed voluntary demand as early as 2027, driven by CORSIA Phase 1 and expanding domestic systems. By the mid-2030s, domestic compliance markets could become the largest source of demand.
Carbon removal credits will remain scarce in the short term. Actual retirements will lag commitments. However, investment and offtakes signal strong long-term growth. As methodologies mature and costs fall, removals will play a larger role in both voluntary and compliance settings.
The carbon credit market in 2025 did not collapse. It restructured.
For the market as a whole, the direction is clear. Volume alone no longer defines maturity. Quality, integrity, and policy alignment do. Buyers became more selective and prices began to reflect integrity. Policy moved closer to implementation. Offtake deals revealed long-term expectations.
The carbon credit market of 2026 and beyond will likely be smaller in volume than past projections, but higher in value, more regulated, and more closely tied to real climate outcomes.
- FURTHER READING: Top Carbon Credit Companies to Watch in 2026
The post The Carbon Credit Market in 2025 is A Turning Point: What Comes Next for 2026 and Beyond? appeared first on Carbon Credits.
Key takeaways
- SBTi is the default reference point for corporate climate action: 51% of Fortune Global 500 companies now hold net-zero targets, up from 8% in 2020, and over 11,000 organizations worldwide have SBTi-validated targets.
- Net Zero Standard V2 redefines climate leadership as reducing emissions and mitigating ongoing emissions, not reduction alone.
- The new standard adds flexibility through five-year cycles, a “best efforts” standard, and an Asset Transition Method for companies whose path to net-zero doesn’t fit a straight-line trajectory.
- Voluntary carbon credits are formally recognized for the first time, with reduction and removal credits accepted from 2027, and removals required from 2035.
- Companies with 2030 targets keep using V1 for their current cycle and move to V2 in 2028; companies without targets can start using V2 on February 1, 2027.
Why every business needs to understand the SBTi Net-Zero Standard revision
The Science Based Targets initiative (SBTi) has become the default reference point for credible corporate climate action. Net-zero targets are now held by 51% of Fortune Global 500 (FG500) companies, up dramatically from just 8% in 2020, and more than 11,000 organizations worldwide have set SBTi-validated targets.
However, SBTi’s influence extends well beyond the companies formally participating in the program. Every business in the value chain of an SBTi participant will have to reduce its own carbon emissions, and businesses that aren’t SBTi participants themselves still look to the program for guidance on climate action.
In short, SBTi gives every business a credible blueprint for climate action, and companies that follow its principles can pursue climate action with confidence, whether or not they’re formally part of the program.
How will the Net Zero Standard revision affect business climate action?
SBTi participation is expected to grow. Despite strong target-setting participation among the F500, only 17% of companies use the SBTi Net Zero Standard V1 beyond target setting, largely because its rules have been seen as too rigid to apply in practice. Much of the Net Zero Standard revision has focused on creating more flexibility to enable higher participation. Medium and small businesses will also increasingly feel pressure for climate action, since SBTi mandates that its participants reduce carbon emissions across their value chains.
Net Zero Standard V2 also redefines climate leadership: leading climate action now means reducing emissions and mitigating ongoing emissions. Reducing your own emissions while ignoring the emissions you continue to release along the way is no longer considered leadership. Supporting voluntary carbon projects with high-integrity carbon credits is now backed by the leading authority on corporate climate action.
What lessons shaped the Net Zero Standard V2 revision?
The revision reflects a few learnings about what actually drives climate progress, and how SBTi built those lessons into the new standard.
| Net Zero Standard V1 Learnings | Net Zero Standard V2 Implementation |
|---|---|
| Making real short-term progress is more important and more difficult than making big long-term promises | Focus on short-term climate progress |
| Every company has a different path to net zero that doesn’t always fit generalized net-zero rules | Create asset transition plans based on each company’s unique asset lifecycles and capital planning |
| We need to mitigate our ongoing emissions to keep global carbon emissions in check | Reduce global carbon emissions by financing voluntary carbon projects with high-integrity carbon credits |
What are the key changes between the old and new Net Zero Standard?
Both versions of the standard are grounded in net-zero by 2050. However, the old standard treated climate leadership as simply reducing emissions, expected a long-term commitment to net zero, based emission reduction targets on generalized net-zero goals, revoked status from companies that fell behind on targets, and ignored voluntary carbon projects entirely.
The new standard treats climate leadership as reducing emissions and mitigating ongoing emissions. It shifts the focus to short-term progress through five-year cycles, and it bases emission reduction targets on both the net-zero goal and a company’s own asset decarbonization plan. A new Asset Transition Method lets companies set decarbonization targets through asset plans with committed, verifiable steps; an ambitious but achievable path based on a company’s starting point, financial resources, and technology, with multiple pathways to reflect the unique opportunities and constraints of different industries and companies.
Crucially, the new standard moves to a “best efforts” basis that creates real flexibility on progress against targets. Businesses that miss their targets can keep their status if they’ve used “every lever” within their control, and minimum progress rules will be set out in the SBTi Assurance Manual.
Finally, the new standard formally uses voluntary carbon projects to mitigate ongoing emissions. From 2027 through 2034, this mitigation is recognized, and both carbon reduction and removal credits are accepted. From 2035 forward, mitigation with carbon removal credits becomes required, with durability matching between the removal and the emission it offsets.
| Old Net Zero Standard | New Net Zero Standard |
|---|---|
| Grounded in net-zero by 2050 | Grounded in net-zero by 2050 |
| Climate leadership is reducing emissions | Climate leadership is reducing emissions and mitigating ongoing emissions |
| Make a long-term commitment to net-zero | Focus on short-term progress in 5-year cycles |
| Emission reduction targets are based on net-zero goal |
|
| Businesses who fall behind targets lose status |
|
| Ignores voluntary carbon projects |
|
When does the new Net Zero Standard take effect?
Companies with existing 2030 targets should continue using the old Net Zero Standard for their current cycle, and start using the new Net Zero Standard in 2028 to set targets for the next cycle (2030–2035).
Companies that don’t yet have targets can use the new Net Zero Standard starting February 1, 2027.
What are SBTi’s Category A and Category B companies?
The new Net Zero Standard splits companies into two categories, with different requirements attached to each.
Category A covers large companies from all countries and medium-sized companies from high-income countries. A company from any country qualifies if it meets at least one of: net turnover of €450 million or more, or 1,000 or more full-time employees. A company from a high-income country qualifies if its Scope 1 and 2 emissions are 10,000 tCO2e or more, or if it meets at least two of: balance sheet of €25 million or more, net turnover of €50 million or more, or 250 or more full-time employees.
Category B covers small companies from all countries and medium-sized companies from lower-income countries.
How do Scope 1 targets work under Net Zero Standard V2?
Scope 1 targets aim to transition companies to net-zero direct emissions by 2050 or sooner, and companies can choose from three approaches.
- Absolute emissions reduction follows a straight-line emissions trajectory from the target base year to the net-zero year.
- Emissions intensity reduction lets companies follow sector-specific pathways designed to reflect the reduction opportunities available in sectors like steel, cement, or chemicals.
- Asset transition is designed for companies whose capital stock turnover doesn’t follow a linear or sector pathway. These companies design a transition plan to operate existing assets efficiently and replace them with low-carbon assets, using predetermined milestones.
How do Scope 2 targets work under Net Zero Standard V2?
Scope 2 targets address emissions from purchased electricity through three pathways:
- Reducing electricity consumption,
- Reducing grid consumption by installing onsite or direct-line offsite clean energy generation, and
- Cleaning up the regional grid using market-based tools like PPAs, RECs, and GOs that drive clean energy development.
V2 introduces a dual Scope 2 framework requiring two separate targets, with an overall goal of 100% low-carbon electricity by 2040.
The location-based target addresses the carbon intensity of a company’s physical power use, and requires companies to show that their grid consumption is falling and/or that their physical grid use is getting cleaner; in other words, that their market-based solutions are actually making the grid cleaner.
The market-based (or zero-carbon electricity) target tracks a company’s use of low-carbon power generation contracts and Energy Attribute Certificates. It requires geographical matching of these certificates with electricity consumption based on deliverability regions (grid regions); annual matching is allowed, though hourly matching is encouraged. Category A companies with large electricity loads must report the percentage of their Scope 2 electricity consumption matched with low-carbon attributes on an hourly basis, and there’s an optional recognition framework for companies that meet hourly matching thresholds.
How do Scope 3 targets work under Net Zero Standard V2?
Scope 3 targets share the same 2050-or-sooner net-zero goal, but companies set near-term targets only for material emissions sources in their value chain and areas where they have real influence. Long-term Scope 3 targets are generally not required.
Limited, justified exclusions are allowed for near-term targets, including categories that individually account for less than 5% of total Scope 3 emissions, and activities where a company lacks practical influence, like leased assets it doesn’t operationally control, or the processing of sold products. Optional exclusions are also available in specific categories.
Companies can choose from three approaches to near-term Scope 3 targets:
- An overarching emissions reduction target, which follows a linear contraction of emissions from the base year to residual emissions of 10% or less by 2050 or sooner;
- An overarching supplier/customer alignment target, benchmarked against a growing share of tier 1 suppliers and customers reaching net-zero by 2050 or sooner; or
- A category- or activity-specific target, tailored for companies with concentrated emissions in particular Scope 3 categories or high-emitting activities.
What is “ongoing emissions mitigation” under the new SBTi standard?
This is one of the most significant additions in Net Zero Standard V2. Accelerated climate contributions are needed to help the world achieve climate objectives, limit temperature overshoot, mitigate transition risks, and support the scale-up of climate solutions, and V2 formally recognizes that. Ongoing emissions mitigation runs as a parallel track to companies also reducing their own emissions.
The framework is initially voluntary, with recognition available at three contribution levels to encourage early action.
- Engaged companies address more than 1% of total Scope 1, 2, and 3 emissions.
- Advanced companies address more than 10% of total Scope 1, 2, and 3 emissions, including 100% of Scope 1 and 2 emissions.
- Leadership companies address 100% of total Scope 1, 2, and 3 emissions with a contribution budget of $80/tCO2e.
Carbon credits used for this purpose have to meet certain quality standards. They must be ex-post (issued after the mitigation has actually occurred), independently third-party-assured, emissions reductions or removals, measured in tCO2e, that occur within five years prior to the reporting year. They must be sourced from outside the company’s own value chain. Further minimum criteria will be set to align with high-integrity frameworks, with additional details on the recognition program expected in the second half of 2026.
Starting in 2035, carbon removals become mandatory for Category A companies. From that point, the carbon removal coverage requirement rises linearly from 1% of Scope 1–3 emissions to 100% by a company’s net-zero year. Within that, 10% of long-lived GHG emissions must specifically be covered by durable removals, also rising linearly to 100% by the net-zero year.
How must companies neutralize residual emissions?
At a company’s net-zero target year and thereafter, it must reduce its Scope 1, 2, and 3 emissions to zero or to residual levels, and neutralize all residual emissions using eligible carbon removals. Those removals have to meet two conditions: they must occur within the same reporting period as the residual emissions they’re neutralizing, and long-lived GHGs must be neutralized with long-lived removals, matching the durability of the removal to the atmospheric lifetime of the emission being addressed.
What is the SBTi implementation hierarchy?
Net Zero Standard V2 also lays out how companies should prioritize their actions for credible target delivery, in three tiers.
- Direct actions, at the activity level, are actions that reduce emissions at the source within a company’s own operations and value chain; things like efficiency improvements, fuel switching, and engaging suppliers and customers to reduce their emissions.
- Actions within shared systems, or activity pools that reduce the emissions of shared systems like electricity or gas grids. This includes market instruments that convey low-carbon attributes, such as PPAs, RECs, and GOs, all of which must meet minimum integrity criteria that SBTi will elaborate on in future guidance.
- Sector-level actions relate to the same type of activity occurring in a relevant geography or system, in a way that meaningfully reduces the emissions a company is responsible for.
How Terrapass helps businesses meet the new SBTi standard
As the rules around carbon credits become more rigorous, the quality of the credits behind them matters more than ever. Terrapass has expanded our global network of carbon projects: more project types, locations, prices, ICVCM CCPs, and UN SDGs, spanning super-pollutant destruction, nature-based solutions, and durable removals. We offer Green-e® Climate Certification and we only source from third-party-verified projects on ICVCM-Eligible registries.
We also help clients with impact beyond carbon: EACs, RECs, and GOs including Green-e® Certified credits that support leading renewable energy projects; water credits that support water restoration projects; and custom environmental product needs like RNG and SAF. Wherever your organization is on its sustainability journey, we help clients around the world address climate risk, advance their environmental and social goals, and get the most out of their sustainability budgets.
FAQ: SBTi Net-Zero Standard revision
What is the SBTi Net-Zero Standard?
It’s the framework the Science Based Targets initiative publishes for companies that want validated, credible net-zero targets tied to limiting global warming.
What is changing in the SBTi Net Zero Standard V2 revision?
The biggest changes are more flexibility (five-year cycles and a “best efforts” standard), a new Asset Transition Method for companies whose emissions don’t follow a straight-line path, and formal recognition of voluntary carbon credits for mitigating ongoing emissions.
When do companies need to switch to the new SBTi standard?
If your company already has 2030 targets, you keep using V1 for your current cycle and move to V2 in 2028. If you don’t have targets yet, you can start using V2 as of February 1, 2027.
Can companies use carbon credits to meet SBTi targets?
They can. Under V2, high-integrity carbon reduction and removal credits count toward mitigating ongoing emissions from 2027 through 2034. Starting in 2035, only removal credits count, and they need to be durability-matched to the emissions they offset.
What’s the difference between Category A and Category B companies under SBTi?
Category A is large companies everywhere plus medium-sized companies in high-income countries, based on thresholds like revenue, headcount, or emissions. Category B is small companies everywhere and medium-sized companies in lower-income countries.
What happens if a company misses its SBTi target?
Under the old standard, falling behind could cost a company its SBTi status. Under V2’s “best efforts” approach, a company can hold onto its status as long as it’s used every lever within its control, with minimum progress rules coming in the SBTi Assurance Manual.
Sources: This post is based on Terrapass’s internal analysis of the SBTi Corporate Net-Zero Standard V2.0. Facts and figures were checked against SBTi’s official V2.0 announcement, SBTi’s Corporate Net-Zero Standard V2.0 — Chapter 6: Ongoing Emissions Responsibility, Trellis’s coverage of the standard, Trellis’s reporting on Ongoing Emissions Recognition costs, Sylvera’s analysis of what comes next, Anthesis Group’s Fortune 500 net-zero commitments research, and Climate Impact Partners’ seventh annual FG500 analysis, as reported by CarbonUnits.com.
The post SBTi Net-Zero Standard V2: What the Revision Means for Every Business appeared first on Terrapass.
For most businesses, the emissions that matter most sit outside their own walls. Scope 3 emissions, everything generated across your value chain, from the suppliers who make your inputs to the customers who use your products, typically make up the majority of a company’s total carbon footprint. Under the Corporate Sustainability Reporting Directive (CSRD), those value-chain emissions now have to be measured and disclosed with a rigour that spend-based estimates alone struggle to satisfy. This guide sets out how to improve Scope 3 data accuracy for CSRD: the calculation methods open to you, how to move from estimates to verified supplier data, and how to govern that data so it holds up to audit.
![]()
A carbon credit is a commitment that extends well into the future. The tonne of CO₂ compensated for today from a nature-based carbon project must remain out of the atmosphere for good, which means the forest behind the credit has to remain standing long after the transaction is complete. For any buyer, this raises a defining question: What ensures that the forest endures?
![]()


-
Climate Change12 months ago
Guest post: Why China is still building new coal – and when it might stop
-
Greenhouse Gases12 months ago
Guest post: Why China is still building new coal – and when it might stop
-

 Greenhouse Gases2 years ago
嘉宾来稿:满足中国增长的用电需求 光伏加储能“比新建煤电更实惠”
-

 Climate Change2 years ago
嘉宾来稿:满足中国增长的用电需求 光伏加储能“比新建煤电更实惠”
-
Climate Change2 years ago
Bill Discounting Climate Change in Florida’s Energy Policy Awaits DeSantis’ Approval
-

 Renewable Energy9 months ago
Sending Progressive Philanthropist George Soros to Prison?
-

 Carbon Footprint2 years ago
US SEC’s Climate Disclosure Rules Spur Renewed Interest in Carbon Credits
-
Greenhouse Gases1 year ago
嘉宾来稿:探究火山喷发如何影响气候预测