
As the world heats up, sport is becoming more dangerous. Many amateur athletes risk their lives running in more extreme temperatures and, even at the elite level, some have collapsed, asking officials what happens if they die in the heat of the Summer Olympics. But how are the Winter Games impacted?
For snow sports – which will be showcased when the Winter Olympics start in the Italian Alps this week – climate change may not be as life-threatening but it is a major risk to their viability.
Many ski slopes already have to produce expensive artificial snow for much of the winter. A 2024 study found that the list of cities which are reliably cold enough to host a Winter Olympics will fall from 87 to 52 by the 2050s. For the Paralympics, which are typically held in warmer March, the threat is even worse.
But like any big event, the Winter Olympics contribute to climate change too. A report by Scientists for Global Responsibility estimates that the carbon footprint of the 2026 Games will be similar to the annual emissions of Somalia.
On top of that, the organisers of the Milano Cortina Games have drawn criticism from green groups for partnering with Eni, an Italian energy multinational whose oil and gas production has led it to be ranked as the world’s 34th highest greenhouse gas-emitting company.
For more than 16 years, Julie Duffus has worked on Olympic sustainability – first, with the organisers of London 2012, then Rio 2016 and currently as the head of sustainability at the International Olympic Committee (IOC), which picks Olympic host cities and works with them to put on the Games.
Climate Home News asked Duffus how the Winter Olympics are coping with the climate crisis and what organisers are doing to reduce their role in heating up the planet.
-
Cooling towers, fake snow: What the Beijing Winter Olympics says about climate change
The spectacle of fake snow and an old steel mill’s cooling towers has sparked climate debate among Olympics-watchers -
‘Hottest games ever’: At the Tokyo Olympics, elite sport met the climate crisis
Athletes fainted as wet bulb temperatures reached dangerous levels in Tokyo, raising questions about the future of major sporting events in an overheated world -
Saudi visa crackdown left heatwave-hit Hajj pilgrims scared to ask for help
Pilgrims without the right type of visa were denied medical treatment, survivors say, during a 52C heatwave which killed hundreds


Q: Is climate change threatening the Winter Olympics?
A: We’re certainly not sitting here in denial that climate change is impacting – not just the Games actually – but all of us around the world. For years, we’ve been doing research on the impact of climate change on the Games and the future host territories. There are some scenarios where the snow is retreating and we need to address that seriously. So this is definitely something that is on our radar and that we are taking very seriously.
Q: Are there plans to produce artificial snow for these Winter Olympics? And, if so, how green is that? What energy has been used to produce that?
Technical snow, as it’s called, has been produced now for decades and it’s not just something that’s produced for an Olympic Games. If you go skiing pretty much anywhere in the world now, a lot of them will rely on technical snow.
But Milano Cortina 2026 is significantly reducing that amount of technical snow compared to previous Games. And a lot of innovation has gone into the development of the snow machines. They’re working on HVO biofuels for the first time – so this is a very nice legacy that we will leave behind for these communities that rely on winter sports.
The snow machines also have sensors so that they can track the depth of the snow that’s fallen versus the technical snow, so they can reduce quite significantly the amount of technical snow that needs to be made. And that’s a first and this is what we love about the Games because it’s pushing innovation for the future of these communities.
Q: What are the organisers doing to reduce the greenhouse gas impact from the construction of venues?
A: The most effective way to cut construction emissions is to avoid unnecessary construction in the first place – and that’s exactly what Milano Cortina is doing.
For this Games, around 85% of the competition venues are already existing. That includes some iconic world-class venues, with a few even used back at the Olympic Games in Cortina in 1956. By relying heavily on what already exists, organisers reduce construction and related emissions that would come from any large-scale development.
This is in line with IOC’s strategy to reduce the climate impact of the Games by building less. The strategy is to adapt the Games to the host, not the other way around, and to encourage organisers to use what’s already there, adding new infrastructure only when it’s genuinely needed in the long-term and for the benefit of its communities.
Q: And how about the greenhouse gas impact from people travelling to the Games?
A: Bringing people together to celebrate sport and unity requires travel, and travel is a source of emissions for any Games. Spectator travel is also included in the IOC’s carbon methodology, so these emissions will be measured and reported transparently after the Games. The IOC delegation are travelling by train from Switzerland, and teams will move between Milan and Cortina using public transport.
At the same time, both the hosts are working to use the Games as a catalyst for public transport improvements – through upgrades to existing train and metro lines, making transport more accessible, and, as we’ve seen in many past Games editions, extending public transport services in ways that benefit host communities well beyond the event.
Q: Scientists for Global Responsibility have called for spectators who travel by train, coach or car to get cheaper tickets than those fly. Would you consider that?
A: We are currently researching many options to reduce our transport impacts. Both the IOC and the Organising Committee’s carbon management plans have transport as an important element, with spectators covered by the Organising Committee’s plan.
Q: Over 20,000 people have signed a petition against the Games being sponsored by Italian oil and gas company Eni. Do you think this partnership will accelerate climate change by promoting a fossil fuel company?
A: We’re currently at a stage in the world, not just the Games, of a transition. Eni is a domestic partner of the Milano Cortina 2026 Organising Committee, who are working with them on that transition, focusing on renewable energy and HVO biofuels.
We have to face the reality that the world needs to transition and the support that we can do to promote greener renewables sources of energy is what’s needed.
The legacy after the Games is that these communities are now connected to green energy and the renewable energy grid. So we need to be open to the fact that we do need to transition away from fossil fuels – but transition to green, stable renewable energy.
The post Q&A: How are the Winter Olympics cutting emissions and adapting to climate change? appeared first on Climate Home News.
Q&A: How are the Winter Olympics cutting emissions and adapting to climate change?
SYDNEY, FRIDAY 24 JULY 2026 — Greenpeace is calling on the Labor government to urgently address Queensland’s deforestation crisis using the new national nature law, after the Great Barrier Reef dodged another ‘in danger’ listing by UNESCO.
The decision to keep the world’s most famous reef off the ‘in danger’ list was adopted at the UNESCO World Heritage Committee meeting in South Korea today, despite grave concerns over the government’s unmet targets for water quality last year, a direct impact of deforestation in Queensland.
Adele Chasson, Nature Policy Lead at Greenpeace Australia Pacific, said:
“UNESCO has repeatedly voiced concern about the health and future of the Great Barrier Reef, and the reality is that this global icon is still in deep danger from runaway climate heating, coral-killing deforestation run-off, ocean acidification and coral bleaching.
“Deforestation in Great Barrier Reef catchment areas is an environmental crisis, making up almost half of all deforestation in Queensland. Deforestation run-off floods the reef with dirty sediment and toxic pesticides, poisoning corals and fuelling destructive crown-of-thorns starfish outbreaks. Labor must end rampant deforestation in Queensland or risk the Reef losing its World Heritage status, threatening the communities and wildlife who depend on it.”
The UNESCO committee recognised deforestation as a major threat to the Reef and welcomed Australia’s recent nature law reforms aimed at tackling deforestation in catchment areas. It urged Australia to act to improve the Reef’s water quality and requested a progress report by 2028.
“With these compounding pressures and a record El Niño around the corner, action to protect the Reef has never been more urgent. The Albanese government must immediately implement UNESCO’s recommendations under the new EPBC laws and end unchecked deforestation in the Reef catchments,” Chasson said.
-ENDS-
Great Barrier Reef still in hot water, nature law critical for reef’s future
ADELAIDE, Friday 24 JULY — Labor’s National Conference has today committed to support a global moratorium on deep sea mining just days before the International Seabed Authority (ISA) Assembly is due to meet in Kingston, Jamaica, on Monday.
The commitment, agreed under the platform’s third chapter which covers climate and environment, outlines that Labor will “ensure the Australian Government leads ambitious international efforts for global agreements on… a moratorium on deep sea mining in international waters.”
Dr. Susie Byers, Head of Advocacy at Greenpeace Australia Pacific, said from the Conference: “This commitment to support a moratorium on deep sea mining is the strongest from Labor yet and is very welcome. The eyes of the world are now on Australia ahead of the ISA’s Assembly meeting next week, where delegates will discuss the future of deep sea mining and protection of the sea floor.
“Deep sea mining is a destructive new industry that, if allowed to start, will risk irreversible damage to the ocean and communities worldwide who depend on it, with disproportionate impacts on Pacific nations, cultures and economies.
“Labor must not agree to strong action at the Conference today and then stay quiet in front of the world at the ISA come Monday. Australia must hold its nerve or risk letting down the many thousands of Australians who want to see this destructive industry stopped – not to mention our friends, including many of our Pacific family, who want to see the world’s precious deep seas protected from greed and destruction.
“This year, Labor moved to ratify the Global Ocean Treaty, the most significant ocean protection agreement in history. To be true leaders in ocean protection, Australia must now fortify their position with a moratorium on deep sea mining in international waters.”
More than 40 countries, including seven Pacific nations, have called for a moratorium or precautionary pause on deep sea mining.
The Government has not yet announced opposition to deep sea mining, despite it being revealed that former LNP prime minister Scott Morrison and the international weapons industry, with links to AUKUS, were behind a global push to start the practice.
— ENDS —
Labor must follow through on promise to stop deep sea mining
The UK’s new prime minister Andy Burnham remained tight-lipped on his views on climate change during his leadership campaign.
When asked his views on allowing new North Sea drilling in June – a move that the oil-and-gas industry and right-wing media have pushed for in recent months – he said he had “something of an open mind” on the issue.
But a trawl of Burnham’s past comments about climate change, net-zero and fossil fuels reveals a different picture.
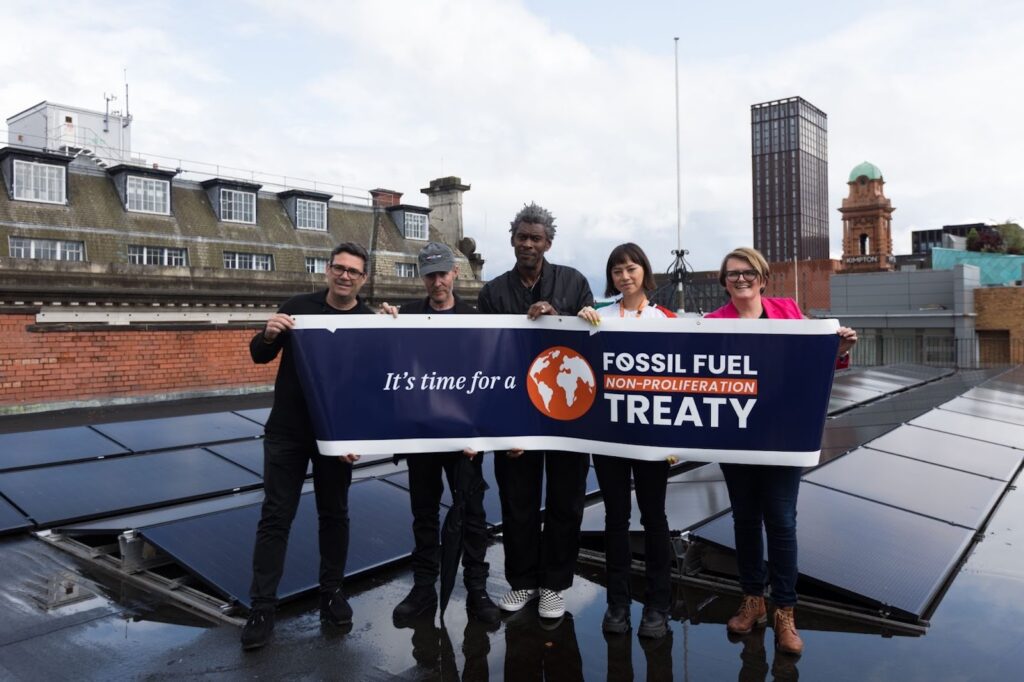
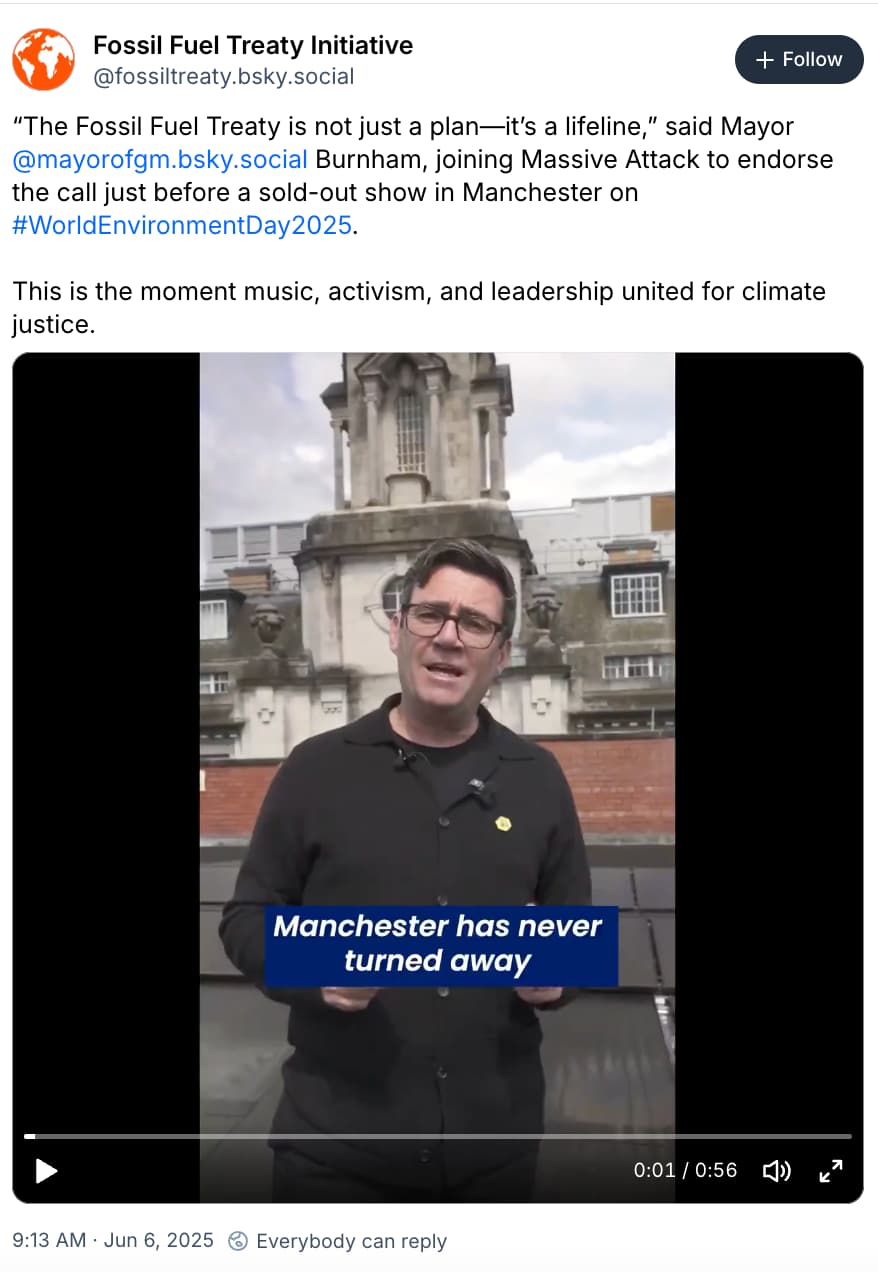
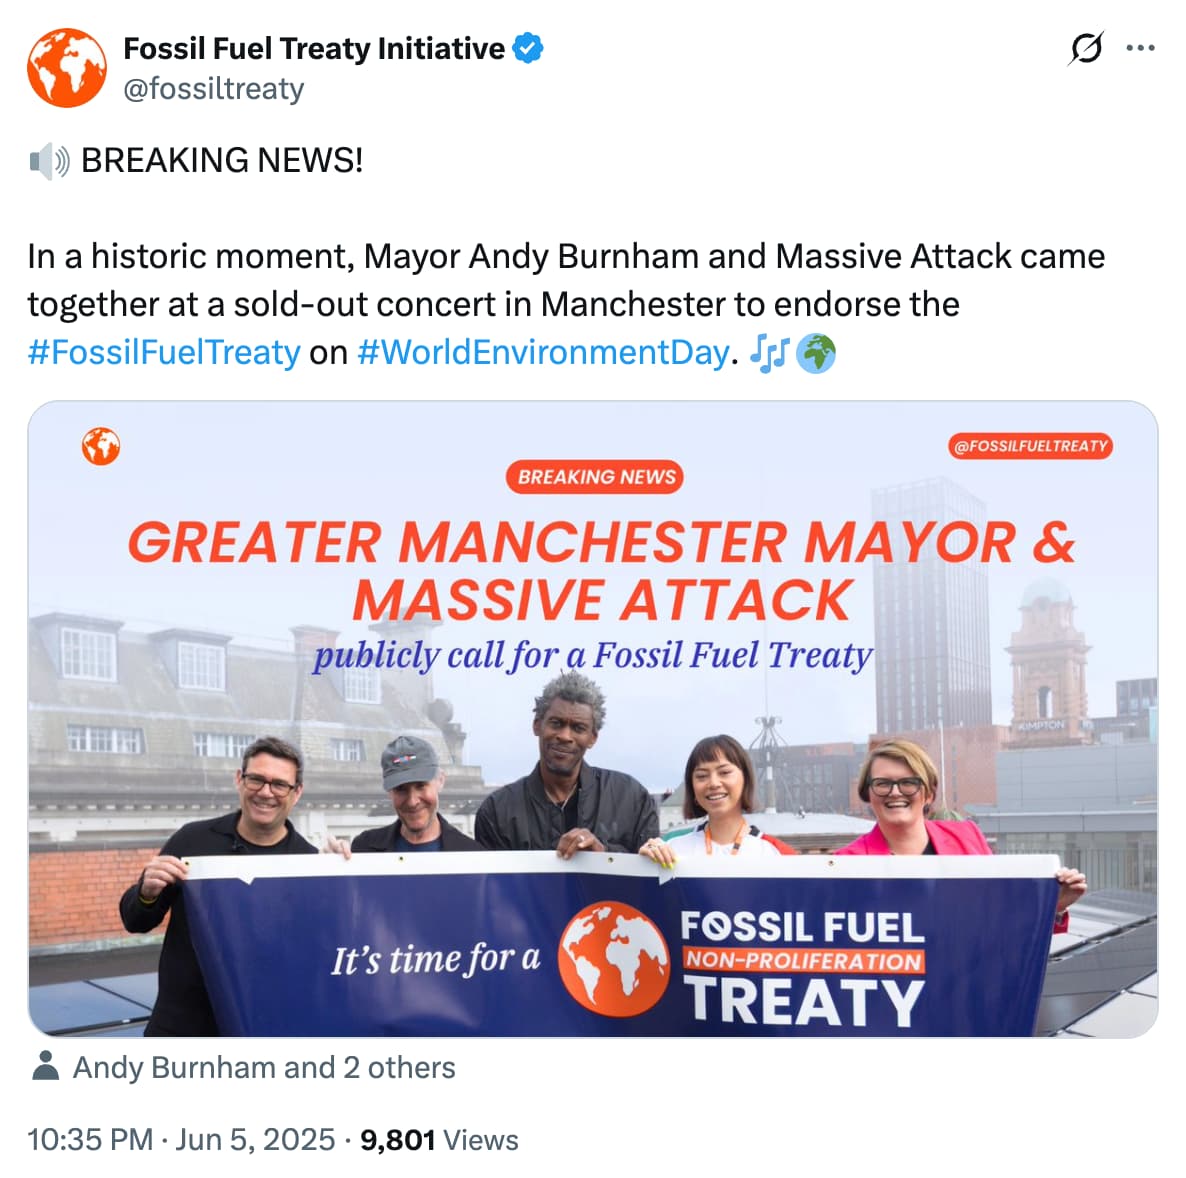
Just a year ago in June 2025, Burnham, while mayor of Greater Manchester, gave his support to the fossil fuel treaty – a proposed international pact on phasing out coal, oil and gas – calling it a “lifeline” that “all governments” should join.
In a video message endorsing the treaty, he also said that “there should be no turning away from net-zero”.
During his last bid to be Labour leader in 2015, he used similar language, saying:
“Labour under my leadership will never turn our back on either our duty to tackle climate change or the prospects offered by the green economy.”
Burnham has spoken about the threat of climate change since at least 2008, noting in 2021 that accelerated action could “create thousands of good jobs”, but also warning that net-zero risked becoming the “next Brexit”.
Burnham is yet to appoint his cabinet, but there is much speculation that he will select current net-zero secretary Ed Miliband as his chancellor – with their ally Miatta Fahnbulleh having a “strong chance” of taking Miliband’s former position.
Below, Carbon Brief recounts 28 things that Burnham has said about climate change, net-zero, fossil fuels, energy and transport.
Climate change
“Tackling climate change isn’t just about protecting the planet – it’s a powerful opportunity to build a fairer, greener future for our communities and businesses.”
Calling for local councils to be given more power and money for climate action, 29 November 2025
“There is little doubt that Greater Manchester’s biodiversity has taken a hit over the years, with habitats being lost, destroyed and becoming less diverse due to the impact of development, climate change, pollution and invasive species…We are committed to delivering a city-region for all residents to enjoy – a fairer, greener and more prosperous place for everyone.”
Statement after Greater Manchester declared a “biodiversity emergency”, 25 March 2022
“Over the next decade, if we accelerate our response to the climate crisis, we can create thousands of good jobs, improve homes, overhaul our transport system and make [Manchester] an even better place to live.”
Greater Manchester Green Summit, 18 October 2021
“The environment has never been higher on the national and international agenda.”
Statement after visiting a peat bog restoration project in England, 9 January 2020
“I think climate change [action] will be driven more quickly from the bottom up, if I’m honest. It’s the will of evolution if you wait for the government to act…When governments aren’t listening you get out and get your voice heard…so I think [climate protesters] deserve our encouragement, not our criticism.”
Speaking to Manchester Evening News at a student climate protest in Manchester, 24 May 2019
“Labour under my leadership will never turn our back on either our duty to tackle climate change or the prospects offered by the green economy.”
Labour leadership candidate speech, 15 July 2015
“Climate change can seem a distant, impersonal threat – in fact the associated costs to health are a very real and present danger…We need well-designed climate change policies that drive health benefits.”
Speaking to the Guardian about a study on climate and health, 25 November 2009
“The Stern report on the economics of climate change has changed the debate, in this country and around the world. It made it clear that the people who could suffer most from a failure to tackle climate change, or from a lack of ambition in our approach to it, are those living in the developing countries. They are the most vulnerable…[and] Stern said that the cost of not acting would be large. That is why the government took various measures in the recent spending review to ensure that we are prepared to face the challenges posed by climate change.”
Speaking in the UK parliament on the economic impacts of climate change on his final day as chief secretary to the Treasury, 24 January 2008
Net-zero
“There should be no turning away from net-zero.”
Speaking after giving his support to the fossil fuel treaty – a proposed global pact to introduce laws to phase out coal, oil and gas – on behalf of Manchester, 6 June 2025
“An opportunity is opening up for Britain as other countries move away from net-zero. We should seize that…We can make Britain a green leader. This is not the time to tiptoe, it is the time to commit to this path.”
Speaking at Innovation Zero World Congress in London, 29 April 2025
“[We] need a government that fully buys into the 2038 vision because the UK will not get to 2050 unless places like Greater Manchester are freed up to go faster – and we’re ready to go faster.”
Speaking about Greater Manchester’s aim to reach net-zero by 2038, 19 October 2022
“In Greater Manchester we have plans to build 30,000 net-zero social rented homes because we recognise that a successful city region needs good quality, affordable accommodation for everyone.”
Speech on the future of cities, 24 June 2022
“By building a broad consensus behind the drive to net-zero, we can ensure that the transition is a fair one that delivers social justice as well as climate justice. This is an opportunity for all of us to show how cutting carbon emissions in our cities can make a real difference to our communities – away from the abstractions and rooted in the real world.”
Panel discussion in Glasgow during the COP26 climate summit, 12 November 2021
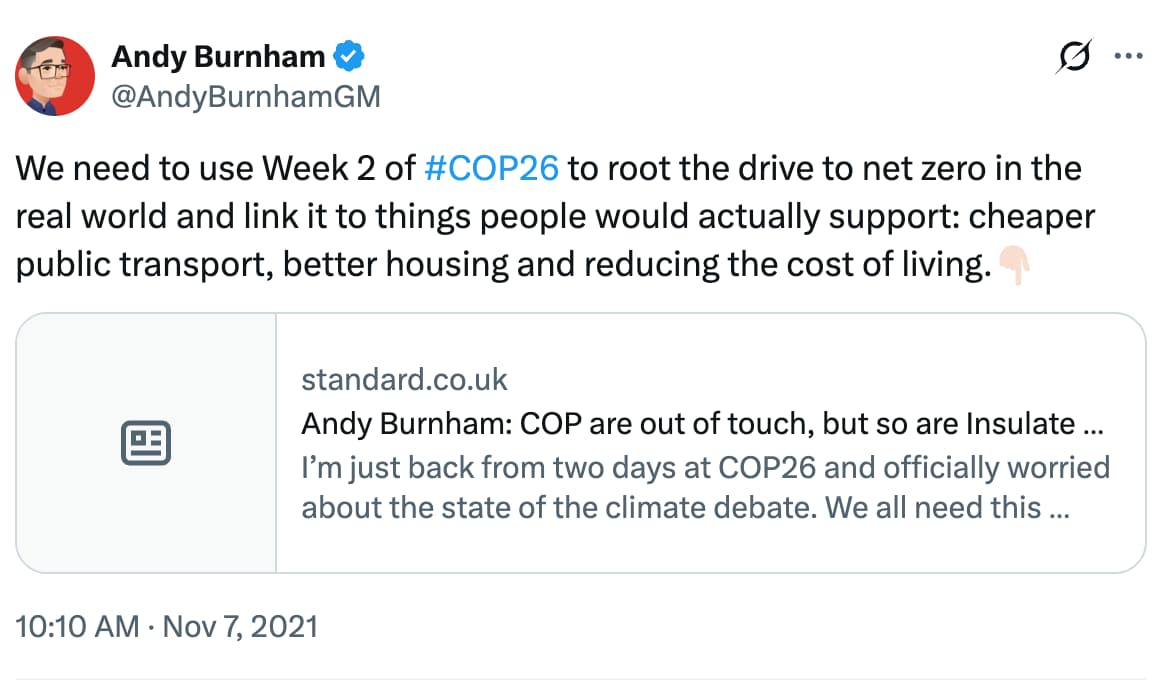
“To the extent that people have picked up anything from COP26, it’s a sense that the drive to net-zero will mean cost and inconvenience for ordinary people and offsetting for the wealthy and entitled. All of a sudden, you can feel how net-zero could become the new Brexit – a debate that gets very divided on class grounds…This has got to be a wake-up call. We cannot let this happen. We need to act now to build a broad social consensus behind the drive to net-zero. How to do that? It starts with taking control of the climate narrative from those steering it in the wrong direction and turning it around…We must show how, if done in the right way, the drive to net-zero is actually an opportunity to reduce the cost of living; to make people’s lives better and society fairer.”
Writing for the London Standard, 5 November 2021
“The drive to net-zero is a chance to re-industrialise the north of England, this time in a clean way. Create really good jobs, future-facing jobs for people, better public transport, improve people’s homes…If we go quickly towards net-zero, it’s the quickest way to level up the country.”
ITV interview at COP26, 1 November 2021
“If we really embrace the drive to net-zero, that is the route to level up the country…But it needs substantial investment, upfront, now, of the kind that Rachel Reeves, shadow chancellor [and chancellor under Keir Starmer’s government], has been talking about. We need long-term predictable funding.”
Interview with GB News at COP26, 1 November 2021
“I would have preferred to hear slightly less about carbonated wine and much more about a decarbonised economy.”
Referencing a UK budget, which included tax cuts for sparkling wine and other drinks, 28 October 2021
“Decarbonising is not just about lowering costs on to people. It’s the route to get better, cheaper public transport. It’s the route to getting homes that are cheap to run. It’s actually the way we can create thousands of good jobs for the people who live in Greater Manchester. This is the route to levelling up the country by going further and faster on decarbonisation.”
Speaking to Manchester Confidential, 20 October 2021
“[I am] asking people to stop seeing the environmental agenda as a cost and a burden agenda. I think this is a barrier that we’ve got to get over. Already in the media interviews I’ve done today, people are saying ‘can you afford it?’, ‘can it be achievable when times are tough?’.
“My answer to that is, at some point in the 21st century, all homes will be zero-carbon. At some point in this century, all buildings of any kind will be zero-carbon…All cars will be zero-carbon, all public transport will be zero-carbon…The question is: when? And surely the places that embrace those things first are putting themselves in a position of economic strength when it comes to facing up to the future. Rather than seeing the whole agenda as a burden, we’ve got to see it for the benefits that it can bring.
“There may be a greater upfront cost in a zero-carbon home, but let’s stop thinking, as we tend to do in Britain, of the short-term, the short-termist approach to life. Surely let’s start talking to the public about the lifetime cost.”
Greater Manchester Green Summit, 21 March 2018
Fossil fuels
“I’ve got something of an open mind, you know. I don’t have a sort of fixed position.”
Speaking on the issue of new North Sea oil and gas in a New Statesman interview, 3 June 2026
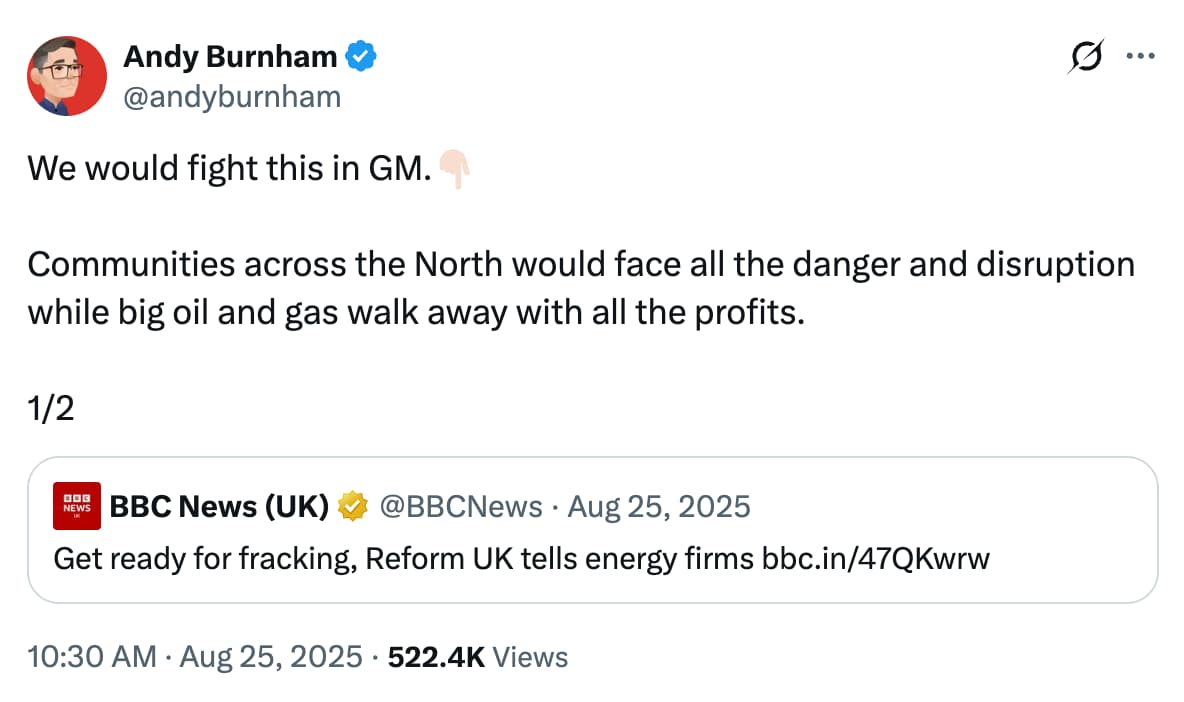
“We would fight this in GM [Greater Manchester]…Communities across the north would face all the danger and disruption while big oil and gas walk away with all the profits.”
In response to Reform’s call for fracking, on X, 25 August 2025
“I am proud to endorse the fossil-fuel treaty proposal today on behalf of Greater Manchester. It’s not just a plan – it’s a lifeline. It’s a call to end coal, oil and gas, hold polluters accountable…I urge all governments, nationals and subnationals to join this fight.”
Statement upon endorsing the fossil-fuel treaty, 5 June 2025
“Fracking is the past, it is not the future.”
Speech at London climate protest, 20 September 2019
“I have called for a moratorium on fracking. Far too many potential risks and unanswered questions.”
On X, 22 June 2015
Energy and transport
“What I would do, if successful, is lay out a plan for more public control over water, energy, transport, so that over the period we can get those bills down, fares down, and give people and give businesses breathing space.”
LBC interview, 2 July 2026
“I am all in favour of tough decisions at a national level. I don’t believe there should be a third runway at Heathrow, for instance. But I think those are decisions for national government.”
Guardian interview, 13 June 2019
“There is a debate to be had about aviation, isn’t there? There are changing public attitudes about aviation. Rather than just saying no to people flying, don’t we need to accelerate research into low and zero-carbon forms of aviation?”
Guardian interview, 13 June 2019
“Today, I stand alongside the mayors of some of the greatest cities in the world. I’m committed to a cleaner, greener and healthier future for Greater Manchester. Around a third of greenhouse gas emissions in our city-region come from transport.”
When signing the C40 Fossil-Fuel-Free Streets Declaration, which includes support for zero-emissions vehicles and walking and cycling, on behalf of Manchester, 14 September 2018
This article was updated on 20 July to reflect Burnham replacing Keir Starmer as UK prime minister.
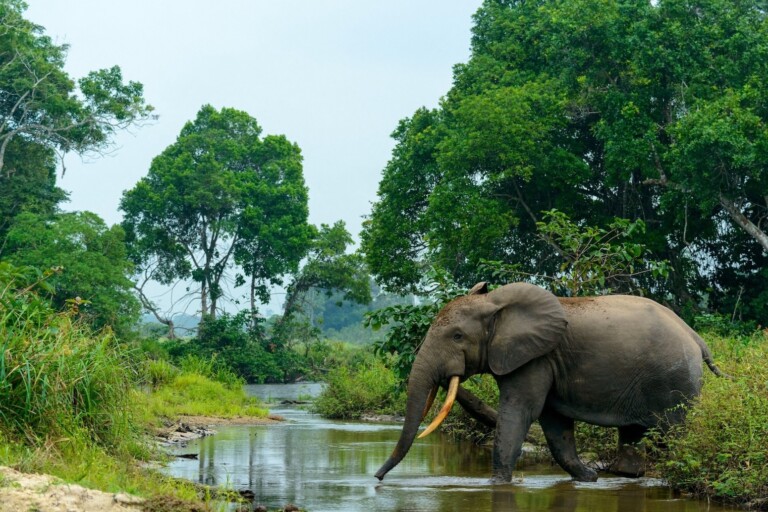
UK withdraws millions in funding from world’s second-largest rainforest in Congo
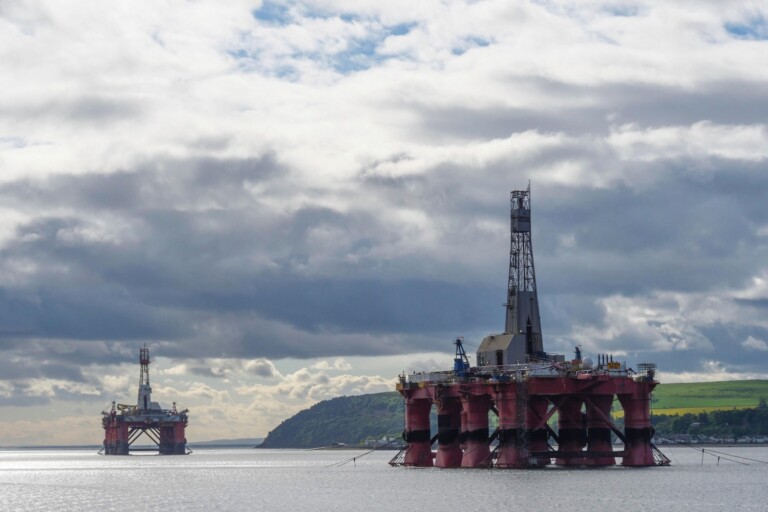
Analysis: UK newspapers have already printed 63 editorials in 2026 backing North Sea drilling
Livestock heat deaths in transit doubled in UK record-hot summer of 2025
Analysis: UK sales of electric vehicles just overtook petrol cars for the first time
The post 28 quotes from new UK leader Andy Burnham on climate, net-zero and fossil fuels appeared first on Carbon Brief.
28 quotes from new UK leader Andy Burnham on climate, net-zero and fossil fuels


-
Greenhouse Gases12 months ago
Guest post: Why China is still building new coal – and when it might stop
-
Climate Change12 months ago
Guest post: Why China is still building new coal – and when it might stop
-

 Greenhouse Gases2 years ago
嘉宾来稿:满足中国增长的用电需求 光伏加储能“比新建煤电更实惠”
-

 Climate Change2 years ago
嘉宾来稿:满足中国增长的用电需求 光伏加储能“比新建煤电更实惠”
-
Climate Change2 years ago
Bill Discounting Climate Change in Florida’s Energy Policy Awaits DeSantis’ Approval
-

 Renewable Energy9 months ago
Sending Progressive Philanthropist George Soros to Prison?
-

 Carbon Footprint2 years ago
US SEC’s Climate Disclosure Rules Spur Renewed Interest in Carbon Credits
-
Greenhouse Gases1 year ago
嘉宾来稿:探究火山喷发如何影响气候预测