

Scientists have long known that fires release substantial amounts of greenhouse gases and pollutants into the atmosphere.
However, estimating the total climate impact of fires is challenging.
Now, new satellite data has shed fresh light on the complex interplay between the climate and fires in different landscapes around the world.
It suggests that global emissions from fires are much higher than previously assumed.
In this article, we unpack the latest update to the Global Fire Emissions Database (GFED) – a resource that combines satellite information on fire activity and vegetation to estimate how fires impact the land and atmosphere.
The latest update to the database – explored in new research published in journal Scientific Data – includes data up to and including the year 2024.
It reveals that, once the data from smaller fires is included, fire emissions sit at roughly 3.4bn tonnes of carbon (GtC) annually – significantly higher than previous estimates.
It also shows that carbon emissions from fires have remained stable over the past two to three decades, as rising emissions from forest fires have been offset by a decline in grassland fire emissions.
The database update also illustrates how the amount of area burned around the world each year is falling as expanding agriculture has created a fragmented landscape and new restrictions on crop residue burning have come into force.
Landscape fires
Fire events vary widely in cause, size and intensity. They take place across the globe in many types of landscapes – deserts and ice sheets are the only biomes that are immune to fire.
When vegetation burns, it releases greenhouse gas emissions, which contribute to global warming. It also releases pollutants that cause local air pollution and, on a global scale, have a cooling effect on the climate.
Forest fires often generate considerable media attention, especially when they threaten places where people live.
However, the forest fires that make the news represent just a small fraction of all fires globally.
More than 95% of the world’s burned area occurs in landscapes with few trees, such as savannahs and grasslands.
Fires have helped maintain tropical savannah ecosystems for millions of years. Savannahs have the perfect conditions for fire: a wet season which allows grasses and other “fuels” to grow, followed by an extended dry season where these fuels become flammable.
Historically, these fires were ignited by lightning. Today, they are mostly caused – intentionally or accidentally – by humans.
And yet, despite their prevalence, these fires receive relatively little media attention. This is not surprising, as they have been part of the landscape for so long and rarely threaten humans, except for their impact on air quality.
Fires also occur in croplands. For example, farmers may use fire to clear agricultural residues after harvest, or during deforestation to clear land for cultivation.
The term “landscape fires” is increasingly used to describe all fires that burn on land – both planned and unplanned.
(The term “wildfire”, on the other hand, covers a subset of landscape fires which are unplanned and typically burn in underdeveloped and underinhabited land.)
Calculating the carbon emissions of landscape fires is important to better understand their impact on local air quality and the global climate.
New data
In principle, calculating carbon emissions from fires is straightforward. The amount of vegetation consumed by fire – or “fuel consumption” – in one representative “unit” of burned area has to be multiplied by the total area burned.
Fuel consumption can be determined through field measurements and satellite analysis.
For example, the burned area of a relatively small fire can be measured by walking around the perimeter with a GPS device. Fuel consumption, meanwhile, can be derived by measuring the difference in amount of vegetation before and after a fire, something that is usually only feasible with planned fires.
In practice, however, fires are unpredictable and highly variable, making accurate measurement difficult.
To track where and when fires occur, researchers rely on satellite observations.
For two decades, NASA’s MODIS satellite sensors have provided a continuous, global record of fire activity. To avoid too many false alarms, the algorithms these satellites use are built in a way so fires are flagged only when they burn an entire 500-metre grid cell.
However, this approach misses many smaller fires – resulting in conservative estimates of total burned area.
The latest update to the GFED includes, for the first time, finer-resolution satellite data, including from the European Space Agency’s “sentinel missions”.
This data shows that fires too small to be picked up by a satellite with a 500-metre spatial resolution are extremely common. So common, in fact, that they nearly double previous estimates of global burned area.
The data shows that, on average, 800 hectares of land – an area roughly the size of Australia – has burned annually over the past two decades.
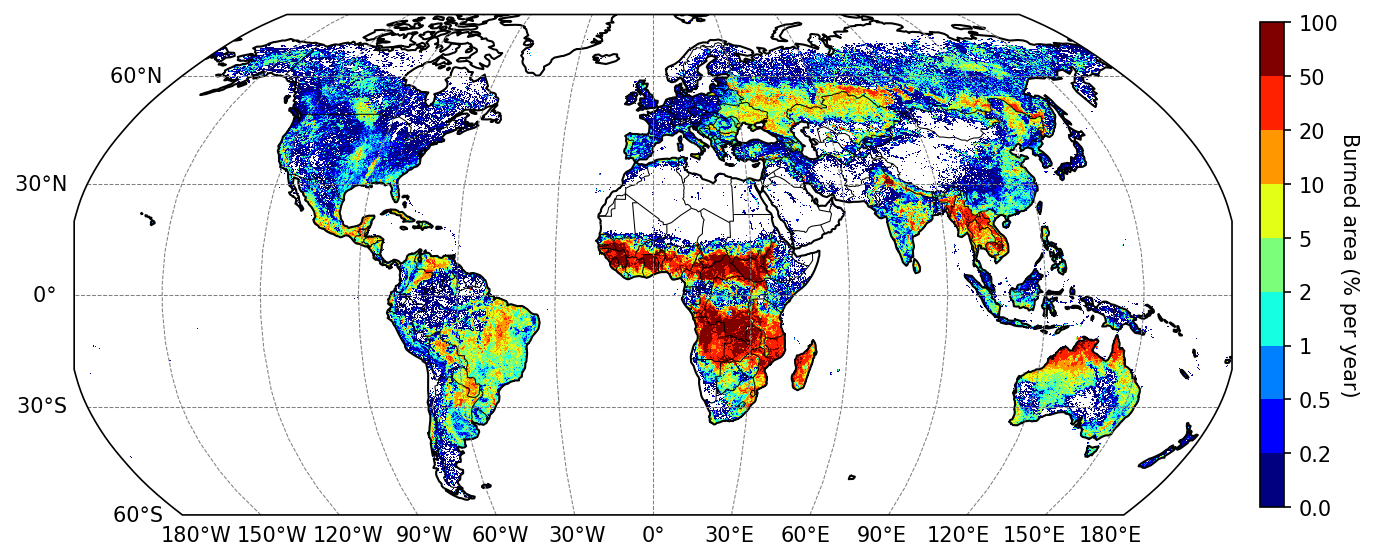
The map below shows the frequency of fires around the world. Regions shaded in dark red burn, on average, 50-100% each year. In other words, fires occur annually or biannually. Regions in dark blue, on the other hand, are those where fires occur, but are very infrequent. Most regions fall in between these extremes.
The map shows that the areas most prone to fire are largely found in the world’s savannah and agricultural regions.
Falling burned area
Over recent decades, the total burned area globally each year has been declining.
This is largely due to land-use change in regions which used to have frequent fires.
For example, savannah is being converted to croplands in Africa. This transforms a frequently burning land-use type to one that does not burn – and creates a more fragmented landscape with new firebreaks which limit the spread of fire.
The decline in burned area is also due to the introduction of more stringent air quality regulations limiting crop residue burning in much of the world, including the European Union.
The amount of “fuel” – or biomass – in a unit area of land varies greatly. Arid grasslands are biomass-poor and, therefore, produce less carbon emissions when burned, whereas fuel consumption in tropical forests with peat soils is extremely high.
Maps of carbon emissions from fires closely resemble maps of burned area. However, they typically highlight biomass-rich areas, such as dense forests.
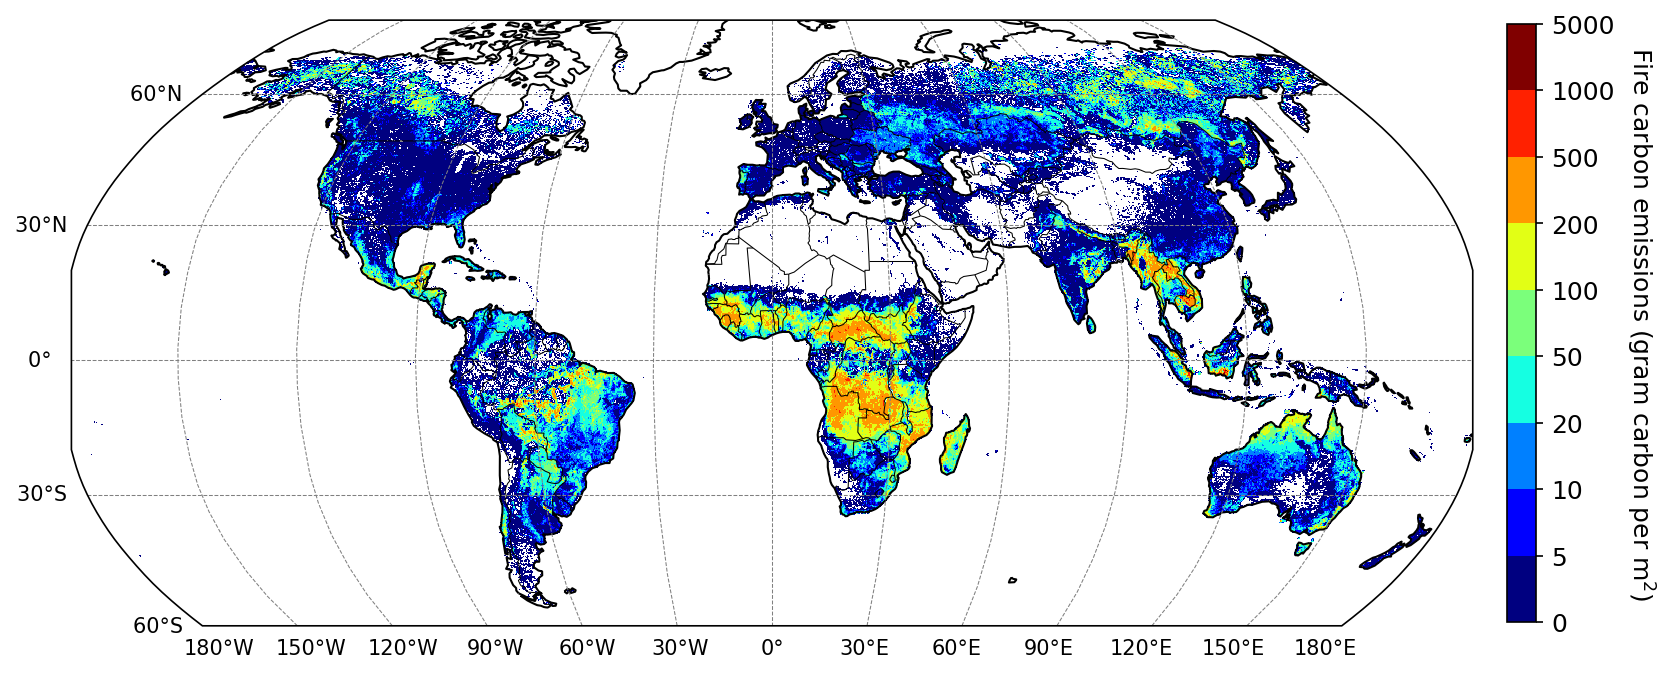
This is illustrated in the map below, which shows how fires in regions coloured dark red on the map produce, on average, 1,000-5,000 grams of carbon per square metre. In these places, much more carbon is lost during fires than gained through photosynthesis.
Meanwhile, much of the world’s savannah regions are coloured in yellow and orange on the map, indicating that fires here produce between 100-500 grams of carbon per square metre.
Rising forest fire carbon emissions
The boost in fire emissions captured by the latest version of the GFED is most pronounced in open landscapes, including savannahs, grasslands and shrublands.
Forest fire emissions, on the other hand, have barely changed in the updated version of the database. This is because most forest fires are relatively large and were already well captured by the coarse resolution satellite data used previously.
However, the trend in forest fire emissions is sloping upwards over the study period.
Overall, current estimates – which take into account the new data from smaller fires – suggest that, over 2002-22, global fire emissions averaged 3.4GtC per year.
This is roughly 65% higher than estimates set out in the previous update to the GFED, which was published in 2017.
For comparison, today’s fossil fuel emissions are around 10GtC per year.
Comparisons between fire and fossil fuel carbon emissions are somewhat flawed, as much of the carbon released by fires is eventually reabsorbed when vegetation regrows.
However, this is not the case for fires linked to deforestation or the burning of tropical peatlands, where regrowth is either much slower – or non-existent, if forests are converted to agriculture. These fires account for roughly 0.4GtC each year – just less than 12% of total fire emissions – and contribute directly to the long-term rise in atmospheric carbon dioxide (CO2).
The traditional view of forest fires as “carbon-neutral” is increasingly uncertain as the climate changes due to human activity. Longer fire seasons, drier vegetation and more lightning-induced ignitions are increasing fire frequency in many forested regions.
This is most apparent in the rapidly-warming boreal forests of the far-northern latitudes. The year 2023 saw the highest emissions ever recorded by satellites in boreal forests, breaking a record set just two years before.
Moreover, the fires in boreal forests are becoming more intense – meaning they burn hotter and consume a larger fraction of vegetation. This, in turn, jeopardises the recovery of forests.
In cold areas, fires also cause permafrost to break down faster. This happens because fires remove an organic soil layer that has an insulating effect which prevents permafrost thaw.
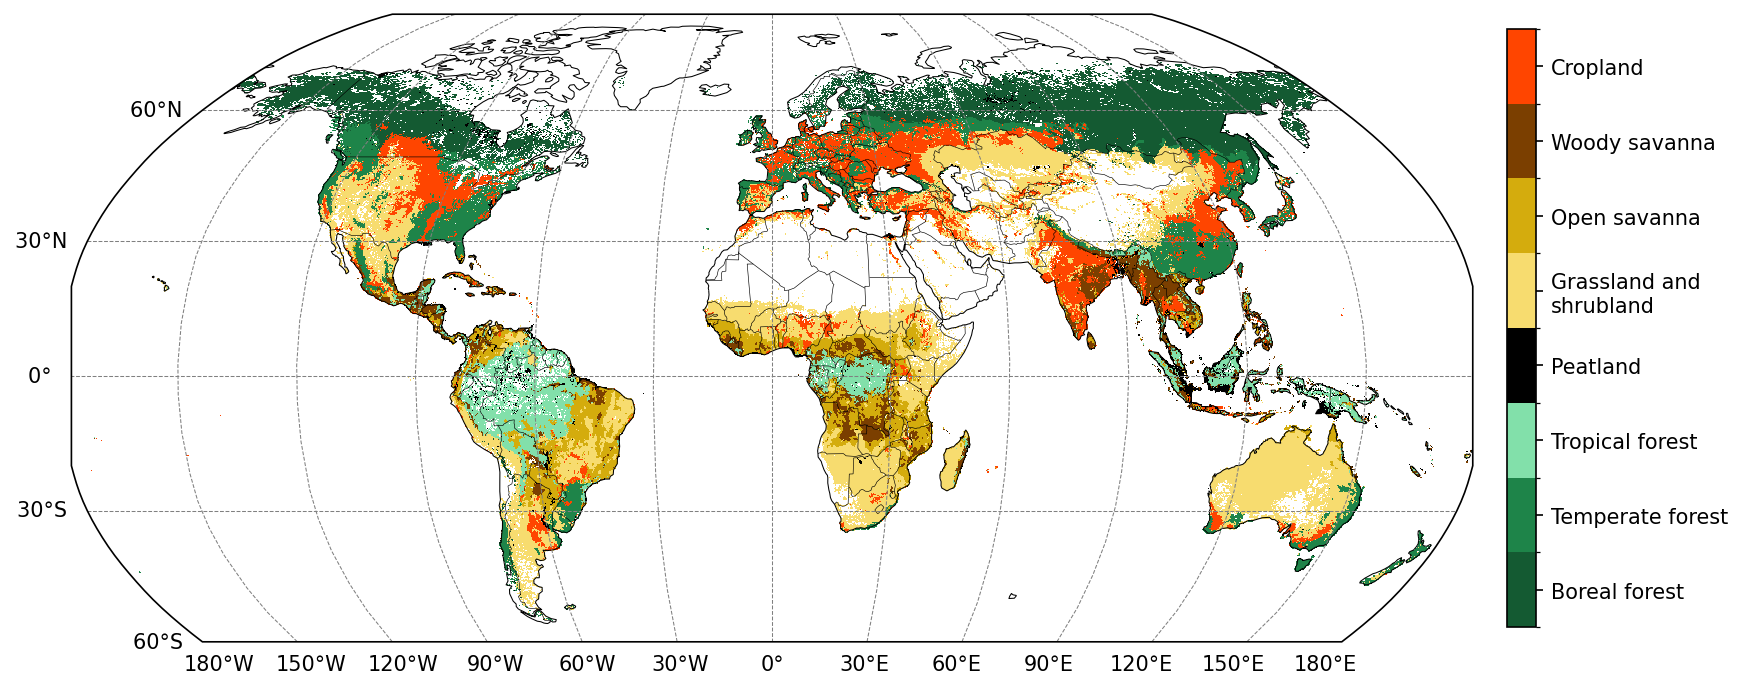
The map below shows the dominant fire type in different regions of the world, including boreal forest fires (dark green), cropland fires (red), open savannah (darker yellow) and woody savannah (brown).
Changing ‘pyrogeography’
Thanks to more precise satellite data we now know that fire emissions are higher than we thought previously, with the new version of GFED having 65% higher overall fire emissions than its predecessor.
However, all evidence suggests that emissions from fires have been stable over the past two to three decades. This is because an increase in forest fire emissions is being offset by a decline in grassland fire emissions.
The world’s changing “pyrogeography” is illustrated in the bar chart below, which breaks down annual fire emissions across different types of biome.
It shows how low-intensity grassland fires with modest fuel consumption – represented in yellow and brown – have declined over time, while high-intensity forest fires – illustrated in green colours – are becoming more prominent, albeit with substantial variability in emissions year-on-year.



The post Guest post: Why carbon emissions from fires are significantly higher than thought appeared first on Carbon Brief.
Guest post: Why carbon emissions from fires are significantly higher than thought

After witnessing and hearing stories of Pacific islands’ vulnerability to climate change, senior climate officials have promised to strengthen efforts to limit global warming to 1.5C, despite an expected overshoot, and to help the region adapt to rising seas and other impacts.
More than 30 world leaders, ministers, climate negotiators and international development bankers travelled to the sinking atoll nation of Tuvalu on Tuesday before attending the pre-COP31 talks in Fiji, where schoolchildren told them about the effects warming-driven droughts, heatwaves and storms are having on their education.
Australia and the Pacific nations hoped to use the pre-COP to reinforce the urgency of tackling climate change to the officials from around 50 countries who travelled to the region. Fiji’s climate minister, Lynda Tabuya, told a closing press conference on Thursday they had wanted to “bring decision-makers to the climate frontlines”.
Many of those decision-makers said they had been moved by what they had seen and heard this week, and their speeches emphasised the importance of limiting global warming to 1.5C above pre-industrial levels, a key goal of the 2015 Paris climate agreement.
-
Pacific leaders rail at climate finance failures after pre-COP trip to Tuvalu
Island nations seek invest in their own Pacific Resilience Facility, as they struggle with the red-tape of international climate funds -
New Zealand accused of breaching EU trade deal over climate rollbacks
The EU’s climate trade rules face their first major test after a green group alleged New Zealand violated binding environmental provisions under its trade deal with the bloc

In September, a UN report acknowledged that the 1.5C threshold will be breached but said temperatures could still be brought back down to that level by the end of the century with stepped-up climate action.
A month ago, Türkiye‘s COP31 President Murat Kurum told a press conference in the northern Turkish city of Trabzon that limiting global warming to 1.5C “does not really look possible”, adding that “around 1.5C, that will be a success”.
But after seeing the “anxiety” of children and mothers in Tuvalu caused by rising sea levels, Kurum told reporters in Fiji that 1.5C is a “matter of survival – the survival of cultures, history, memories, your homeland, your homes – it’s that important.”
“The 1.5C target is in jeopardy and we do not have a single minute, a single day to lose,” he added through an interpreter.
Jacobo Ocharan, head of political strategies at Climate Action Network International, warned that “words of concern will not protect anyone”. “The Pacific has shown the world what is at stake. Now governments must show they are ready to act,” he said. “[COP31 in] Antalya must deliver decisions that change people’s lives for the better.”
$1.5 billion for 1.5C
In Fiji, Kurum echoed the call of Australia and Pacific nations for contributions to the fledgling Pacific Resilience Facility (PRF), which aims to use the returns on its investments to fund community climate adaptation projects like water storage, building sea walls and protecting homes from storms. “$1.5 billion for 1.5 degrees will save the Pacific,” he said. “It’s that easy. Life will continue in Tuvalu. Children will be smiling again.”
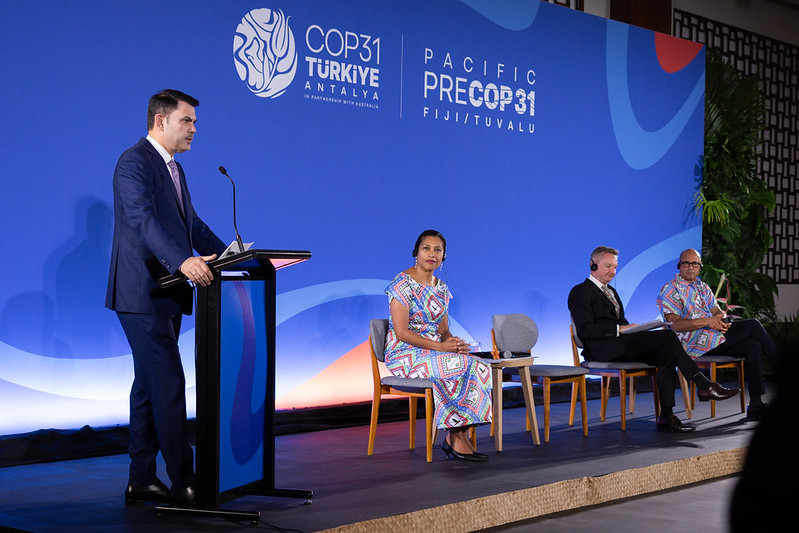
Sitting next to him, Fiji’s Tabuya said she was “encouraged” by his words. “$1.5 billion for 1.5. We will hold COP 31 to that,” she said. The PRF has been promised just under $200 million so far – including about $15 million pledged by European and Pacific governments at pre-COP – and is aiming for $500 million by COP31. It has a longer-term target of mobilising $1.5 billion in capital.
After Pacific leaders on Tuesday aired a litany of concerns about the barriers to accessing the global climate finance system, Kurum joined in at Thursday’s press conference. “Justice in climate finance is essential,” he said. “Resources must reach those in need in a timely and accessible manner, not through a lot of red-tape, and we cannot accept that the same countries should always bear the burden.”
Plan for easier access to climate finance
Australian climate and energy minister Chris Bowen, who is COP31’s president of negotiations, also lamented that “the countries that need the finance the most get it the least”. He said he would ask governments and multilateral development banks to support an access to finance plan for small island states and the world’s poorest nations, launched by Australia on Thursday.
The plan says that while there has been progress in making it easier and quicker to obtain international climate funding, “multiple persistent challenges have continued to limit access to climate finance for developing countries”.
It adds that the amounts available are insufficient to meet climate goals and stresses the need for “grant-based and highly concessional financing”, especially for adaptation and responding to loss and damage. The plan proposes an annual high-level forum on climate finance access to track implementation.
The pre-COP summit closed with an emotional plea from Fiji’s host minister Tabuya. Fighting back tears before finally succumbing, she asked delegates to “carry something of the Pacific with you”.
“Remember the people you met, the stories you heard and why we gathered. This pre-COP draws to a close tonight. Our responsibility does not,” she said to applause.
The post Pre-COP draws attention to Pacific’s climate plight and 1.5C goal appeared first on Climate Home News.
Pre-COP draws attention to Pacific’s climate plight and 1.5C goal
Climate Change
Australia’s climate credibility tested at Pacific Pre-COP talks, as High Court fossil fuel ruling puts government on notice
NADI, FIJI Thursday 8 October 2026 — As the Pacific Pre-COP talks wrap up and Australia prepares to take the reins of COP31 Negotiations in Türkiye next month, Greenpeace Australia Pacific says the government is on notice over fossil fuel expansion and exports, and must accelerate action to align with a 1.5°C pathway.
Following yesterday’s landmark High Court ruling that the climate impacts of coal and gas exports must be considered by New South Wales planning authorities, Greenpeace Australia Pacific is calling on the Albanese government to find the “courage, leadership and grit” to chart a new course away from fossil fuels.
High res images and video from yesterday’s ‘Keep 1.5C Alive’ flotilla in Nadi can be found here
Speaking from Nadi, Shiva Gounden, Head of Pacific at Greenpeace Australia Pacific, said:
“The outcomes of this week’s talks are a drop in the ocean given the scale of need, and urgency of the crisis our communities are facing. It is like taking a glass of water to a burning house if we do not urgently act to address the root cause of the existential threat facing Tuvalu, Fiji and all Pacific countries: fossil fuel expansion.
“The Electrification Pledge must end fossil fuel dependence, not be an end in itself — its ultimate success depends on ensuring electricity comes from renewable sources that displace fossil fuels and align with a 1.5°C pathway. It must be underpinned by justice and backed by finance flowing from polluters to communities.
“Limiting global warming to 1.5°C is a non-negotiable survival line for humanity and Australia must act. The landmark climate advisory ruling from the ICJ is clear — 1.5°C is the moral, the scientific and the legal limit. Continuing down the fossil fuel path, and failing to align efforts with limiting warming to 1.5°C, is a breach of our international legal obligations, and risks making Australia liable for future reparations from climate-vulnerable nations.”
Also in Nadi, Dr Simon Bradshaw, COP31 Lead and climate expert at Greenpeace Australia Pacific, said: “The Pacific was never going to be a mere backdrop for Australia in its role as incoming chair of the COP31 climate talks, but where its credibility and commitment to climate leadership would be tested.
“Here we see communities fighting for their survival and doing everything possible to hold the line on returning warming to 1.5°C. When governments profess to take their concerns seriously, only to then throw more fuel on the fire, the pain and sadness is visceral.
“This week the High Court of Australia recognised what the Federal Government refuses to — that Australia is responsible for the climate damage of our fossil fuel exports and if governments don’t act, the courts will intervene. The message is simple: this is not someone else’s problem, it is ours.
“We must now follow other countries in developing a national roadmap away from fossil fuels that ensures a managed wind-down of fossil fuel production, including exports, in line with our legal obligation to help return warming to 1.5°C.”
ENDS
Media contact: Kate O’Callaghan in Nadi on +61 406 231 892 (Whatsapp/Signal)
A Dutch NGO has filed the first climate complaint under the European Union’s trade rules, arguing that New Zealand violated the environmental provisions of its free trade agreement with the bloc by weakening its climate regulations.
The case will test whether binding climate provisions in the EU’s free trade deals can be enforced to hold governments accountable to their climate obligations, experts told Climate Home News.
The EU-New Zealand free trade agreement, which came into force in 2024, was the first in the world to include legally-binding climate provisions and possible sanctions for violating them, as the EU seeks to use its trade partnerships to advance greater environmental protection.
Under the deal, both parties committed not to weaken their environmental law to promote trade or investment and to “refrain from any action or omission that materially defeats the object and purpose of the Paris Agreement”.