
Recent years have seen a rapid succession of climate-related records broken.
To name just a few, the world has witnessed record warmth in the Atlantic, unprecedented glacier melt, all-time low Antarctic sea ice extent, the Amazon’s worst drought since observations began and UK temperatures soaring past 40C for the first time.
In a review article, published in Nature Reviews Earth & Environment, my coauthors and I look at how the frequency of weather records is changing as the planet warms.
We find that the number of hot temperature records observed around the world since 1950 far exceed what would be expected in a million years in a world without human-caused climate change.
Specifically, we show that “all-time” daily hot records on land were more than four times higher in 2016-24 than they would have been in a world without climate change.
Meanwhile, daily maximum rainfall records were up 40% over the same time period and record cold events were twice as rare.
A key finding of our research is that it is the pace of global warming that controls the occurrence of records.
We show that, if the pace of warming were to slow down, the frequency of record-breaking hot events would start to decline – even if global temperatures continue to rise.
Counting records
By definition, records are supposed to be rare events, at least in a system that is not changing.
Statistics of record occurrence are remarkably simple. They are expected to become rarer the longer a measurement series gets.
The chance of observing a new record after 20 years of measurement is one in 20, or 5%. And after 100 years of observations, the chances of a new record drops to 1%.
For example, this is why it becomes increasingly difficult to break records in athletics as time goes by, unless training methods or sports equipment improve.
Record-breaking weather events – for example, the highest windspeed, most intense rainfall or hot and cold temperatures – also face these odds in a climate that is “stationary”.
However, today’s climate is not stationary, but warming at a very high pace. This has significant implications for the record count.
The plot below shows how the frequency of all-time hot records (dashed red line) and record cold events (dashed blue line) has changed since the 1960s. This is compared to the probability that would be expected under a stationary climate (black line).
(The plot uses ERA5, a reanalysis dataset, which combines observations and models from the European Centre for Medium-Range Weather Forecasts (ECMWF).)
It illustrates how the frequency of hot events declined more slowly than would be expected in a stationary climate since 1950, before increasing in the last 15 years. Meanwhile, the frequency of record cold events is declining more quickly than expected.

The record ratio
Tracking the ratio between the measured number of records and the one theoretically expected in a stationary climate – the “record ratio” – reveals the fingerprint of climate change.
Analysis of ERA5 data and Berkeley Earth surface temperature observations finds that the record ratio over the last decade for hot records over global land regions is more than four. For cold records, it is between 0.2 and 0.5, showing that record-breaking cold has declined
In other words, there were more than four times as many hot record events and less than half as many cold record events than would be expected without global warming.
In 2023 and 2024, the record ratio for hot events reached 5.5 and 6.2, respectively.
Record ratios tend to be higher over global oceans than on land. They are also higher for monthly or seasonal record temperatures than all-time daily records.
This is because natural variability in the climate tends to be smaller over oceans and for longer averaging periods, such as months and seasons.
Record counts directly relate to the relationship between rates of warming and natural fluctuations in the climate. This is sometimes referred to as the “signal-to-noise ratio”. (The “signal” being the long-term trend of climate change and “noise” referring to short-term fluctuations of natural variability.)
As a result, event types and regions with a higher signal-to-noise ratio tend to see a greater number of records.
Another way of illustrating the signal of climate change is by counting the total number of records in a measurement series.
In a stationary climate, there should be about five records in 100 years of temperature measurements, 7.5 in 1,000 years and less than 10 in 10,000 years.
However, our analysis of records in two measurement series shows how the number of record-breaking events has become significantly higher as the climate has changed.
For example, as the figure on the left below illustrates, a new annual record for average global temperature has been set 25 times over the past 175 years.
Meanwhile, the figure on the right shows how, in the Pacific north-west, a new five-day average heat record has been set 14 times within the last 75 years. The spike in temperature in 2021 reflects the brutal heatwave that killed hundreds of people and brought devastating wildfires that almost entirely destroyed the Canadian village of Lytton.
(In both figures, the warm records are marked by pink circles.)
According to fundamental laws of statistics, 14 new records would not be expected in more than a million years in a climate that is not warming.

It is worth noting that some climate variables, including ocean heat content, sea level rise and minimum glacier or ice sheet volumes, are changing so relentlessly that new record levels are currently set every year.
Record-shattering events
Record-shattering events are a subset of record-breaking events whose magnitude exceeds the previous event by a large margin.
In our research, we define this as more than one standard deviation, which is a measure of how spread out data is from the average.
(The exact value of standard deviation varies for different parts of the world. For example, when it comes to year-to-year average temperatures, one standard deviation is typically 2-3C in the Arctic, but less than 0.5C over the ocean).
These events of unprecedented intensity are often very impactful as they strongly exceed the conditions that society or ecosystems have experienced in the past.
The 2021 heatwave in the Pacific north-west, mentioned above, is a forbidding example.
Our research finds that the large number of record-shattering events in the past three decades is the consequence of a very high warming rate.
Using a simple timeseries model, we illustrate why the pace of warming is the key factor explaining the occurrence of record-shattering events.
In the left-hand figure, we assume a 150-year period of no warming followed by some linear warming at three different rates, which is a very simplistic approximation of historical and future warming pathways.
The right-hand figure illustrates what happens to the probability of record-shattering events in the Pacific north-west region under these three simplified pathways. It shows that the probability of record-shattering events at first rapidly increases and then stabilises. And the level at which the probability stabilises is greater the higher the rate of warming.
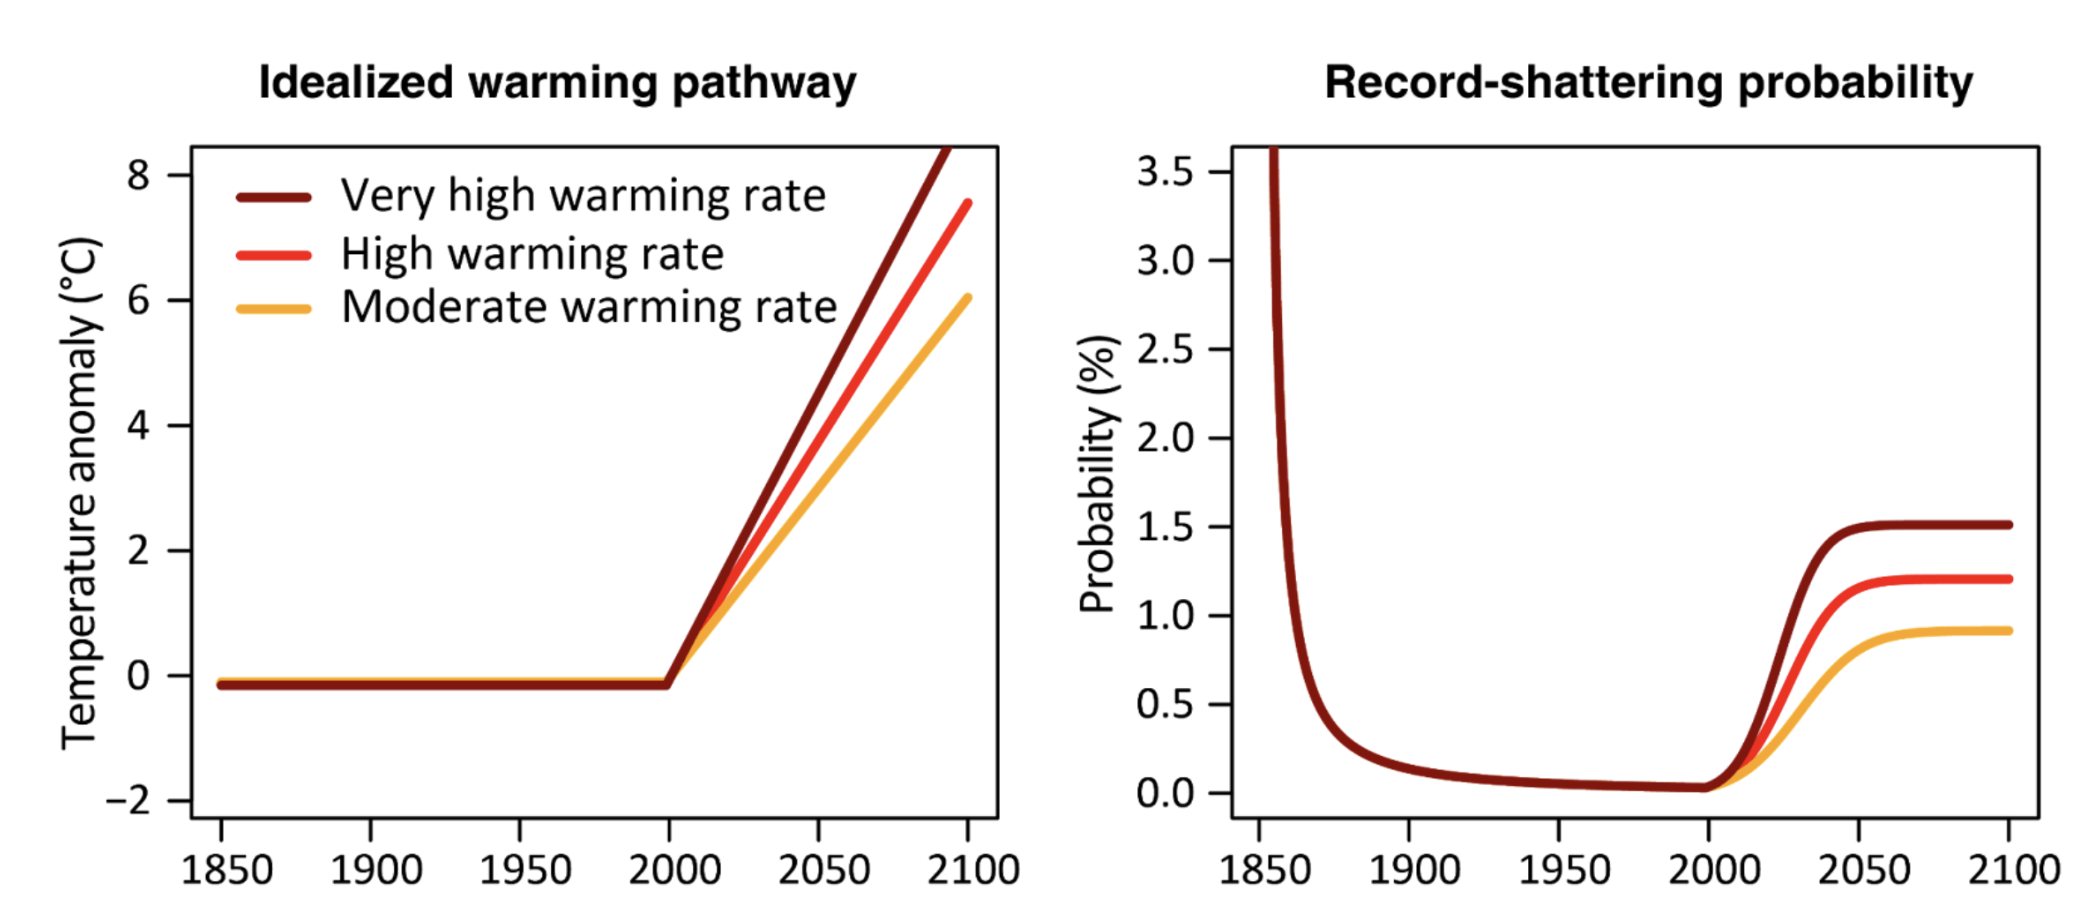
We therefore conclude that the high frequency of record-shattering hot extremes in recent years is controlled by the very high rate of warming caused by human-caused greenhouse gas emissions.
This tight coupling of record counts to the rate or speed of warming implies that there will be early benefits of slowing down global warming.
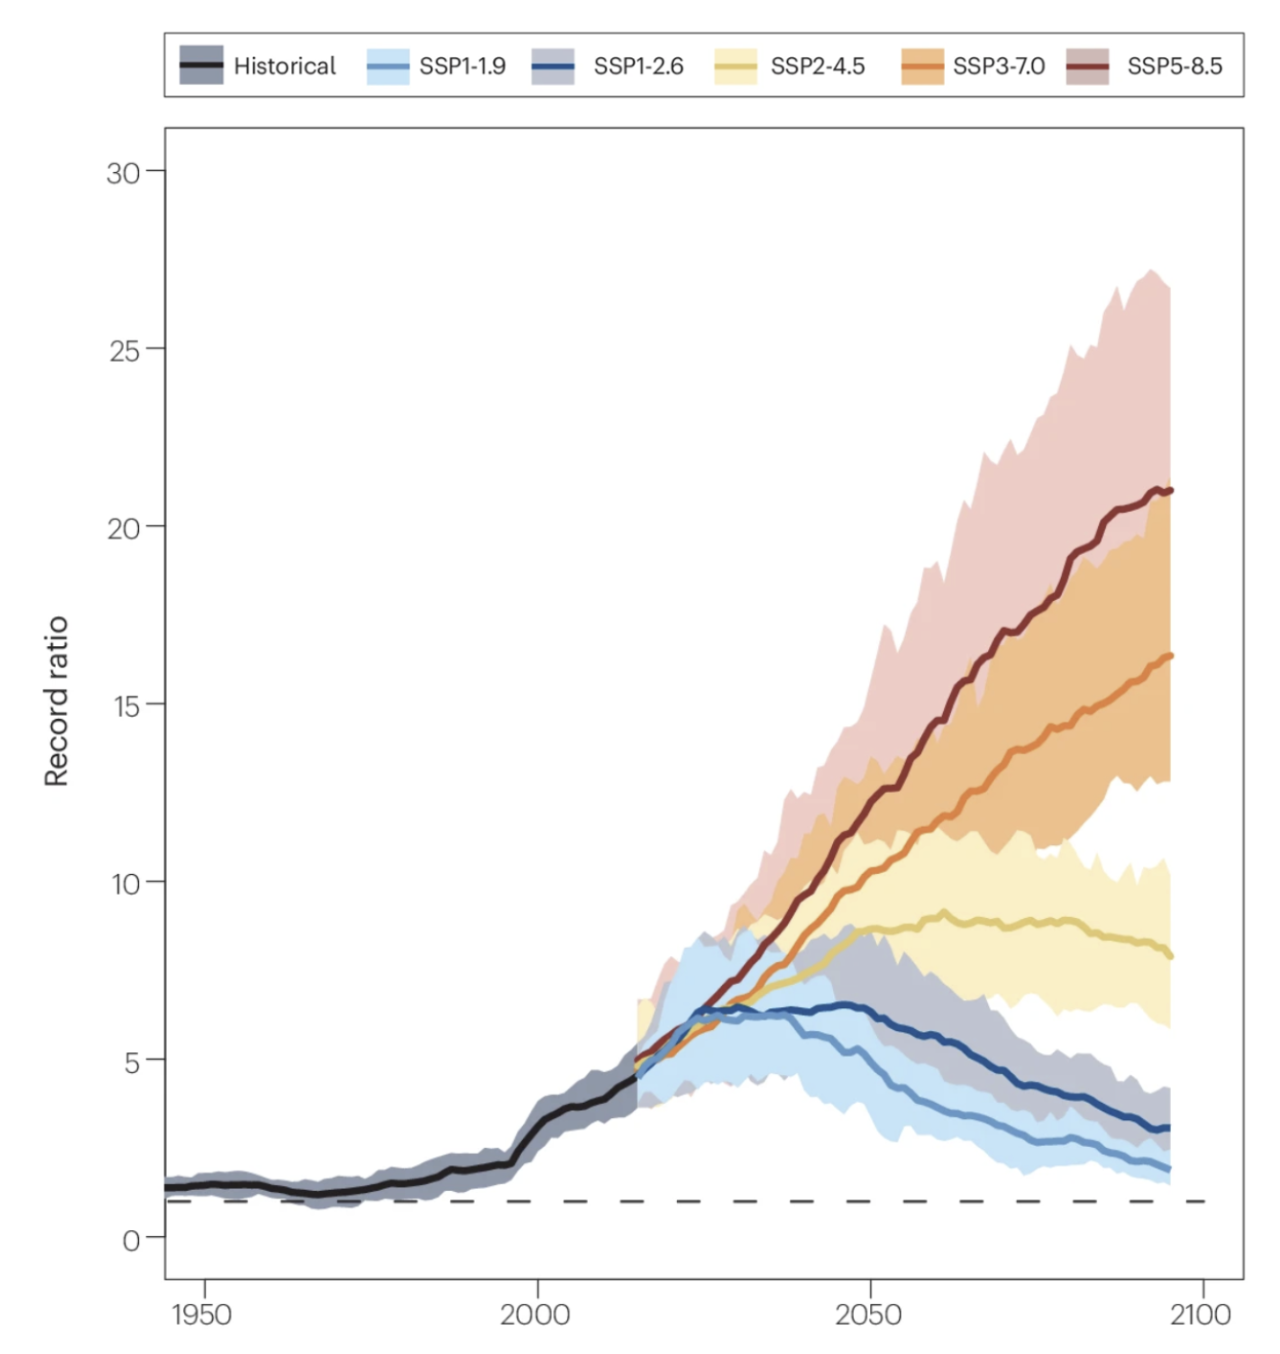
In our research, we look at how the probability of hot and cold records changes under different emissions reduction scenarios. To do this, we analysed the occurrence of record hot and cold events in climate model projections in the CMIP6 archive.
The figure below shows how stabilising temperatures by achieving net-zero carbon emissions (SSP1-1.9 and SSP1-2.6) will lead to a rapid decline of records, even if temperatures remain higher than in the historical period.
(It is worth noting that, while the number of records will decline under this lower-emissions scenario, the number of heatwaves would remain higher than today.)
Under intermediate (SSP2-4.5), high (SSP3-7.0) and very high emission (SSP5-8.5) scenarios, the number of records would continue to increase to levels much higher than today.
Rainfall records
We would also expect rainfall records to become progressively rarer in a stationary climate.
However, we find that record-breaking heavy precipitation occurred about 40% more often in 2015-24 than would be expected in a stationary climate. Many record-shattering heavy rainfall extremes occurred in the mid-latitudes and led to flooding which had large impacts.
(Calculating the frequency of records is more challenging for rainfall than for temperature, given small-scale variations and uncertainties in rainfall observations.)
The greater number of record-breaking rainfall events is due to an increase in precipitation intensity over most land regions as the atmosphere warms, as well as larger variations of rainfall intensity on a day-to-day, season-to-season and year-to-year basis .
We also find that the margin by which previous rainfall records are broken tends to become larger and larger in time. This is due to the “non-symmetric” distribution of rainfall – where there are many days with little precipitation, less with heavy precipitation and very few with very extreme precipitation.
It is therefore not surprising to see record-shattering precipitation events exceeding previous records by 20-50% in intensity, even if overall precipitation intensity increases by roughly 7% per degree of warming.
Preparing for the future
Efforts to adapt to climate change are typically informed by the worst events observed in recent generations.
This means that society is often underprepared for record-shattering events – which by their very definition are of unprecedented intensity.
Qualitative and quantitative storyline methods can offer insight into the many record-breaking events to come into the future – and, thus, help society prepare for escalating climate impacts.
These methods combine information from historical and paleoarchives, long measurement series, targeted climate model experiments, statistical and machine learning methods and weather forecasting systems.
Ultimately, these methods can improve society’s preparedness to climate change, so that the next record-shattering extreme does not come as a surprise.


The post Guest post: How climate change is fuelling record-breaking extreme weather appeared first on Carbon Brief.
Guest post: How climate change is fuelling record-breaking extreme weather
The UK has abandoned projects worth tens of millions of pounds that were meant to help protect Congo rainforests and support local people.
Together, these initiatives would have made up around half of the £200m that the UK pledged to support conservation in the Congo basin – the world’s second-largest rainforest.
When it hosted COP26 in Glasgow, the UK led a new initiative to end forest loss, which included a collective pledge by 12 donors of “at least” $1.5bn (£1.1bn) for Congo rainforest nations by 2025.
Development minister Jenny Chapman revealed last week that, as of 2024, the UK had only provided £39.8m towards this goal.
Alongside the US and much of Europe, the UK has significantly cut its aid budget in recent years, leading to much of its Congo rainforest spending being cancelled or reappraised.
The government says it still plans to “prioritise” rainforest regions, including the Congo basin, but civil society groups and MPs are concerned about the lack of “ring-fenced” forest funding in the UK’s new aid strategy.
COP pledge
At COP26, the UK – led by then prime minister Boris Johnson – launched the “Glasgow leaders’ declaration”, with a goal to “halt and reverse forest loss” by 2030. This was backed by more than 140 nations.
The UK also made various funding pledges, including £200m to protect the Congo basin, £350m for tropical forests in Indonesia and “up to £300m” for the Amazon.
These commitments target the world’s three largest rainforests, all of which face major forest loss due to threats such as agriculture, logging and climate change.
The Congo basin is the planet’s largest forested carbon sink. Yet, its six host nations are among the poorest in the world and face significant funding barriers.
This has global ramifications. An official UK assessment warned that “degradation or collapse” of the Amazon or Congo rainforests “threaten UK national security and prosperity”.
Forest cuts
Following successive aid cuts introduced by both the Conservative and then Labour governments – tracking a global trend – the UK’s Congo funding is under threat.
The Congo basin forest action programme (CBFA) was launched by the UK at COP27. It was explicitly set up to provide “roughly half” of the UK’s £200m Congo pledge.
CBFA set out to “empower central African nations”, such as the Democratic Republic of the Congo (DRC), with support for “community forests” and other measures to curb forest loss.
Now, after reporting delays, the UK has slashed the CBFA as part of the Labour government’s recent aid cuts, intended to free up money for defence spending.
Its original £90m budget has now been reduced to £18.8m. Government data shows that £15m of this has already been spent.
This is not the only Congo project that has been dropped due to this latest round of aid cuts.
The Congo part of the biodiverse landscapes fund – championed by the previous government and worth at least £12.3m – has been closed, just two years into its seven-year schedule.
Government documents reveal more Congo forest funding is at risk as the UK scales back its aid budget, including the UK’s two largest remaining projects in the region.
One initiative, intended to “incubate forest-friendly enterprises” in DRC, faces “reduc[ed] budgets”. Officials working on the other, while more optimistic, reported that the project may be forced to operate in fewer countries as the cuts set in.
Documents also reveal the difficulties that come when operating in the Congo, including “complex political economies” and, in Gabon, a military coup – which “complicated matters”.
‘Breaking promises’
Damian Fleming, a senior director of forests at WWF International tells Carbon Brief:
“Tropical forest countries are making long-term policy and development choices in expectation that international partners will honour their commitments.”
In a series of recent parliamentary responses, Chapman revealed that the UK had only spent £39.8m on Congo forest finance, as of 2024. (She declined to provide any information on the Indonesia and Amazon regional goals.)
Despite being presented as the UK’s “contribution” to the £1.1bn-by-2025 global goal agreed at COP26, the £200m target has a deadline of 2029.
Therefore, while the collective goal has been met, the UK’s contribution so far has been relatively small.
Zac Goldsmith, a former Conservative minister who oversaw the forest targets at COP26, tells Carbon Brief that, in his view, the UK has “discarded” its regional pledges:
“We have gone from being perhaps the leader on protecting nature internationally to breaking promises to countries around the world for whom the environment is an existential issue.”
Future targets
The Labour government says it has met the five-year “climate finance” target of £11.6bn that expires this year.
Ministers also say the government has met “and exceeded” the £3bn and £1.5bn sub-goals for “preserving nature” and forests, respectively, within the £11.6bn. These are the funding streams that include support for the Congo basin and other rainforests.
The UK has funded a variety of projects in line with its forest goals, including mangrove restoration in Indonesia, support for carbon-offsetting projects in Brazil and promoting “forest stewardship” among farmers in Cameroon.
Chapman has stated that the UK will continue to “prioritise” the Congo rainforest, in line with its new plan for aid spending in Africa. The UK even helped to launch a new “call to action” for Congo basin funding at COP30 last year.
The UK government also says it supported the creation of Brazil’s flagship “Tropical Forest Forever Facility” (TFFF). However, so far it has not provided any funding for the facility.
When the government announced a new climate finance pledge for 2026 onwards, it stressed that nature would still be a “focus” and said it would also generate billions in “climate and nature positive investments”. Nevertheless, it dropped the “ring-fenced” amounts for nature and forests that had appeared in its previous pledge.
The UK, alongside other developed countries, has pledged to provide biodiversity finance to developing countries, under the Kunming-Montreal Global Biodiversity Framework (GBF) – a non-binding global pact to halt and reverse nature loss by 2030.
Sarah Champion, chair of the international development committee of MPs, says “sub-pledges” for nature and forests are a “cost-effective and impactful” way to ensure this finance is provided, alongside climate finance. She tells Carbon Brief that she was “concerned” about the move away from this approach:
“When the minister recently appeared before the international development committee, I was concerned to hear her characterise this shift as a ‘gamble’.”
A government spokesperson tells Carbon Brief:
“We remain committed to providing finance for forests, including in the Congo basin, as a core element of our overall climate funding.”
A shorter version of this article was first published in Cropped, Carbon Brief’s fortnightly newsletter that provides a digest of food, land and nature news, on 15 July 2026. Subscribe for free.


The post UK withdraws millions in funding from world’s second-largest rainforest in Congo appeared first on Carbon Brief.
UK withdraws millions in funding from world’s second-largest rainforest in Congo
Climate Change
Cropped 15 July 2026: Uganda starves | Trump opens endangered habitats | UK cuts rainforest aid
We handpick and explain the most important stories at the intersection of climate, land, food and nature over the past fortnight.
This is an online version of Carbon Brief’s fortnightly Cropped email newsletter.
Subscribe for free here.
Key developments
Global drought and heat
DRY THEN WET: A recent heatwave and months of low rainfall has led to a prolonged drought for Uganda, resulting in at least 16 deaths from hunger and significant crop losses, reported BBC News. Bastille Post Global suggested that “a developing El Niño later this year could bring heavier rainfall to parts of the region, raising the risk of flooding in areas now struggling with drought”.
FUNDING FOOD: The UN Food and Agriculture Organization (FAO) and the World Food Programme (WFP) have appealed for $200m in funding to help African nations deal with the impact of El Niño, stated Deutsche Welle. This would target 22 high-risk countries with measures, including “cash transfers, climate-resilient seeds, livestock protection and flood control.” The Guardian explained how El Niño could still “cause a severe shock to global food prices lasting into 2028”.
FARMING FEARS: Extreme weather has devastated agriculture across the world. India saw its driest June in 12 years, reported BBC News, and France has had a “double-digit production” decline, according to Le Monde. The Financial Times reported that farmers in the UK are mitigating the impacts of extreme heat by eliminating “chemicals and intensive ploughing to improve soil quality so it retains water”.
EURO FIRES: Wildfires have spread across Europe, with Spain reporting at least 12 deaths so far, according to the Guardian, and France experiencing road closures, said Reuters. Wildfire Today reported that the most extreme conditions are “across France, Spain and northern Portugal, the Alpine arc extending into northern Italy, the south of the UK and south-east Ireland”. CNN explained how “the climate crisis is driving hotter, drier weather, which is setting the stage for fiercer fire seasons”.
Endangering species
REDEFINING HARM: The Trump administration “reversed decades of longstanding environmental law protecting endangered species…opening up sensitive habitats…to drilling, mining, farming and real estate development”, reported CNN. According to the story, the change “redefines what constitutes ‘harm’” to endangered species, which historically prohibited habitat modification or degradation. Agence France-Presse reported that US environmental groups sued the Trump government over the move, arguing that it had violated “common sense, biological science and federal law”.
OPEN SEASON: Reuters reported that the change “limits the reach of the 50-year-old Endangered Species Act” (ESA), which is a “key regulatory consideration” when granting permits for “oil and gas, mining, electric transmission and other operations on federal lands and water”. Legal scholars told the New York Times the US government “was acting without conducting scientific research into the impact” of the change, while the National Mining Association “applauded the announcement”.
News and views
- INTERNATIONAL WATERS: After a significant delay, the UK ratified the Biodiversity Beyond National Jurisdiction Agreement (BBNJ), also known as the High Seas Treaty. Oceanographic detailed how this will allow for “marine protected areas across international waters for the first time”, but also stressed that the “hard part” starts now.
- SCOPE-FREE: The world’s largest meat supplier JBS “scrapped a key climate goal” in its net-zero plan that accounts for its suppliers’ emissions, “which make up the vast bulk of the company’s environmental footprint”, reported the Financial Times. The company told the paper it was difficult to control these “indirect” emissions.
- DEEP TROUBLE: Pacific gray whales are facing a “catastrophic die-off” as sea-ice loss threatens their food sources, said the Guardian. Separately, conservationists warned that more than half of all molluscs that “cluster around underwater vents” could face extinction from deep-sea mining, reported Reuters.
- ETHANOL PUSHBACK: India’s new rules to promote 100% ethanol fuel and make ethanol-blended fuel mandatory at pumps “triggered a political row”, reported the Times of India. While the Indian government defended the push to automobile owners, a Hindu editorial and an Indian Express comment warned against incentivising fuels made from “water-intensive” sugarcane and rice.
- AMAZON ACTION: Deforestation in the Brazilian Amazon fell to its lowest level in a decade, but president Lula’s plans to “end illegal deforestation by 2030” could be hampered if he is not re-elected, reported Al Jazeera. Meanwhile, Colombia’s outgoing environment minister warned of greater environmental and climate risk under the incoming government, said the Associated Press.
- WAR WORRIES: The International Energy Agency (IEA) warned of the impact of the Iran war on Africa’s clean cooking efforts as disruption in the strait of Hormuz has stunted supplies and increased prices of liquefied petroleum gas (LPG), explained Climate Home News.
Spotlight
UK ‘discards’ Congo rainforest funding
Amid worldwide cuts to aid spending, Carbon Brief explores how the UK is backtracking on funding for the Congo basin – the world’s second-largest rainforest.
The UK has abandoned projects worth tens of millions of pounds that were meant to help protect Congo rainforests and support local people.
Together, these initiatives would have made up half of the £200m that the UK pledged to support forest conservation in the Congo basin.
When it hosted COP26 in Glasgow, the UK led a new initiative to end forest loss, which included a collective pledge of “at least” $1.5bn (£1.1bn) for Congo rainforest nations by 2025.
Development minister Jenny Chapman revealed last week that, as of 2024, the UK had only provided £39.8m towards this goal.
COP pledge
At COP26, the UK – led by then prime minister Boris Johnson – launched the “Glasgow leaders’ declaration”, with a goal to “halt and reverse forest loss” by 2030.
The UK also made various regional funding pledges, including £200m for the Congo basin, £350m for tropical forests in Indonesia and “up to £300m” for the Amazon.
All of these rainforests face major forest loss. The Congo basin is the planet’s largest forested carbon sink, but its six host nations are among the poorest in the world and face significant funding barriers.
This has global ramifications. An official UK assessment warned that “degradation or collapse” of the Amazon or Congo rainforests “threaten UK national security and prosperity”.
Forest cuts
Following successive aid cuts introduced by both Conservative and Labour governments – tracking a global trend – the UK’s Congo funding is under threat.
The Congo basin forest action programme (CBFA) was explicitly set up to provide “roughly half” of the UK’s £200m Congo pledge.
Now, after reporting delays, the UK has slashed the CBFA as part of the Labour government’s aid cuts. Its £90m budget has been “quietly reduced by 79% to £18.8m”, according to the Times.
This is not the only Congo project that has been dropped due to aid cuts. The Congo part of the biodiverse landscapes fund – worth at least £12.3m – has closed five years early.
Official documents reveal more Congo forest funding is at risk, including the UK’s two largest remaining projects in the region. One initiative, intended to “incubate forest-friendly enterprises” in DRC, faces “reduc[ed] budgets”.
Documents also show the difficulties operating in the Congo, including “complex political economies” and, in Gabon, a military coup – which “complicated matters”.
‘Breaking promises’
Damian Fleming, a senior forests director at WWF International told Carbon Brief:
“Tropical forest countries are making long-term policy and development choices in expectation that international partners will honour their commitments.”
In a parliamentary response, Chapman said that the UK had spent £39.8m towards its £200m Congo target, as of 2024.
Despite being described as the UK’s contribution to the £1.1bn-by-2025 global goal agreed at COP26, the £200m target has a deadline of 2029. Therefore, while the collective goal has been met, the UK’s contribution was relatively small.
Zac Goldsmith, a former Conservative minister who oversaw the forest targets at COP26, told Carbon Brief that, in his view, the UK has “discarded” its regional pledges:
“We have gone from being perhaps the leader on protecting nature internationally to breaking promises to countries around the world.”
The Labour government says it has met its overarching “climate finance” goals and still intends to “prioritise” the Congo rainforest.
However, civil society groups and MPs are concerned about the lack of “ring-fenced” forest funding in the UK’s new aid strategy.
Watch, read, listen
TOXIC TROUBLES: DeSmog unpacked a new report that said Northern Ireland is being turned into a “toxic” pig and poultry farming “sacrifice zone” to satiate the UK’s meat appetite.
NEED TO NOAA: Laid-off scientists from the US’s National Oceanic and Atmospheric Administration (NOAA) launched Climate.Us – an independent, public-backed version of the climate information website shut down by Trump last year.
DRY FRUIT: A Dialogue Earth long read looked at how climate change is impacting apricot harvests in the “stark, high-altitude desert” region of Ladakh, India.
READING ALOUD: A London Review of Books podcast discussed Robin Wall Kimmerer’s influential book “Braiding Sweetgrass”, weighing its compelling themes and where it veers into “scientific overreach”.
New science
- Climate change could cause Indigenous peoples in the Amazon to lose 28-34% of their plant species and 18-23% of their associated services | Nature
- Biodiversity in forests can act as a “buffer” against compound extreme weather events | Nature Communications
- Zero-deforestation commitments in Indonesia’s palm oil sector have had “no additional impacts” on reducing forest loss | Proceedings of the National Academy of Sciences
In the diary
- 7-15 July: High-level political forum on sustainable development | New York City
- 13-31 July: Meeting of the International Seabed Authority assembly and council | Kingston, Jamaica
- 16 July: International Energy Agency critical minerals outlook 2026, online
- 27 July-1 August: Scientific and technical subsidiary body meeting of the UN Convention on Biological Diversity | Nairobi, Kenya
This edition of Cropped was written by Jess Milligan, Josh Gabbatiss and Aruna Chandrasekhar. Cropped is edited by Dr Giuliana Viglione. This edition was edited by Daisy Dunne. Please send tips and feedback to cropped@carbonbrief.org.
The post Cropped 15 July 2026: Uganda starves | Trump opens endangered habitats | UK cuts rainforest aid appeared first on Carbon Brief.
Cropped 15 July 2026: Uganda starves | Trump opens endangered habitats | UK cuts rainforest aid
Climate Change
Campaigners oppose Dangote’s planned Kenya refinery over climate and ecological risks
Climate and environment campaigners have urged the Kenyan government to halt plans for a proposed 700,000-barrel-per-day oil refinery backed by Africa’s richest man, Aliko Dangote, warning the project threatens one of East Africa’s most ecologically sensitive coastlines.
The refinery, which is planned to be situated in Lamu County on Kenya’s northern coast, will be East Africa’s largest refining project and is expected to take up to three years to build. Once finished, it would supply refined petroleum products to Kenya, Uganda, Tanzania and Rwanda, among others, helping to reduce the region’s dependence on imported fuels.
Campaigners are questioning the viability of such a large refinery at a time when renewable energy and electric transportation are expanding rapidly.
Mohamed Adow, director of a Kenya-based climate and energy think-tank Power Shift Africa, said the decision to give Dangote the green light for the refinery is “an extraordinary act of environmental recklessness and economic short-sightedness”, arguing it would tie Kenya to “yesterday’s energy system” just as global demand for petroleum products faces increasing uncertainty.
-
Nigeria gives fossil gas a bigger role as “transition fuel” in climate plan
Officials say the country needs time and money to ramp up renewables, but critics say betting on gas is a risky strategy that could prolong the “oil curse” -
Gas flaring soars in Niger Delta post-Shell, afflicting communities
Since the multinational sold its assets in Nigeria’s oil hub, data analysis for Climate Home News shows flaring has risen, harming locals and the climate


Campaigners argue the refinery risks coming online just as transport – the largest market for petrol and diesel – is beginning to electrify across the continent.
Kenya launched a National Electric Mobility Policy earlier this year to speed up the uptake of electric vehicles (EVs) and reduce the country’s roughly $5 billion annual fuel import bill. Ethiopia has already banned imports of non-electric vehicles and now has more than 100,000 EVs on its roads, while Rwanda is expanding its electric mobility programme with plans to convert its fleet of around 100,000 motorcycles to electric.
Adow said the project risks billions of dollars in investment in infrastructure that could become obsolete as the world moves away from oil.
“Building a refinery today assumes decades of robust demand for fuels that much of the world is actively trying to phase out,” he said in a statement.
Ecological concerns
Lamu – the proposed site for the project – is home to the UNESCO World Heritage-listed Lamu Old Town and an archipelago containing extensive mangrove forests, coral reefs and seagrass beds that support fisheries, tourism and coastal livelihoods.
Locating the refinery in Lamu would “place one of Africa’s largest fossil fuel developments in one of the continent’s most ecologically sensitive and culturally significant coastal regions,” Power Shift Africa said.
Major emitting countries knew of climate risks decades earlier than claimed
Sherelee Odayar, oil and gas campaigner at Greenpeace Africa, warned that a refinery of this scale could increase the risk of habitat destruction, marine pollution, oil spills and air pollution in one of East Africa’s most fragile coastal ecosystems.
She said the risks stem not only from the refinery itself – including storage tanks, pipelines and fuel handling facilities – but also from the large volumes of crude oil that would need to be shipped into Lamu and refined products exported by sea. Increased tanker traffic and fuel transfers, she said, would raise the likelihood of accidents in ecologically sensitive coastal waters.
Odayar added that Lamu’s low-lying, flood-prone coastline could compound those risks by damaging infrastructure and carrying contaminants from storage facilities into nearby fishing grounds and marine ecosystems.
“Lamu’s mangroves, coral reefs and seagrass beds are not expendable; they support fisheries, livelihoods and coastal protection,” Odayar added.
She said Kenyan authorities should suspend any approvals until an independent environmental and social impact assessment is completed, with genuine public participation and transparent scrutiny of the long-term economic, health and ecological risks.
“Any review must assess cumulative impacts on Lamu’s mangroves, coral reefs, seagrass beds and fishing livelihoods, alongside the wider economic risk of locking Kenya into costly fossil fuel infrastructure as the global energy transition accelerates”.
Dangote Group declined to answer questions from Climate Home News when contacted by phone.
Technological change threaten project’s future
The Kenya refinery would replicate Dangote’s 650,000-barrel-per-day refinery in Lagos, currently Africa’s largest, which has plans to more than double capacity to 1.4 million barrels per day by 2028.
Adow of Power Shift Africa said projects like this represent “a breathtaking failure to recognise where the global economy is heading”, pointing out that the East African refinery risks arriving when Africa is experiencing an unprecedented clean energy boom.
Referencing Africa’s solar boom, global electric vehicles uptake and the International Energy Agency’s projection that global oil demand is set to enter a decline later this decade, the think-tank founder said African governments risk anchoring the continent’s future to an industry facing mounting economic uncertainty.
Loss and damage fund delays first project approvals as needs dwarf resources
The organisation said the project faces a bigger threat aside from environmental opposition and that is technological change. “The danger is not simply that the refinery will pollute, it is that it will become obsolete long before it has paid for itself,” he added.
Kenyan President William Ruto said the project will create about 60,000 jobs for Kenyans and supply refined fuel to eight East and Central African countries.
GreenPeace Africa’s Odayar said the promise of ‘thousands of jobs’ cannot be used to hide the true cost of the investment which is that large fossil fuel projects often create temporary jobs while undermining existing livelihoods in fishing, tourism and small-scale local economies.
“The enormous capital required for a project of this scale could instead help accelerate Kenya’s renewable energy future through solar, wind, geothermal, storage and better energy access,” she added.
The post Campaigners oppose Dangote’s planned Kenya refinery over climate and ecological risks appeared first on Climate Home News.
Campaigners oppose Dangote’s planned Kenya refinery over climate and ecological risks


-
Climate Change11 months ago
Guest post: Why China is still building new coal – and when it might stop
-
Greenhouse Gases11 months ago
Guest post: Why China is still building new coal – and when it might stop
-

 Greenhouse Gases2 years ago
嘉宾来稿:满足中国增长的用电需求 光伏加储能“比新建煤电更实惠”
-

 Climate Change2 years ago
嘉宾来稿:满足中国增长的用电需求 光伏加储能“比新建煤电更实惠”
-
Climate Change2 years ago
Bill Discounting Climate Change in Florida’s Energy Policy Awaits DeSantis’ Approval
-

 Renewable Energy9 months ago
Sending Progressive Philanthropist George Soros to Prison?
-

 Carbon Footprint2 years ago
US SEC’s Climate Disclosure Rules Spur Renewed Interest in Carbon Credits
-
Greenhouse Gases1 year ago
嘉宾来稿:探究火山喷发如何影响气候预测