
Methane, a potent greenhouse gas, is responsible for about 30% of the global temperature increase observed since the industrial revolution.
China accounts for more than 10% of annual global human methane emissions, in large part due to unintended releases – known as “fugitive” emissions – from its energy sector.
In a recently published study, we take a closer look at China’s coal-mine methane (CMM) emissions, which account for roughly 40% of the nation’s total methane emissions.
Leveraging newly collected, mine-specific data, we develop granular estimates of CMM emissions in China since 2000.
These estimates reveal that China’s coal production is shifting towards provinces with lower-emission mines.
In addition, there has been a significant increase in the capturing of methane from coal mines for energy use.
Together, these developments have helped to limit the rise of CMM emissions, despite an overall increase in coal production since 2016.
Mine data
To estimate CMM emissions at a granular level, we needed to understand how emissions vary from one mine to the next across China.
To do this, we made use of existing safety regulations in China. As methane is a highly flammable gas, the Chinese government enforces mandatory methane gas level identification in coal mines and implements safety regulations accordingly.
Coal mines are categorised based on their “methane emission factors”, the volume of methane emitted per tonne of coal produced.
At one end are low-gas mines, with an emissions factor of less than 10 cubic metres (m3) of methane emitted per tonne of coal. At the other are high-gas mines, at more than 10m3 of methane emitted per tonne. Beyond this are “outburst” mines, which are those that have experienced coal seam or gas outburst incidents.
To get a clearer sense of how much low-gas, high-gas and outburst mines emit in practice, we built a model of the relationship between gas levels and emission factors, using a 2011 database of all Chinese coal mines.
This database includes information on methane gas levels, mine-specific emission factors, coalbed depth, mine ownership and production capacity. We further validated this relationship with newly collected coal mine data from 2023, published by Chinese local governments.
The results show that the distribution of emission factors, as shown in the figure below, varies significantly with gas level.
The top row in the figure below shows the emissions factors for a range of mines in 2011 classed as low-gas (top left, green), high-gas (top centre, pink) or outburst (top right, red). The dashed vertical lines show the central estimate for each type, ranging from 4.1m3 per tonne for low-gas mines through to 19.9m3/tonne for high-gas and 28.4m3/tonne for outburst mines.
The bottom row shows the same metrics based on the more recent 2023 data.
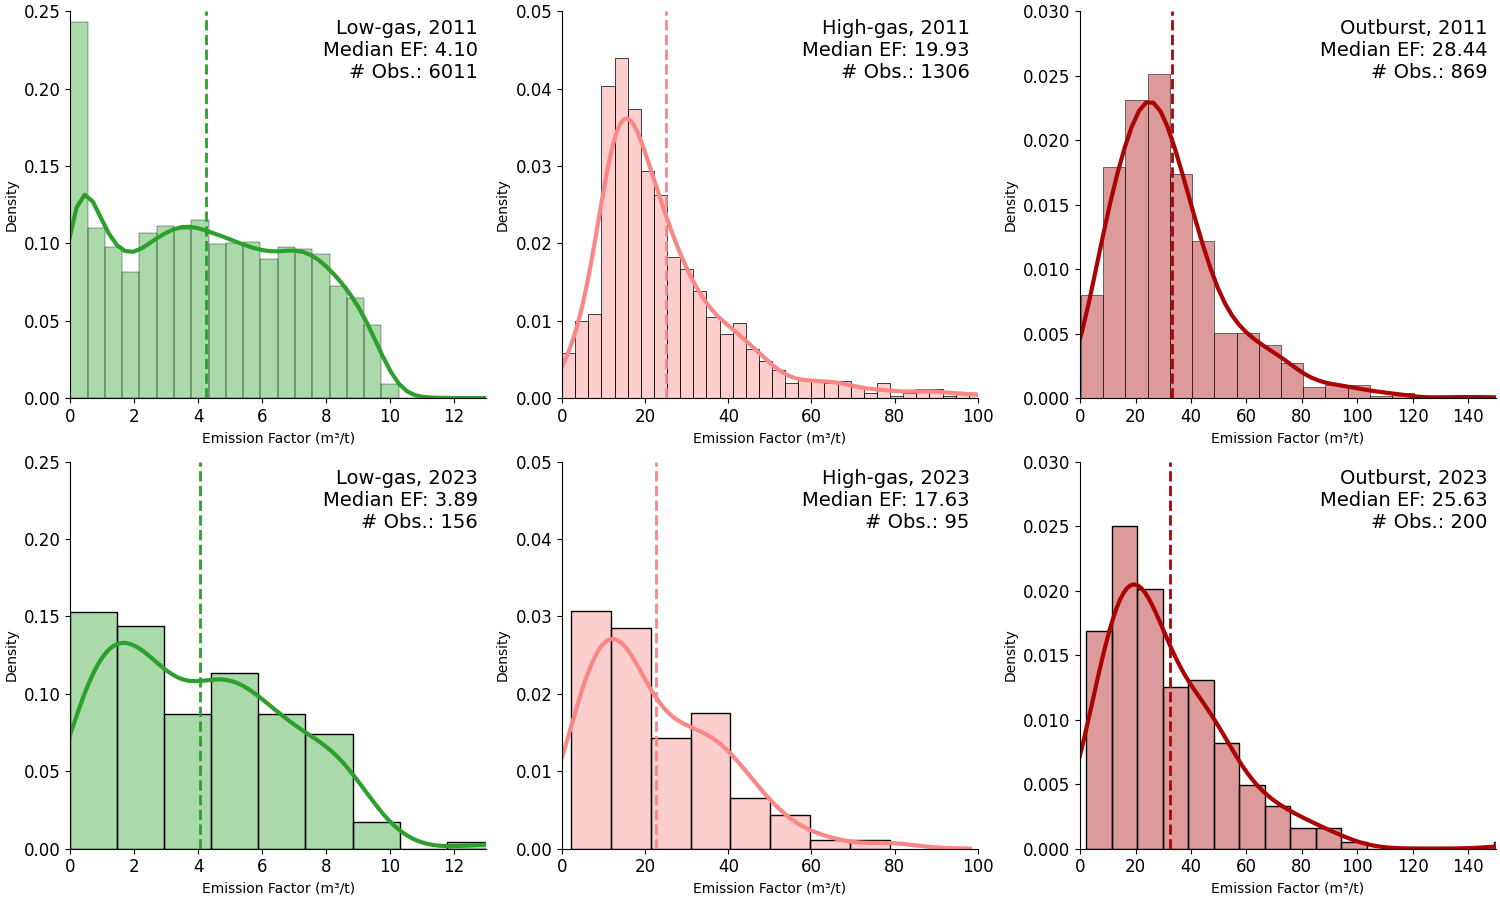
The strong correlation shown in the data above suggests that gas level is a crucial indicator of how much methane a coal mine emits.
In contrast, our analysis reveals no significant correlation between how much a coal mine emits and either coal mine depth or ownership.
Comparing the distributions for the same gas levels between 2011 and 2023 also shows that the link between gas levels and methane emissions remains fairly constant over time.
Therefore, the gas level of a mine can reliably serve as a proxy for its methane emissions per tonne of production, when direct measurements are unavailable.
Provincial shift
To estimate CMM emissions for each province in China, we assumed that the percentage of coal produced by mines of each gas level remains roughly constant as in 2011.
For instance, if 20% of Guizhou’s coal production in 2011 came from low-gas mines, we maintained this percentage for subsequent years.
We then calculated CMM emissions by multiplying provincial-level production-weighted emission factors by total coal production.
The line chart below illustrates our estimated CMM emissions since 2000.
The raw estimates, depicted by the lower grey dashed line, show a rapid increase in CMM emissions from approximately 5m tonnes in 2000 to nearly 21m tonnes in 2013.
This was followed by a decrease to 15m tonnes in 2016 and a subsequent rebound to 24m tonnes in 2023.
The decline between 2013 and 2016 aligns with a period of reduced coal production in China.
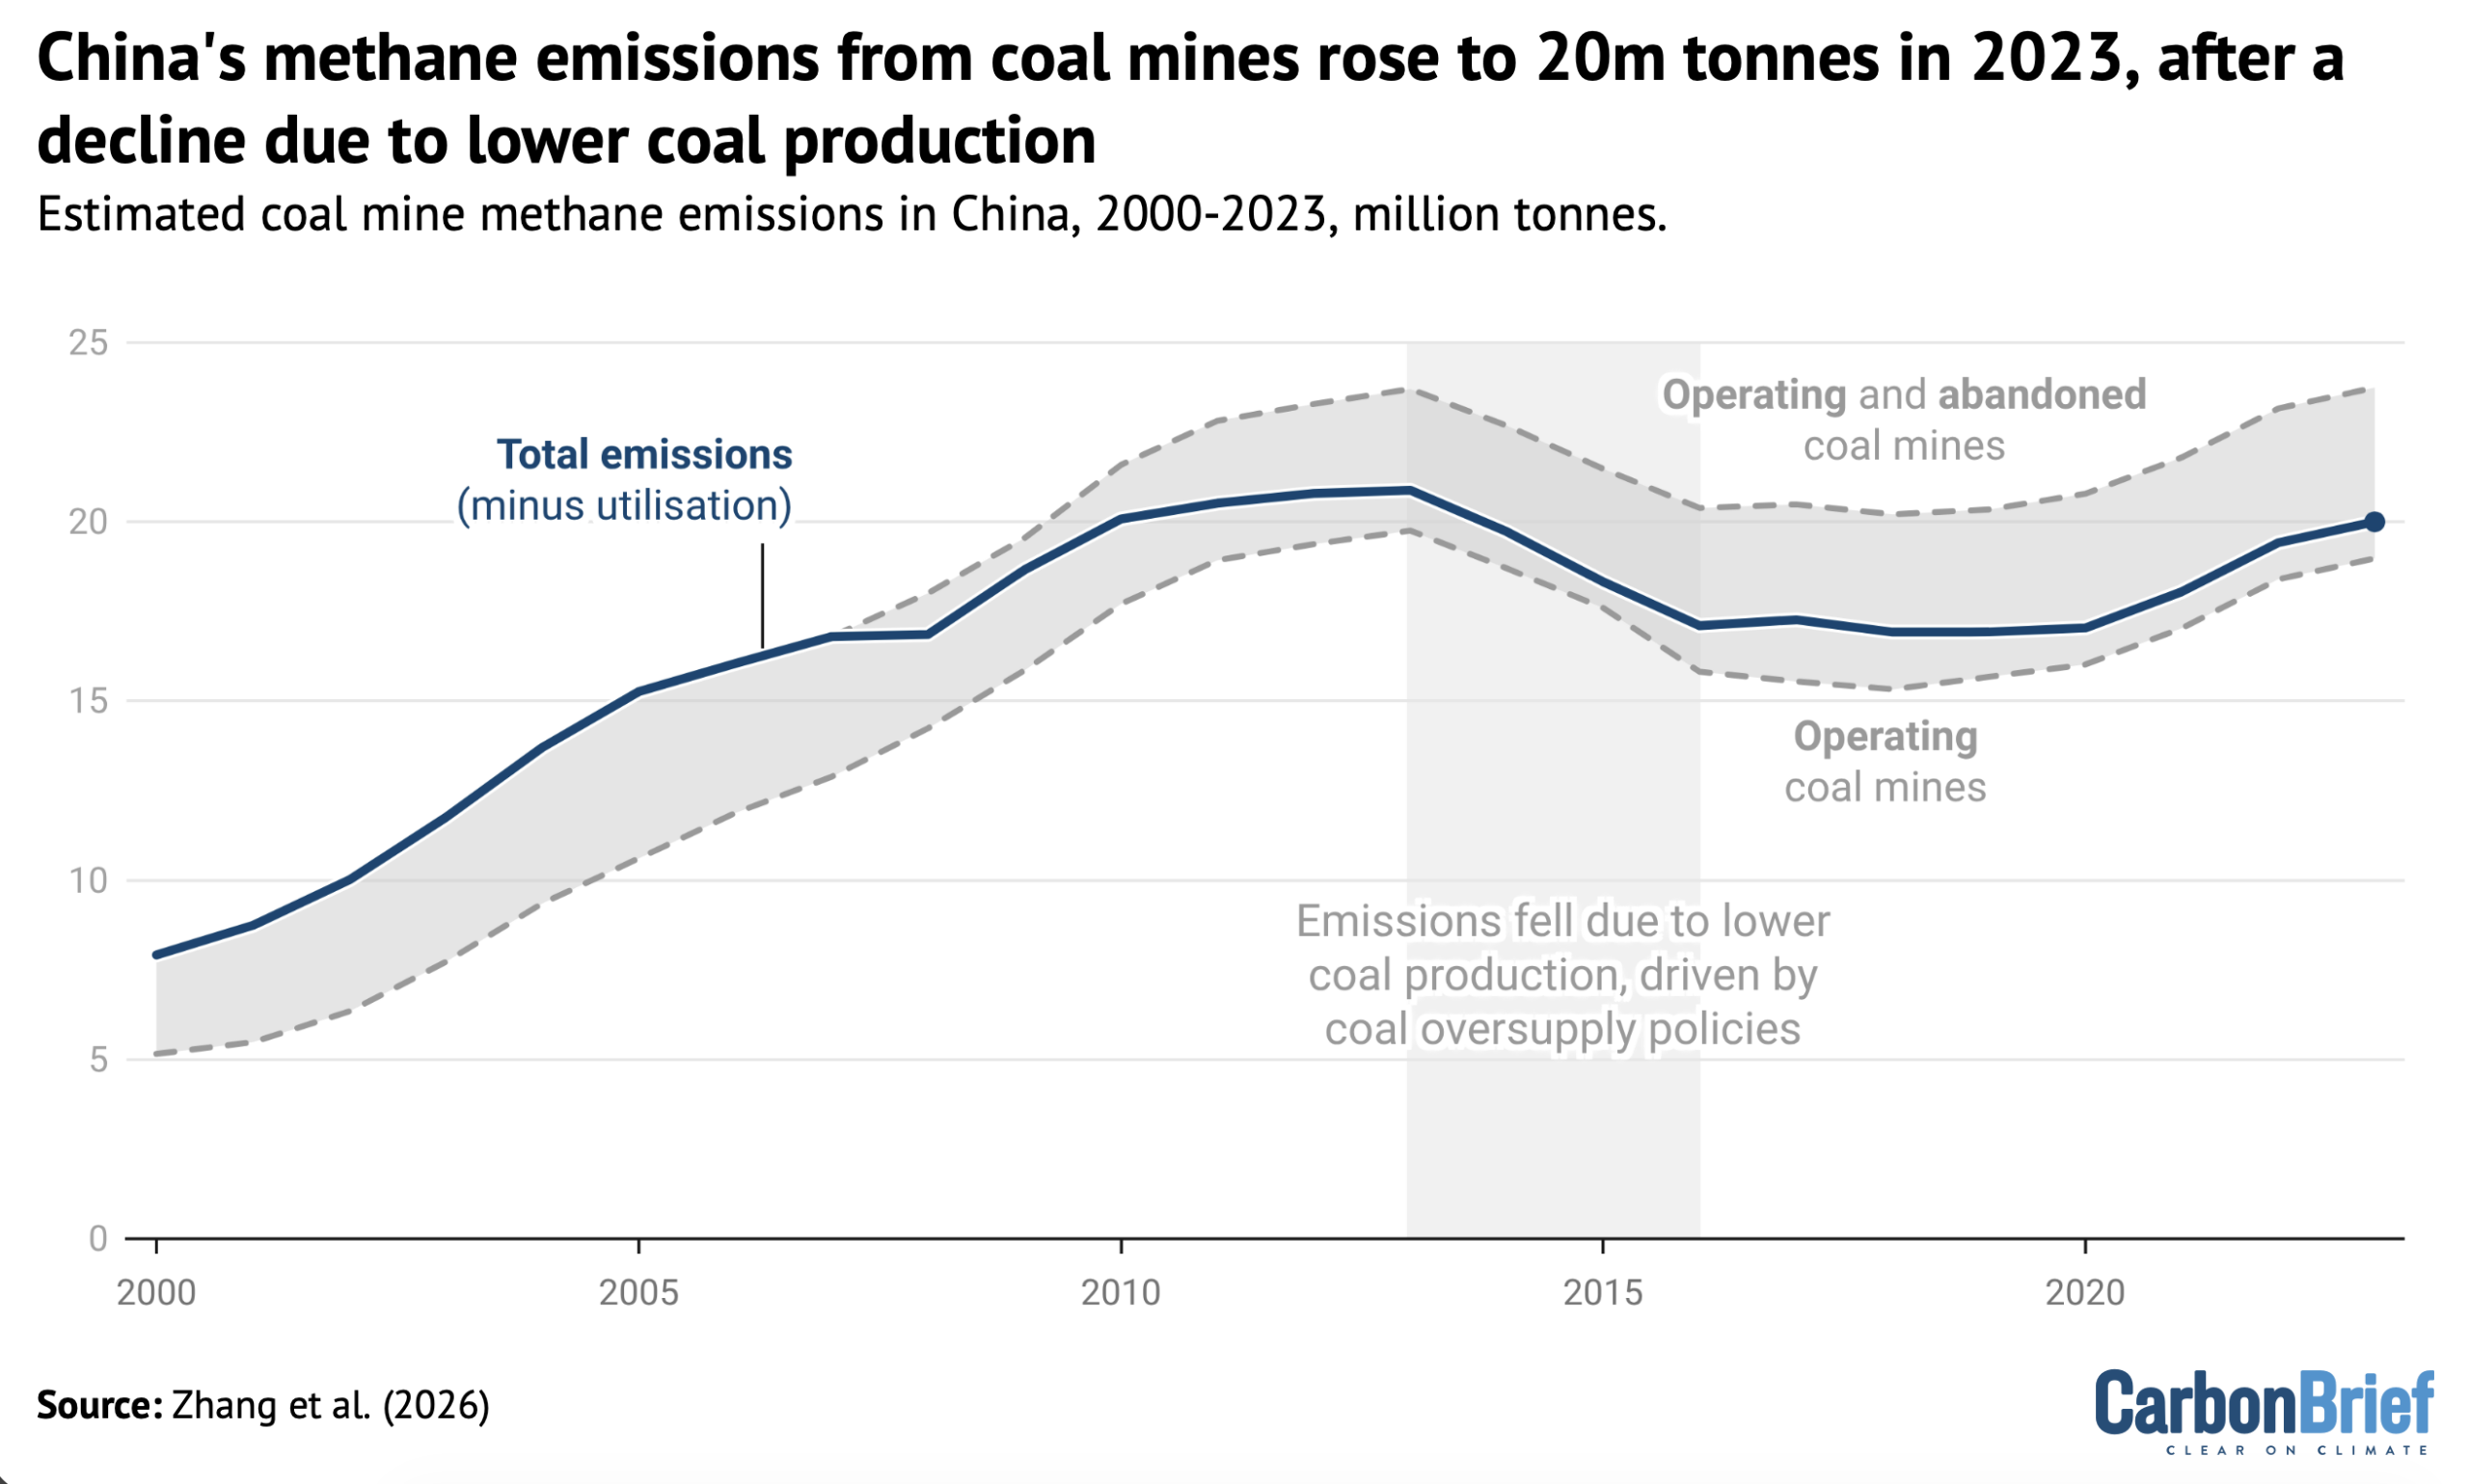
On the chart, the upper grey line represents CMM emissions when abandoned coal mines are included.
These mines, which continue to release methane long after operations cease, were responsible for 4.8m tonnes of methane emissions in 2020, contributing approximately 25% to the total CMM emissions.
Meanwhile, the blue line shows CMM emissions when the capture and use of methane in energy supply is taken into consideration.
National methane utilisation increased from 1.2m tonnes in 2008 to 3.7m tonnes in 2020, resulting in a reduction of total emissions by 5% and 17%, respectively.
It is noteworthy that CMM emissions did not immediately rebound after 2016, despite a reported increase in coal production by China’s National Bureau of Statistics.
This delay can likely be attributed to shifts in production locations to lower-emissions provinces, the closure of high-emissions mines and the adoption of technologies for capturing and using methane that effectively mitigate emissions.
The figure below compares CMM emissions across provinces in 2012 and 2021, two years with nearly identical total coal production levels.
Overall, changes in methane emissions closely mirrored shifts in where the coal was being mined. There is a clear geographic trend: production and emissions surged in northern and north-western regions such as Xinjiang, Shaanxi and especially Shanxi.
In fact, Shanxi alone emitted nearly 8m tonnes of coal-mine methane in 2021, making up roughly half of China’s total CMM emissions.
Meanwhile, both production and emissions dropped in south-western provinces, including Guizhou, Sichuan and Yunnan.
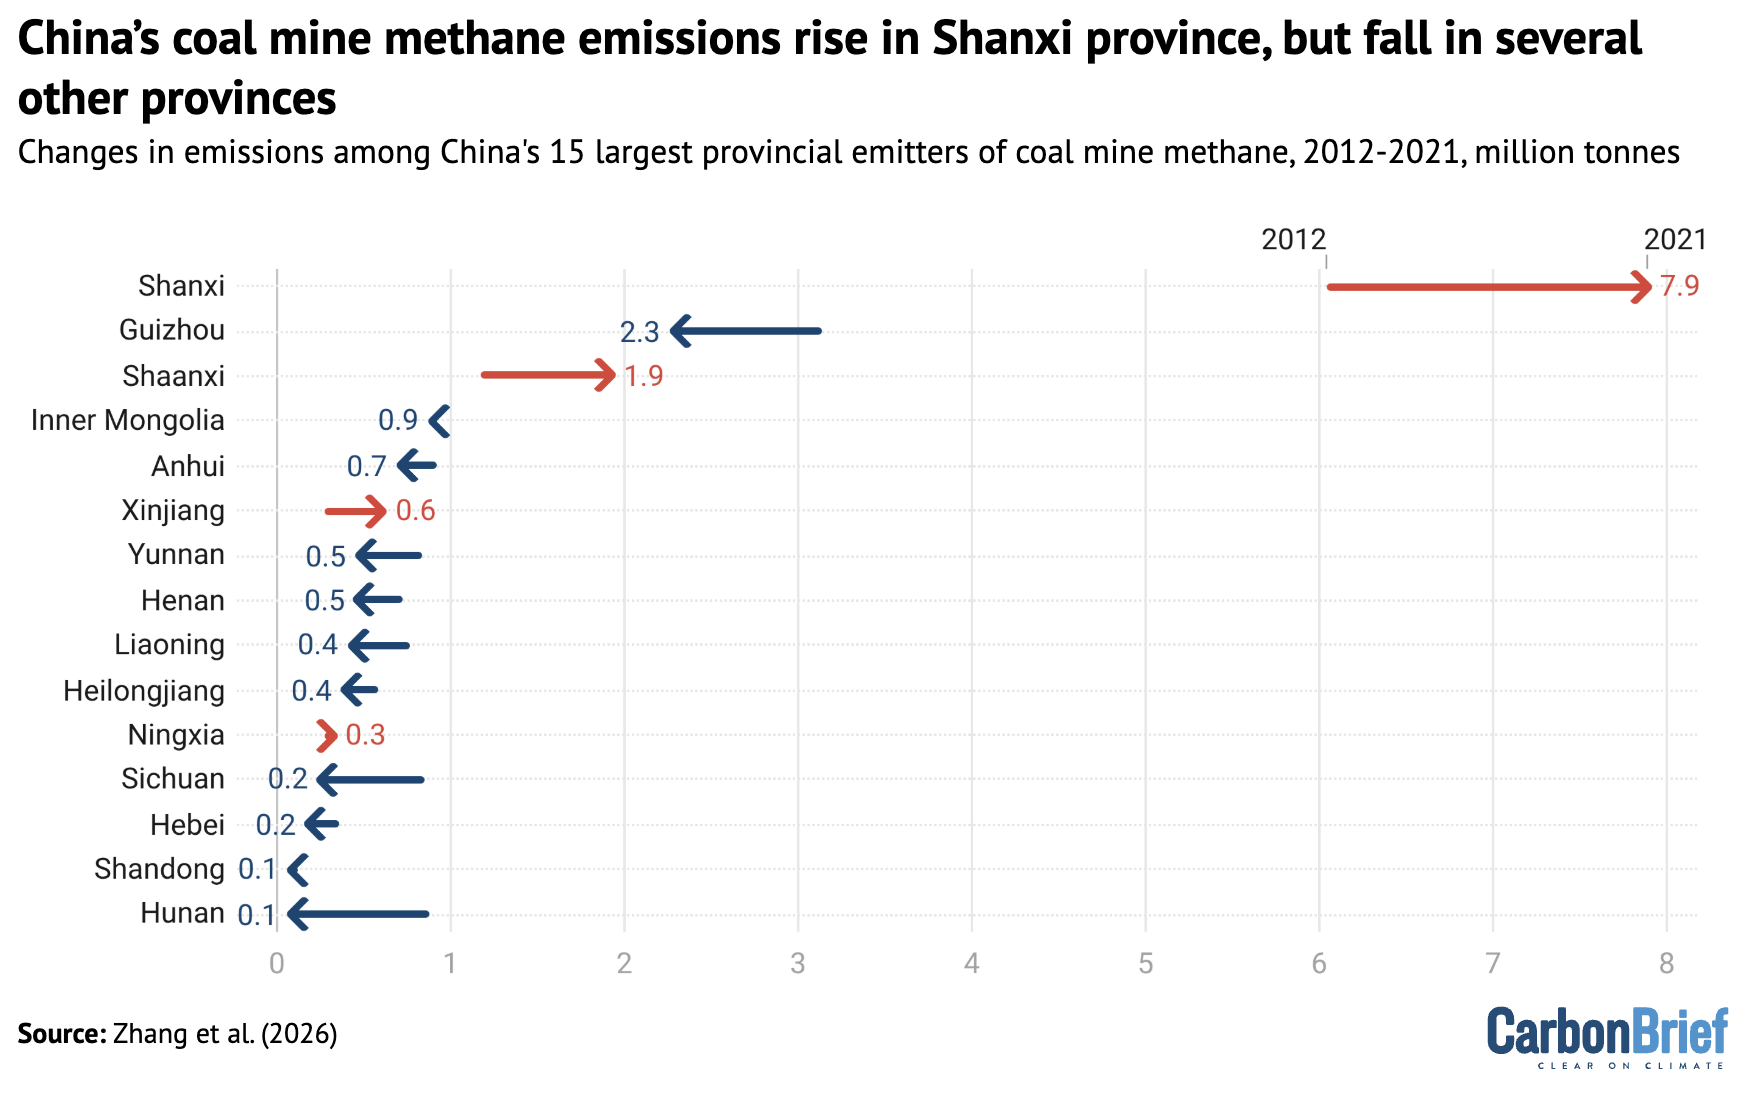
The figure shows that China’s coal production has switched from regions in the south-west where emissions per unit of coal production are relatively high, to lower-emission areas in the north and north-west. At the same time, total production levels have stayed similar, at just over 4bn tonnes in both 2012 and 2021.
Tackling methane
China has signalled its intention to address methane emissions, with key tasks for the next five years outlined in a national methane action plan published in 2023.
The broad trends of CMM emissions observed in this study will likely continue in China.
Small-scale coal mines – those producing less than 300,000 tonnes of coal per year – are at risk of closing or being consolidated, while increased production from large-scale, lower-emission mines in Xinjiang and Inner Mongolia will likely lead to an overall reduction in national production-weighted emission factors.
(This reduction in the rate of emissions per unit of coal production does not guarantee a reduction in methane emissions overall, as several analyses show this also depends on the total coal output. Even following closures, methane may still leak from abandoned mines.)
However, this regional shift in coal production – and, thus, methane emissions – could also help to address public health concerns from pollution associated with the gas.
The Chinese government has also introduced significant changes in policy on the capturing and use of methane gas. The Ministry of Ecology and Environment recently revised coal-mine methane standardsto mandate the capture and use of methane with concentrations above 8%, down from a previous 30%.
In addition, the government has a programme providing financial incentives for capturing methane and reducing CMM emissions.
Together, these measures could help China achieve its short- and medium-run methane capture and use goals set by the methane action plan.


The post Guest post: How changes to coal mining have affected China’s methane emissions appeared first on Carbon Brief.
Guest post: How changes to coal mining have affected China’s methane emissions
China and India have declined to back any of their old United Nations carbon credit projects seeking to sell offsets under the new UN market, driving a cull of nearly three-quarters of applicants, analysis of official data shows.
Only 415 out of more than 1,500 projects and programmes hoping to move from the Clean Development Mechanism (CDM) to the new carbon market set up under Article 6.4 of the Paris Agreement won the approval of their host governments by the 30 June deadline – a crucial step in transitioning them.
The two Asian giants, home to two-thirds of all applicants, account for the bulk of the exclusions. Brazil, the other heavyweight of the CDM era, took the opposite path, approving nearly all of its projects in a last-minute rush that leaves it with the largest number of activities still in the running to sell credits under the new mechanism.
Carbon market watchers have long regarded the CDM, set up under the Kyoto Protocol which has now been largely replaced by the Paris Agreement, as largely discredited for failing to drive real emission cuts. They also warned that letting its projects live on could dent confidence in the mechanism’s successor.
-
EU carbon credits could supercharge world’s clean cooking push, France says
The country’s top climate envoy says he discussed using cookstove carbon credits with TotalEnergies, which is working to expand the use of LPG cooking in Africa

If all projects seeking transition had been successful, they could have flooded the market with up to more than 900 million credits generated with largely outdated rules, according to UN estimates. One credit is equivalent to one tonne of carbon dioxide (CO2) and 900 million tonnes is similar to Japan’s annual emissions.
‘New era’
Injy Johnstone, senior research fellow at the Munich-based Max Planck Institute, said the failure of most projects to clear the hurdle sent a significant signal that carbon trading had entered a new era. “The system is trying to remove some of the hot air that had inflated it in the past,” she told Climate Home News.
“The lack of transition is the biggest contribution that Article 6 has made to climate yet,” she added, arguing that leaving “zombie credits” in the market creates confusion, especially for buyers that might not realise these units have lost their value.
Among the schemes that failed to win government approval are nine programmes promoted by fossil fuel companies over a decade ago to subsidise the construction of gas plants in the Global South, which Climate Home News has previously reported on.
Fossil fuel firms seek UN carbon market cash for old gas plants
But one of them, supporting the Ressano Garcia gas plant in Mozambique, could still profit from the new market after the country’s government granted its approval on deadline day itself.
Brazil leads projects transition
Established in 1997 under the Kyoto Protocol, the CDM allowed rich countries to meet part of their climate obligations by financing emission-cutting projects in poorer ones. It drew widespread criticism over its patchy human rights record and for failing to deliver promised climate benefits. Backers of the Article 6.4 market say it is a higher-integrity successor.
CDM projects were given a route back into the new mechanism under certain conditions at COP26 in Glasgow in November 2021, when governments agreed the rules for the Paris Agreement market.
Project developers had until the end of 2023 to apply and host governments were originally given until the end of 2025 to grant approval. But, after requests from many developing countries for an extension, at COP30 in Belém countries agreed to push the deadline back six months to the end of June.
Brazil was the single largest beneficiary of the decision, with all of its 92 approvals coming during the extension window. Hydropower plants, landfill gas schemes and wind farms make up the bulk of the South American country’s surviving portfolio, and hydro is the single most common project type in the global transition pipeline.
Peru greenlit the move of nearly a dozen hydropower plants, Thailand backed a batch of biogas and waste-to-energy schemes, and Mexico squeezed all of its approvals – including a controversial industrial gas project – into the final week. African nations including Zambia, Malawi and Ethiopia backed programmes aiming to switch households to cleaner cooking stoves, which have the potential to generate millions of offsets and are set to be the biggest source of credits among the surviving projects.
Long way from selling credits
Securing government support does not mean a scheme can now automatically sell credits under the Article 6 mechanism. Developers are required to submit additional documentation by the end of 2026 demonstrating that their programmes respect the mechanism’s stricter rules on environmental and social safeguards and on the risk of emission cuts being reversed. The Article 6.4 Supervisory Body, the mechanism’s regulator, has the final say on which projects are allowed into the market.
Those that make it through can sell credits for emission reductions achieved between 2021 and 2025 under the old CDM methodologies, with some adjustments aimed at preventing the creation of excess credits not backed by real emission cuts. For reductions achieved from 2026 onwards, projects will need to switch to new methodologies, which the regulator is currently developing.
So far, 30 programmes have completed the process, and only two cookstove projects in Myanmar have been formally approved to issue credits.
Civil society groups have called for an investigation into the activities in Myanmar over its ties to Myanmar’s military junta – which the UN says is guilty of human rights abuses – and allegations of “massively” overstating its climate impact.
The company behind the scheme said its engagement with authorities “should not be interpreted as political endorsement” of the junta, while disputing the calculations underpinning the claim that too many credits had been issued.
The post Most “zombie credits” locked out of new UN carbon market after China and India snub appeared first on Climate Home News.
Most “zombie credits” locked out of new UN carbon market after China and India snub
Climate Change
Debriefed 17 July 2026: UK ‘firewave’ | Fossil-fuelled heat deaths | London’s Natural History Museum spotlights climate
Welcome to Carbon Brief’s DeBriefed.
An essential guide to the week’s key developments relating to climate change.
This week
Heat and firewaves
‘FIREWAVE’: Wildfires ravaged Europe and North America this week. France utilised water-dumping planes collecting from the Seine to contain a fire in the Fontainebleau forest near Paris, according to the Associated Press. The Financial Times reported that the UK has had “25 non-consecutive days with temperatures of 30C or more, including nine days above 34C”, creating a “firewave” and putting pressure on emergency services. Meanwhile, an “orange haze from Canada wildfires” could be “seen in Ontario and northern US”, said BBC News.
‘NEW NORMAL’: Climate events previously seen as extreme are becoming the “new ‘normal’”, said the Met Office, in a report on the UK’s climate. While last year was the UK’s hottest on record, rising temperatures mean it is expected to be surpassed in the next few years, reported Reuters. Liz Bentley, head of the Royal Meteorological Society, told the Guardian that “climate change has been described by scientists for many years but is now increasingly being felt by the UK population in their own homes and communities”.
Around the world
- ELECTRIFYING PUSH: The European Commission has announced a target for electricity to account for 46% of energy consumption across the bloc by 2040, reported Carbon Pulse. The commission has also made plans to adapt its emissions trading system to “bring relief to industry”, it said.
- FALLING OIL: The International Energy Agency said that global oil demand is expected to decline this year for the first time since 2020, reported the Associated Press.
- US ROLLBACKS: Trump cuts to clean energy support “led to the cancellation or delay of $83bn in investment across hundreds of projects”, reported Reuters. The Trump administration has also changed environmental law to allow development in the habitats of endangered species, according to CNN.
- BURNHAM BEGINS: Incoming UK prime minister Andy Burnham is preparing to announce new North Sea drilling “within days of taking office”, said Bloomberg. Carbon Brief looked at 28 statements that Burnham has made about climate change and fossil fuels.
- DRY JULY: Drought in Uganda led to significant crop losses and at least 16 deaths from starvation, said BBC News.
- ON AI: Australia planned to implement restrictions on energy and water usage for datacentres “amid [an] AI boom”, said the New York Times.
38%
The drop in Brazilian Amazon deforestation in the first half of 2026, compared to last year, reported Al Jazeera.
Latest climate research
- The area of land burned by wildfires in Africa each year has reduced due to a shrinking dry season | Geophysical Research Letters
- Most people do not distinguish between climate adaptation and mitigation when thinking about tackling climate change | Climate Outreach
- An “effort-sharing framework” has been developed to support progress towards the Paris Agreement | npj Climate Action
(For more, see Carbon Brief’s in-depth daily summaries of the top climate news stories on Monday, Tuesday, Wednesday, Thursday and Friday.)
Captured
Carbon Brief explained how more than 1,000 heat-related deaths in England and Wales during May and June were attributed to climate change, accounting for almost half of all heat-related deaths experienced during those months. The article also unpacked the different methods for estimating heat deaths around the world.
Spotlight
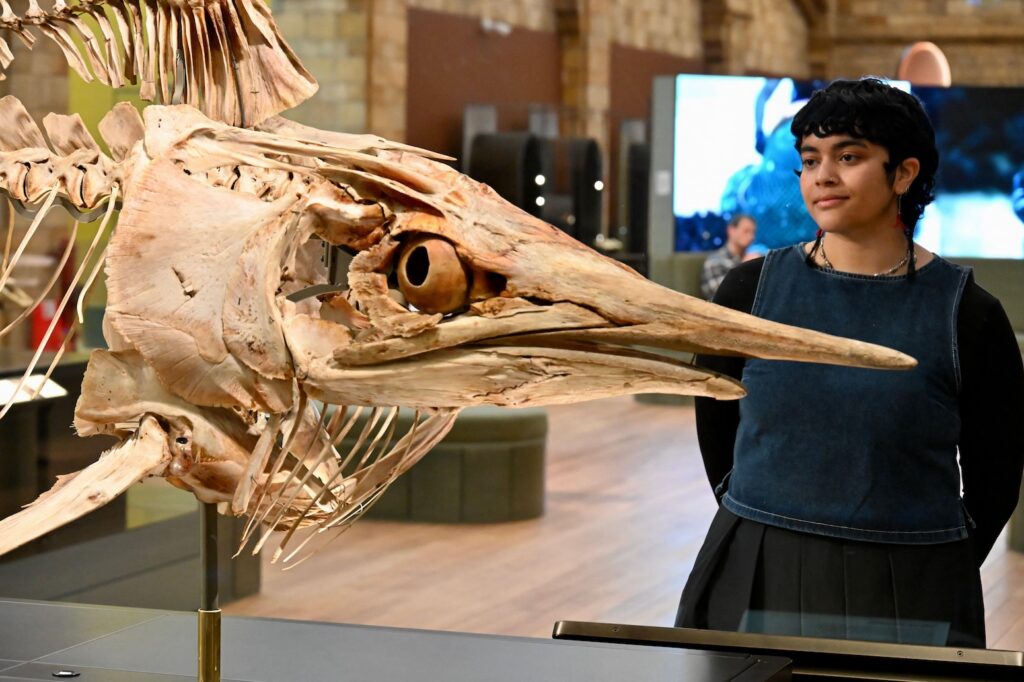
Natural History Museum exhibits climate change
This week, Carbon Brief interviews Meaghan Macdonald, senior project and programme manager for London’s Natural History Museum, about their first permanent climate-themed exhibition, Fixing Our Broken Planet.
Carbon Brief: Why are programmes such as Fixing Our Broken Planet so important?
Meaghan Macdonald: One of the main things we’re trying to achieve with Fixing Our Broken Planet is to place the museum as a convener of conversations around the planetary emergency…trying to bring together the different groups of people who need to be involved in this conversation in order to work together to find a solution.
And we find that a lot of the people who come into the gallery weren’t necessarily coming here to see it; they come across it, which is a really great way to engage people who may not have been engaged in that discussion previously.
CB: How does the exhibition engage and inspire visitors?
MM: A driving force for this exhibition is that you are dealing with a subject matter that can be quite disheartening, and one of the things that we were very careful about is to try to make sure that woven throughout the scientific data… is a sense of hope… to enable people to feel empowered to make a difference.
We were able to do things like our “what you can do” labels, which give an example that people can take away with them. We also have “conversation starters”, which is a digital screen that asks people a series of questions related to the planetary emergency. Things like: “Should we mine the deep sea to power the green economy?”…And there’s no right or wrong answer.
We [also] set out very specifically to…forefront the science that’s happening here. We know from multiple studies from thinktanks and organisations that people actually trust our scientists the most.
CB: The museum has set out a goal to “create advocates for the planet”. What does this mean? How does it relate to the exhibition and the museum’s wider climate action?
MM: The aim of the museum is to get to a place where both people and the planet thrive. Being a library of the natural world, it is our duty to be standing up for it and to help people find their way, fighting for nature’s side.
In order to create those advocates, the aim of the [exhibition] and the wider advocacy programmes at the museum is to try to find ways to bring all these people [individuals, policymakers, industry, scientists] together.
We have the wider programme with Fixing Our Broken Planet. We have Generation Hope…a free graphic panel version of our display in the gallery that we have been able to get into a number of venues in Bangalore…the very long-standing and beloved wildlife photographer of the year [exhibition]…our urban nature movement…[and] an initiative that we are doing with the Department for Education called the National Education Nature Park.
Watch, read, listen
STUBBORN HOPE: For the Conversation, climate scientist Prof Peter Stott argued that researchers need to “talk more about the very worst-case scenarios” and the possibility for action.
EXTREME: Vox’s the Gray Area podcast spoke to New York Times journalist David Wallace-Wells about the possibility of a “Godzilla” El Niño.
RESPONSIBILITY: For Climate Home News, two researchers from the Center for International Environmental Law explored how “major emitting countries knew of climate risks decades earlier than claimed”.
Coming up
- 13-31 July: Meeting of the International Seabed Authority assembly and council, Kingston, Jamaica
- 17-19 July: 3rd International Conference on Environment and Sustainable Development, London
- 19 July: Presidential election, São Tomé and Príncipe
Pick of the jobs
- Zero Carbon Analytics, research lead | Salary: Unknown. Location: Remote
- Met Office, ocean climate scientific manager | Salary: £54,515-£58,582. Location: Exeter
- National Trust, land use and nature delivery partner | Salary: £44,499. Location: Newcastle or York
DeBriefed is edited by Daisy Dunne. Please send any tips or feedback to debriefed@carbonbrief.org.
This is an online version of Carbon Brief’s weekly DeBriefed email newsletter. Subscribe for free here.
The post Debriefed 17 July 2026: UK ‘firewave’ | Fossil-fuelled heat deaths | London’s Natural History Museum spotlights climate appeared first on Carbon Brief.
Recent weeks have seen a flurry of reports from public health authorities and scientists that estimate the deaths caused by Europe’s record-breaking summer heatwaves.
In France, the national public health agency reported 2,025 excess deaths over the week where the heatwave peaked in June.
Authorities in Germany and Netherlands put the excess death toll during the same seven-day period at 5,753 and 533, respectively.
An analysis from climate scientists in Carbon Brief found that France saw more than 2,700 heat-related deaths over 17 days in June.
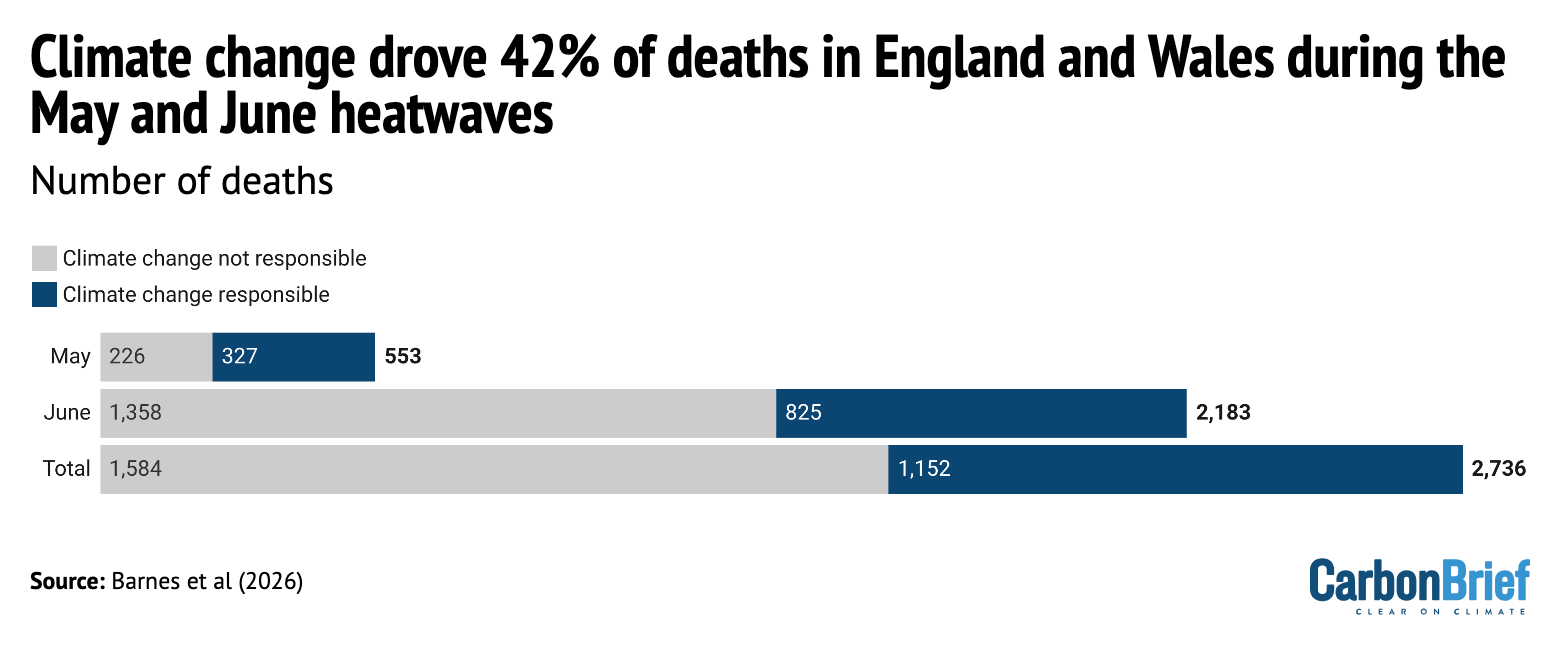
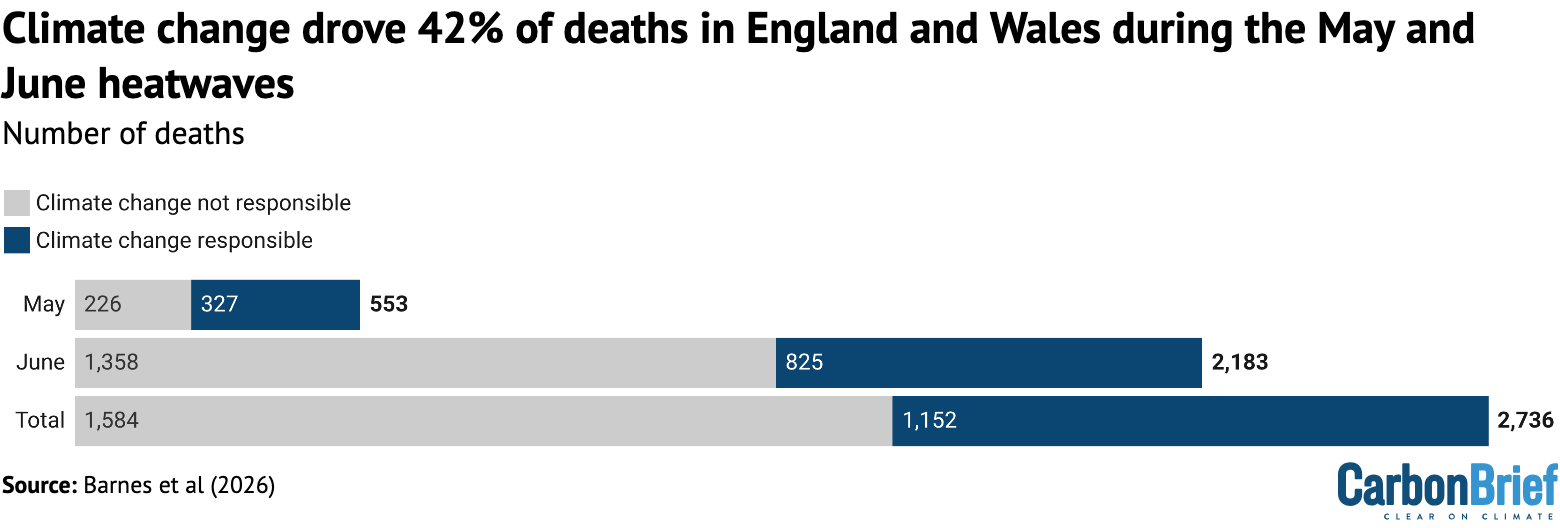
Separate research estimated there had been 2,700 heat-related deaths in the UK’s May and June heatwaves – 42% of which had been caused by human-caused climate change.
There are a number of methods for how academics and governments tally deaths caused by extreme heat, each with their own advantages and drawbacks.
Here, Carbon Brief looks at the different ways scientists and public health authorities have calculated the death toll of Europe’s record-breaking summer heat.
- How established is the science of calculating heat deaths?
- What are the different approaches to counting heat deaths?
- What do the latest figures show for Europe’s May and June heatwaves?
- What are the pros and cons of the ‘excess deaths’ method?
- What are the pros and cons of the ‘statistical modelling’ method?
How established is the science of calculating heat deaths?
Economists and epidemiologists have been studying the relationship between heat and mortality for nearly a century.
A pioneering study published in 1923 by geographer Ellsworth Huntington and economist Margaret Justin that looked at mortality data for New York City over 1882-88 found that deaths increased rapidly as temperatures rose above 17C.
As global temperatures have risen in response to human-caused carbon emissions, scientists have increasingly sought to understand how warming could impact mortality.
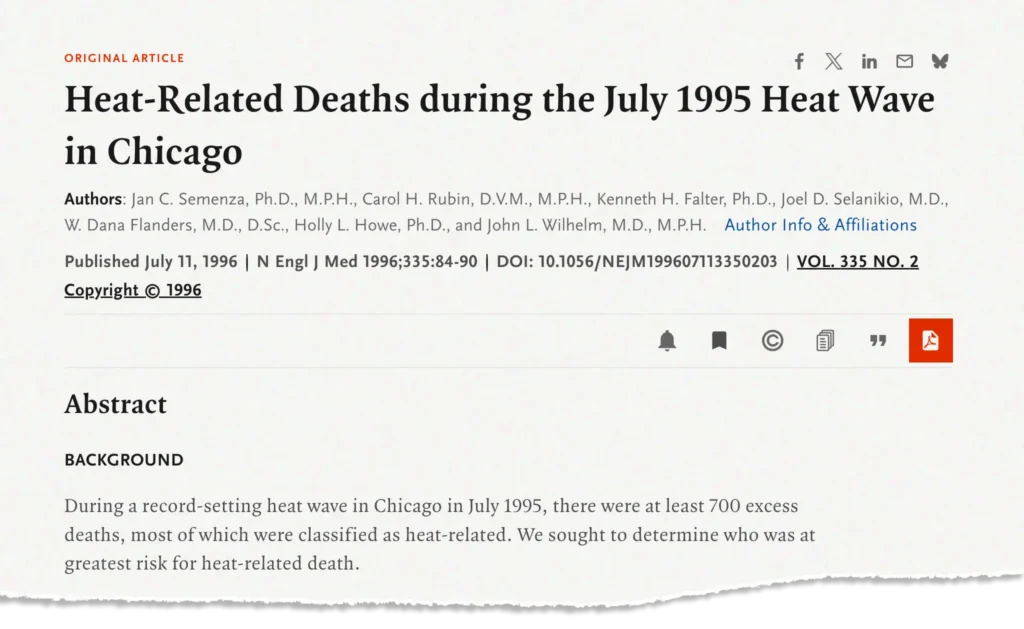
The study of mortality caused by specific heatwave events dates back a few decades, with a 1995 heatwave in Chicago among the earliest events to be studied in detail.
Over the past decade, a growing number of studies have gone a step further, by estimating the number of deaths caused by a specific heatwave event and then attributing a percentage or number of those deaths to human-caused climate change.
Carbon Brief covered the first study of this type, which was published in Environmental Research Letters in 2016 and focused on a 2003 summer heatwave that caused tens of thousands of deaths across Europe.
The study estimated that 506 of the 735 summer fatalities in Paris and 64 of the 315 in London were a result of human influence on the climate.
More recently, a study in Climatic Change found that 27% of deaths in a 2018 heatwave in Zurich, Switzerland were linked to human-caused climate change and a paper in Science Advances estimated that 11-15% of deaths in a 2021 heatwave in British Columbia were attributable to global warming.
Dr Christopher Callahan, assistant professor at the O’Neill School of Public and Environmental Affairs at Indiana University, tells Carbon Brief this type of “two-step” study has “really exploded” in recent years:
“It is really only in the last five to 10 years that we have seen this, partly because it does require interdisciplinary expertise. You need people who know how to run the epidemiological models and you need a climate analysis of the counterfactual [world] without climate change, which is its own effort.”
What are the different approaches to counting heat deaths?
A central challenge in estimating deaths from a heatwave is that heat is rarely recorded as the primary cause of death on death certificates.
However, exposure to high temperatures has wide-ranging effects on the human body, including the strain of keeping cool. This effort places pressure on the heart and kidneys.
As a result, heat extremes can worsen health risks from chronic conditions and cause acute kidney injury. Researchers have linked heat to increased mortality from respiratory and cardiovascular diseases, as well as dementia and Alzheimer’s.
As a result, public health authorities and scientists cannot depend on death certificates for a full count of heat-related deaths. They instead estimate heat deaths using a number of different approaches, each with assumptions baked into their calculations.
Dr Garyfallos Konstantinoudis, who researches methods for calculating excess mortality due to extreme events at the Grantham Institute for Climate Change and the Environment at Imperial College, tells Carbon Brief there is “no ground truth” when it comes to tallying heat-related deaths:
“We don’t know what the heat-related deaths are, so we rely on different models to describe the picture.”
This makes the study of deaths from heatwaves similar to those from air pollution, he says:
“This sort of health-impact assessment has been done for years on studies related to deaths from air pollution, which have the same problem. Air pollution, until very recently, was not recorded on death certificates.
“[However], for air pollution, the [scientific] literature is much larger, so no one questions that air pollution is toxic and kills. This sort of messaging for heat is more recent.”
There are, broadly speaking, two approaches to calculating deaths during a heatwave.
The first involves counting the number of excess deaths relative to a period in the past.
This method – often referred to as an “excess deaths” approach – looks at how many people died during a particular time period compared to a baseline period where there was no heatwave.
To do this, public health authorities and researchers rely on official death figures reported by country authorities.
The heat death tolls published in recent weeks by public health agencies in Belgium, France, Germany and the Netherlands relied on this approach.
(For more, see: What are the pros and cons of the ‘excess deaths’ method?)
The second method uses long-term mortality data to understand the statistical relationship between temperature and mortality in a given place. The model that emerges can be used to infer the number of deaths from a heatwave in that place.
In a rapid analysis published this week, researchers at Imperial College London, the London School of Hygiene and Tropical Medicine (LSHTM) and the Met Office used this approach to estimate that the May and June heatwaves in the UK caused the deaths of 2,700 people.
Dr Callahan – working with Prof Andrew Dessler, director of the Texas Center for Extreme Weather at Texas A&M University – used this method to estimate that more than 2,700 people had died in France over a 17-day period in June in an analysis for Carbon Brief.
(For more: see: What are the pros and cons of the ‘statistical modelling’ method?)
The majority of the figures released in the wake of Europe’s June heatwave have relied on these two methods.
There is a third way to calculate heat deaths, which is to look at official counts of deaths attributed on death certificates to heatstroke.
Callahan tells Carbon Brief that the “death-certificate coding” appears to have fallen out of favour in Europe – which he says is a “smart move” given that it does not provide a “full accounting”.
Nevertheless, some public health authorities are still using this method. For example, in the wake of the heatwave in the US earlier this month, public health data showed 29 people in New Jersey and three people in New York had died from “heat-related illnesses”.
Scientists tell Carbon Brief the excess deaths and statistical modelling approaches both have advantages and drawbacks. These are explored below.
What do the latest figures show for Europe’s May and June heatwaves?
The table below shows the death numbers that have been reported by governments and researchers for Europe’s May and June heatwaves, including the approach used to reach the figures.
It suggests that multiple countries in Europe experienced more than 1,000 heat-related deaths during the late June heatwave, with authorities in Germany counting more than 5,000.
Meanwhile, the EuroMoMo mortality monitoring system estimated there were more than 10,500 excess deaths across 27 countries during the June heatwave.
| Reported | Source | Country / region | Dates | Days | Deaths | Link | Approach |
|---|---|---|---|---|---|---|---|
| 28/06/2026 | Public Health France | France | 22-27 June | 6 | 1,000 | santepubliquefrance.fr | Excess deaths |
| 29/06/2026 | World Health Organization | Europe | 21-28 June | 8 | 1,300 | x.com/DrTedros/status | Excess deaths |
| 01/07/2026 | Carlos III Health Institute (MoMo) | Spain | 1-30 June | 30 | 1,033 | dw.com | Excess deaths (all-cause and temperature-attributable) |
| 02/07/2026 | National Institute for Public Health and the Environment | Netherlands | 22-28 June | 7 | 480 | rivm.nl | Excess deaths |
| 03/07/2026 | Public Health France | France | 22-28 June | 7 | 2,025 | santepubliquefrance.fr | Excess deaths |
| 07/07/2026 | Chris Callahan/Andrew Dessler | France | 12-29 June | 18 | 2,766 | carbonbrief.org | Statistical modelling |
| 08/07/2026 | Chris Callahan | Europe | 15-28 June | 14 | 13,975 | zenodo.org | Statistical modelling |
| 08/07/2026 | Sciensano | Belgium | 18 June – 1 July | 14 | 1,747 | brusselstimes.com | Excess deaths |
| 09/07/2026 | Robert Koch Institute | Germany | 22-28 June | 7 | 5,120 | rki.de | Statistical modelling |
| 13/07/2026 | Met Office/LSHTM/Imperial | England and Wales | 22-27 June | 6 | 2,183 | drive.google.com | Statistical modelling |
| 13/07/2026 | Met Office/LSHTM/Imperial | England and Wales | 24-26 May | 3 | 553 | drive.google.com | Statistical modelling |
| 13/07/2026 | EURO Mo/Mo | 27 European countries | 22-28 June | 7 | 10,650 | reuters.com | Excess deaths |
| 07/07/2025 | National Institute for Public Health and the Environment | Netherlands | 22-28 June | 7 | 577 | archive.ph | Excess deaths |
| 14/07/2026 | Germany Federal Statistical Office (Destatis) | Germany | 22-28 June | 7 | 5,753 | destatis.de | Excess deaths |
In most instances, Carbon Brief has linked to the figures published by public health authorities, where numbers were first reported. In some instances, figures were released on dashboards or webpages that are updated weekly. In these cases, Carbon Brief has linked to media reports or archived web content.
What are the pros and cons of the ‘excess deaths’ method?
The excess deaths approach looks at how many more people died during a particular time period compared to a baseline period of the same length.
For instance, on 14 July, Germany’s federal statistics agency, Destatis, published figures showing Germany saw 32% more deaths than the average in the week of 22-28 June, which was dominated by the heatwave.
Specifically, the agency said that 23,932 deaths had been recorded that week, compared to an average of 18,179 in that calendar week across the years 2022-25.
This suggests there were 5,753 excess deaths during the heatwave week. (This was a slight increase from preliminary Destatis figures released a week earlier, covered by Bloomberg.)
The Netherlands similarly calculates excess deaths by comparing death figures against an average of deaths in a similar period during unspecified “previous years”.
Data published by the country’s National Institute for Public Health and the Environment (RIVM) shows that, during the week of 22-28 June, an estimated 3,626 people died in total in the northern European country.
This is 577 more deaths than the 3,049 expected at that time of year, it said. (This is a slight revision upwards from the 480 excess deaths reported on 4 July by NL Times based on preliminary figures from NVIM.)
Callahan says that the excess deaths approach has the benefit of being rapid and relatively uncomplicated:
“It is something that public health authorities can put out fairly quickly without having to run a fancy model and do coding like the academic scientists do. It is a short-term, high-impact, rapid estimate of mortality.”
The drawback to the approach is that it is impossible to decipher what percentage of these “all-mortality” excess deaths are, in fact, heat-related.
Imperial College’s Konstantinoudis notes that the public often “feels more comfortable” with the excess deaths approach over the statistical modelling approach because the data it is using – the official death numbers – is based on real-world data.
However, he stresses that excess deaths figures are based on a series of assumptions, including the reference period picked by researchers and how the numbers are interpreted.
Statisticians and researchers have to make a series of decisions, including what period to use as a comparative baseline. For example, the baseline period could be the week before a heatwave, the same week a year before – or an average of the same week across multiple years in the past. If averaging mortality of a similar period across a number of previous years, they must decide how much “weight”, or influence, each year should have.
They must also decide how to account for spikes in deaths during the Covid-19 pandemic years, as well as the gradual rise in average temperatures due to global warming.
During the pandemic, many governments and the World Health Organization (WHO) used the excess deaths approach to count deaths. The WHO said this metric was more “comparable” and “objective” than relying on national reports of Covid-19 deaths, given that different countries used different criteria for this classification.
A notable example of how assumptions can skew excess death figures came during this period, when the WHO estimated in 2022 that Germany had seen 195,000 excess deaths over two years of pandemic.
However, after statisticians and epidemiologists pointed out the assumptions in the model were not suited to Germany’s demographics, the WHO retracted the figure and eventually reduced it to 122,000 and then later to 102,000.
Konstantinoudis explains:
“Covid taught us that it is complicated. Depending on the different assumptions used in the excess-mortality approach, you get different results…There is a scientific basis, but we should acknowledge the assumptions.”
What are the pros and cons of the ‘statistical modelling’ method?
In the statistical modelling approach, researchers use models to determine the specific relationship between mortality and temperature for a particular location and then apply it to temperatures observed during a heatwave.
This allows them to estimate the overall number of deaths that were caused by a heatwave.
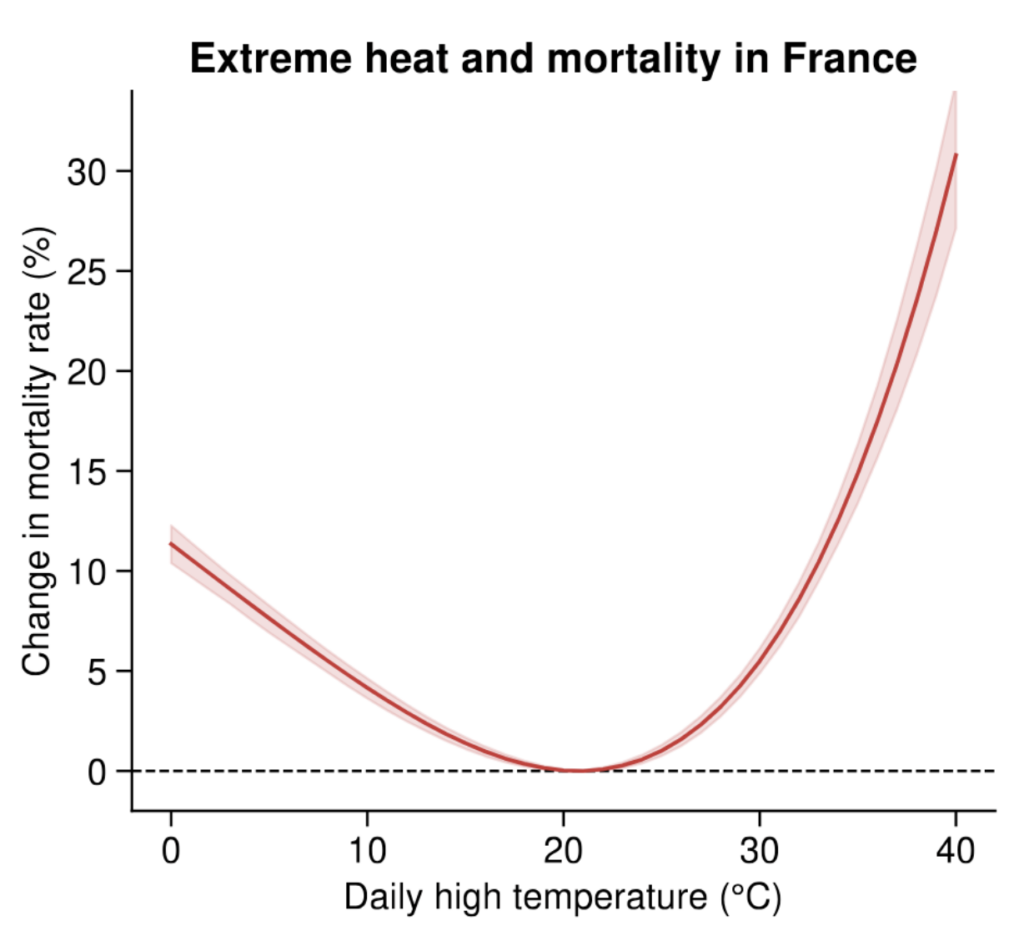
Previous research has revealed that, in most places of the world, there is a U-shaped response of mortality to temperature – where deaths increase rapidly in cold or hot conditions as daily maximum temperatures depart further from an “optimum temperature”.
For example, research published in Proceedings of the National Academy of Sciences in 2025 found that mortality rates in France rise as daily maximum temperatures move away from approximately 20C. This is shown in the chart below.
Indiana University’s Callahan say this approach allows scientists to “formally establish a relationship between the temperature and the mortality”, adding:
“If you do these calculations right, you can credibly say your entire estimate of mortality is heat-related.”
Prof Antonio Gasparrini, biostatistician and epidemiologist at LSHTM, explains the method relies on “timeseries models that apply relatively sophisticated statistical methods in which you ‘smooth’ trends occurring in time, so you control for long-term trends and seasonality”.
He says that these models also allow researchers to “remove” trends affecting mortality that are unrelated to heat – for instance, the impacts of the pandemic. They can also “add” other information, such as around how air pollution combines with heat to threaten vulnerable populations.
Gasparrini adds:
“What statistical modelling can bring is that it is more refined. It can link specific temperatures to specific impacts rather than just looking at the event [in the whole]. And also, it can be localised – [data] can be stratified at a fine scale and we can look at impacts at different scales.
“So, it is more informative. But, at the same time, of course, it’s based on more assumptions than the [excess deaths approach] and, of course, needs to be checked and compared.”
The approach depends on a number of judgment calls from scientists and statisticians, including the years picked to underpin the model and how to capture the lag in deaths in the days and weeks after a heatwave event.
They must also decide at what threshold to start counting deaths – in other words, whether to count all deaths above the “optimum temperature” or set a higher, more extreme value – and whether and how to account for any adaptation to heat extremes that may have been put in place in the study area.
A benefit of the statistical modelling approach is that it opens the door for being able to attribute a specific number of deaths to human-caused climate change.
By applying the temperature-mortality curve to both the temperatures of the recent heatwave and a counterfactual world without climate change, scientists can estimate what proportion of estimated deaths only occurred because the world is warming.
For instance, Imperial College, LSHTM and Met Office researchers found that 59% and 38% of heat-related deaths in the UK’s May and June heatwaves, respectively, could be attributed to climate change. Their findings are shown in the chart below.
Some climate-sceptic commentators have argued that modelled estimates are hypotheses and should therefore be treated with caution.
On 13 July, climate-sceptic news website GB News covered a blog post by Oxford academics that argued the figure that 2,700 people had died in the UK’s May and June heatwaves was not reflected in the provisional “all-mortality” data put out by the UK’s Office for National Statistics (ONS). Quoting the blog, GB News said:
“Modelling tells us nothing. Models explore possibilities; surveillance tells us what happened. When the two disagree, our instinct should be to investigate the data rather than simply trust the model.”
However, Imperial’s Konstantinoudis – who worked on the models behind the 2,700 figure – says it is important to await the UK Health and Security Agency (UKHSA)’s annual heat mortality report before arriving at any conclusions. He explains:
“While we are entirely clear that our current findings are modelled estimates, this methodology has consistently delivered comparable results to the UKHSA’s own official analyses of observed deaths for past heat events.”
(The UKHSA report will include updated figures and estimate excess deaths from heat based on specific periods of heat in different regions, whereas the provisional ONS figures cover all national deaths during a full-week period.)
Konstantinoudis says both the excess deaths and statistical modelling approaches have been the subject of extensive peer-reviewed scientific study and can provide a “holistic view of what is happening” when used together.
Studies that have compared statistical modelling approaches for estimating heatwave deaths with excess death figures in the UK have found they yield broadly similar results.


The post Q&A: Europe’s May and June heatwave deaths – and how they were counted appeared first on Carbon Brief.
Q&A: Europe’s May and June heatwave deaths – and how they were counted


-
Greenhouse Gases11 months ago
Guest post: Why China is still building new coal – and when it might stop
-
Climate Change11 months ago
Guest post: Why China is still building new coal – and when it might stop
-

 Greenhouse Gases2 years ago
嘉宾来稿:满足中国增长的用电需求 光伏加储能“比新建煤电更实惠”
-

 Climate Change2 years ago
嘉宾来稿:满足中国增长的用电需求 光伏加储能“比新建煤电更实惠”
-
Climate Change2 years ago
Bill Discounting Climate Change in Florida’s Energy Policy Awaits DeSantis’ Approval
-

 Renewable Energy9 months ago
Sending Progressive Philanthropist George Soros to Prison?
-

 Carbon Footprint2 years ago
US SEC’s Climate Disclosure Rules Spur Renewed Interest in Carbon Credits
-
Greenhouse Gases1 year ago
嘉宾来稿:探究火山喷发如何影响气候预测