

England will soon introduce one of the world’s most ambitious biodiversity policies in “Biodiversity Net Gain”.
This policy effectively mandates that any new development leaves biodiversity in a better state than before it was constructed. It was initially meant to go into effect in November, but the government has pushed back its implementation until 2024.
In order to understand the potential impacts of the Biodiversity Net Gain, our team has been tracking development projects approved over the last three years in six councils across England that were early adopters of the policy.
Our latest paper, published this month, reveals several fundamental challenges that threaten the integrity of the policy’s environmental and economic outcomes.
We find that the oversight, monitoring and enforcement of biodiversity improvements supposedly delivered under the policy need urgent attention.
For example, there is a clear “governance gap”, where the system for monitoring biodiversity gains delivered on the site of new developments is weaker than for gains purchased from elsewhere. The process is overseen by local planning departments, which are typically lacking in capacity and ecological expertise.
Biodiversity Net Gain is an essential pillar of the country’s plans for attracting private finance into nature conservation to achieve its overarching environmental objectives.
Ultimately, the challenges we identify threaten the integrity of one of England’s most important environmental markets – and with it, the environmental outcomes of the government’s nature markets strategy.
Biodiversity Net Gain
Under the Biodiversity Net Gain policy, developers have three ways to offset their “biodiversity liability” – the damage their project does to nature. Biodiversity Net Gain applies to most developments, such as housing and smaller infrastructure projects. The policy will apply to major infrastructure projects from 2025 onwards.
First, they can enhance biodiversity somewhere within the development – so-called “on-site” gains. These on-site gains can take the form of, for example, sowing wildflowers along road verges or managing some of the grassland within a housing development to promote wildlife, rather than for traditional landscaping.
If developers can’t meet their liabilities on-site, their second option is to use biodiversity “units” from ecological improvements elsewhere. Under the policy, these units are supposed to mirror the habitat that is impacted by the development, so that when developers damage habitats, they must replace them with habitats that are at least as valuable, from a conservation perspective, as those lost.
Some of these units might come from the new “net-gain market”. Land managers create these units by implementing conservation actions on their land, such as converting low-productivity pasture into a field managed for wildflowers. Then, they sell these units to developers.
Alternatively, some developers are developing their own habitat banks, creating biodiversity units in one place to offset the impacts of their developments elsewhere.
Last, if no units are available through either of these pathways, developers can buy “statutory biodiversity credits” directly from the national government.
These credits loosely resemble the units sold via the market. The government holds a stock of these units as a last resort for developers who cannot offset their damage in other ways. For example, they may offset damage to particularly rare types of habitat for which there may not be suitable credits available on the standard market.
Importantly, the price levels for these statutory units have been set deliberately high, in an attempt to disincentivise developers from relying on these credits.
The ‘governance gap’
Our dataset spans around 1,600 hectares of development footprint that have been submitted or approved for development over the last three years in these six early-adopter councils: West and South Oxfordshire, Vale of White Horse, Cornwall, Leeds City and Tunbridge Wells.

Our team has been collating and analysing the biodiversity assessments submitted to these authorities for each project.
We’ve analysed the trades occurring under the policy and the rules that govern them. Additionally, we have quantified any errors embedded in the developers’ biodiversity assessments. Our research has identified several shortfalls that need addressing for this nature market to be able to deliver on its goals.
Our first key finding is that around one-quarter of all the biodiversity units delivered under the policy so far fall within a “governance gap” – meaning that they are likely to go unmonitored, and may even be legally unenforceable.
As a result, there is a very high probability that regulators will not be able to take any action if these promised gains are not delivered.
This will likely translate into a large chunk of these units not materialising in reality, as there is little incentive for developers to deliver these units in full if there is no credible enforcement mechanism.
The problem is that the standards and regulations of the three offset pathways vary considerably.
There is reasonably stringent governance to ensure that biodiversity units purchased on the offsetting market are delivered in reality. Sellers will have to submit their offsets to a national database, monitor biodiversity changes and report on the ecological development of the site at regular intervals.
Contrary to these standards, the system for monitoring, reporting and enforcing units delivered “on-site” is much weaker. The government has suggested that the existing planning enforcement system can be used to oversee on-site units.
The planning enforcement system was never designed for such a task, and in its current form, is unsuitable for fulfilling this role.
Under the current system, local authorities are explicitly advised to only take enforcement action, such as warnings or fines, if a developer’s violation of a planning condition results in “serious harm to a local public amenity”. Although it is unclear how this will apply to the Biodiversity Net Gain policy, the failure to deliver a habitat that a developer promised in a planning application a few years prior is extremely unlikely to trigger this threshold.
Developers also do not have to log their on-site gains on the national Biodiversity Net Gain register, which means that many of these projects are likely to go unmonitored. Even if they underperform relative to the original promise in the planning application, there is no credible system in place to hold developers to account for such non-delivery.
Risk of non-delivery
In our research, we have found that around one-quarter of all the units delivered under the policy are at a high risk of non-delivery because of this governance gap.
While the regulation of a specific kind of biodiversity unit within a single policy might sound unimportant, this actually has serious implications for how England’s nature markets function.
The core pillar of England’s ambitions for drawing private finance into nature conservation is the Biodiversity Net Gain market. Any biodiversity units that are delivered on-site by developers are units they will not need to purchase from the off-site market. So the less stringent the standards in the on-site system, the more this will drain demand for units from the off-site market, which is relatively more ecologically robust.
Although we recognise our data is preliminary, we estimate that if these under-regulated biodiversity units were to be delivered via the off-site market instead, the demand for biodiversity units could rise by a factor of four.
This could significantly increase the amount of conservation implemented on private land and, therefore, the amount of private finance flowing into conservation projects on private land.

There is precedent for this. The English scheme was partially informed by the US wetland mitigation markets. In 2008, those markets underwent reform to address a similar governance gap.
In the US case, the standards applied to developer-led and third-party projects diverged enormously, meaning a range of low-quality mitigation projects were being implemented by developers. The 2008 compensation rule in the US wetland mitigation system addressed this disparity by ensuring that the same standards were applied across all forms of compensation.
Lacking capacity
Our research also reveals other interesting, consequential patterns. Perhaps the most important to the integrity of this emerging market is the current lack of capacity in local authorities to be able to deliver on the Biodiversity Net Gain policy.
Local authorities do the best they can with the resources they have, but they have undergone stringent funding cuts since 2008.
At the last count, around 60% of local planning authorities have no in-house ecological expertise – which is essential for delivering biodiversity gains effectively.
In our study, we evaluated how many of the applications contained a basic error in their calculations: we checked to see if the area of the site before and after development added up to the same amount.
We found that the areas did not add up in around one-fifth of all projects. Of these, around half had already been accepted by the local planning authorities. One explanation for this oversight could be that planners were so rushed they did not have time to examine the calculations included with the application.
This suggests we have not yet addressed the serious capacity shortages in the councils – who are ultimately going to be the public bodies overseeing the delivery of Biodiversity Net Gain at local scales. This is clear evidence that further investment in local planning capacity is required.
Environmental markets have the potential to be powerful mechanisms for improving nature, but one of the fundamental features of biodiversity compensation markets is that they deliver biodiversity gains that make up for an equal and opposite loss elsewhere.
This means that every biodiversity unit that is promised by developers in order to secure planning permission, but then not delivered in reality, has legitimised the loss of biodiversity elsewhere.
Making sure that these policies lead to direct, robust gains in the quality of nature is therefore absolutely essential to ensure that the markets-focused approach to drawing private finance into nature recovery in England leaves the environment better, rather than worse, off.


The post Guest post: Fixing the gaps in England’s ‘biodiversity net-gain’ policy appeared first on Carbon Brief.
Guest post: Fixing the gaps in England’s ‘biodiversity net-gain’ policy

The United Nations has said the world must cut greenhouse gas emissions by nearly 6% per year to limit global warming enough to be able to return to the 1.5C goal by 2100, as decades of insufficient climate action have now made an overshoot inevitable.
In a video message accompanying the UN Environment Programme’s (UNEP) 2026 Emissions Gap Report, UN Secretary-General António Guterres said the world could no longer avoid overshooting the 1.5C limit and that the consequences were already devastating. However, he said it was still possible to return average global temperatures to 1.5C above preindustrial times by the end of the century.
“Overshoot is not surrender,” he said, adding that the report, released on Wednesday, sets out what is needed to limit warming. That entails cutting global greenhouse gas emissions by 18% by 2030, 45% by 2035 and 69% by 2040, all compared with 2025 levels.
This implies average annual reduction rates of 5.7% for 2025-2035, higher than the pathways laid out by the Intergovernmental Panel on Climate Change in its last major scientific report, which required annual reduction rates of about 5%, UNEP said.
Paris Agreement committee names three countries snubbing it over NDCs
The more ambitious emissions reductions – which countries are still far off achieving – would put the world on the lowest-possible overshoot pathway, giving a 50% chance of limiting peak warming to 1.7–1.8C around mid-century before bringing global temperatures back to 1.5C or below by 2100, the report said. Reaching this scenario will also require carbon removal from the atmosphere, it added.
UNEP noted that if countries fully implement their current national climate plans (NDCs), they would only reduce emissions by 5-8% by 2030 and 11-15% by 2035, relative to 2025 levels.
UNEP Executive Director Inger Andersen said the world must not give up on the Paris Agreement’s most ambitious warming limit, adding that every additional fraction of a degree and additional year of heating above 1.5C increases climate change impacts and risks, such as the deadly floods, heatwaves and wildfires that have plagued many nations this year.
“We must pull out all the stops to minimise peak warming and return to 1.5C by the end of the century. This is possible,” she said, adding that governments must urgently implement policies that deliver rapid and sustained emissions reductions.
Climate pledges fall short
New climate pledges since last year’s report have made a negligible difference to projected emissions and warming, UNEP said. Under current policies, the world is on course for 2.8C of warming this century, while full implementation of national climate pledges and continued similar efforts would limit warming to 2.6C, the report found.
UNEP said its projections had deteriorated, attributing this to the withdrawal of the United States from the Paris Agreement under President Donald Trump and revised estimates of historical emissions.
Even with the most optimistic pledge-based scenario – which assumes countries deliver both their current national climate commitments and additional net-zero targets – warming would now only be limited to 2.1C this century, the report found.
IPCC scientists vow to press on with climate reports despite political deadlock
Speaking to journalists ahead of the report’s launch, co-author Anne Ohlhoff said the US exit from the Paris accord meant that its previous national climate target was no longer included in UNEP’s global projections. The country has also dropped its net-zero emissions goal, she said, affecting the outlook because the US is the world’s second-largest emitter.
She warned that there is still a large gap between countries’ emissions commitments for 2035 and the reductions needed under the report’s lowest-possible 1.5C overshoot scenario.
Every five years of carbon dioxide (CO₂) emissions at current levels pushes peak warming up by around 0.1C, she said, adding that without urgent action, it could quickly become impossible to keep peak warming below 1.7–1.8C.
Describing the emissions gap as a “leadership gap”, UN chief Guterres warned that current national climate plans and policies “fall dangerously short” of what is needed to limit warming. He urged countries to adopt credible roadmaps for transitioning away from fossil fuels, accelerate clean energy deployment and electrification, invest in electricity grids and storage, cut methane emissions and halt deforestation.
Carbon removal needed, but risky
Alongside deep emissions cuts, removal of CO₂ from the atmosphere needs to be accelerated throughout the century, the report found. The world will need to remove and permanently store about 320 billion tonnes of CO₂ from the atmosphere to return global temperatures to around 1.5C by 2100.
The estimated carbon removal is equivalent to around eight years of global CO₂ emissions at 2024 levels. However, UNEP cautions that removing carbon at this scale remains uncertain because of technological and socio-economic challenges.
Keywan Riahi, a contributor to the report, said carbon could be removed through nature-based approaches, such as planting forests and improving wetland management, which help ecosystems absorb carbon emissions, as well as engineering solutions that capture emissions from energy production or remove carbon directly from the air.
However, he warned that both nature-based and technological approaches face risks and might not deliver carbon removal at the scale needed. This is because nature solutions such as planetary sinks are weakening because of climate change while techno-fixes remain uncertain, he added.
“All of those technologies come with risks,” Riahi told reporters, adding that what the world needs is to try “to keep the overshoot as low as possible, so that we do not need to rely on these technologies to take CO₂ out of the atmosphere later on”.
Renewable energy supports emissions cuts
Despite the expected overshoot of the 1.5C warming limit, the UNEP Emissions Gap Report underscored that the rapid growth of renewable energy and the impact of climate policies so far show that deeper emissions cuts remain possible.
It stated that since the adoption of the Paris Agreement in 2015, global renewable electricity capacity has grown three times faster than anticipated, while solar photovoltaic (PV) deployment has increased sevenfold compared with projections made a decade ago.
Maintaining the recent pace of renewable energy expansion, alongside stronger policies, could put the world on track to meet the global goal of tripling renewable energy capacity by 2030, the report said. It could also increase the share of wind and solar in electricity generation to levels consistent with the pathway that limits the overshoot of 1.5C to the lowest possible level, it added.
SE Asia speeds up plan for connected clean power grid after oil shock
Andersen said the explosion of renewable energy and slower-than-projected growth in coal energy supply showed that accelerating climate action is possible. However, she warned that progress remains insufficient, particularly in phasing down fossil fuels and halting forest loss.
“Nations must understand that the point of return begins now, not later,” she said, calling for “fast, deep and sustained emissions reductions”. She urged governments to strengthen their climate action at upcoming UN climate talks and accelerate efforts to keep the 1.5C pathway within reach.
Bill Hare, chief executive of Climate Analytics, said major fossil fuel-producing countries need to take greater responsibility for reducing their emissions, saying that big polluters such as the US and Saudi Arabia need “to stop playing politics and face the scientific reality”.
“Right now they are looking at the fire, denying it exists and pouring more petrol on it, while their own citizens increasingly face searing heat, wildfires and other impacts,” he said. “Governments [need] to get on with enacting policies that cut fossil fuel use as soon as possible.”
The post UN sets steep emission cuts to reverse 1.5C overshoot by end of century appeared first on Climate Home News.
UN sets steep emission cuts to reverse 1.5C overshoot by end of century
When the Turkish COP31 presidency presented its priorities to international business leaders for the first time in New York in September, among those invited to give the private sector’s first response was Ali Koç, scion of one of Türkiye’s wealthiest families.
On stage, the vice chair of the board of Koç Holding said the family company, which weeks earlier had been announced as one of the top sponsors for the UN climate summit, can be seen as “quite exemplary” for its climate record.
What Koç did not mention was that the group’s biggest money-making arm – Türkiye’s largest oil refiner Tüpraş – plans to keep running its refineries “at maximum potential”. Nor did he say that, in 2025, both parent company and subsidiary cut their 2030 climate targets to a level they had already nearly achieved, as Climate Home News’ analysis of company records reveals.
The decision to hand Koç Holding a prominent role at COP31 – the company is also the summit’s “Global Business Partner” – has reignited a long-running controversy over the platforming of fossil fuel interests at the annual UN climate conference.
It has also thrown into question how COP sponsors are chosen and screened. The hosting agreement between the Turkish government and the UN climate secretariat (UNFCCC) says that a partner company’s “climate integrity” should be taken into account.
COP31 electrification pledge leaves out clean power commitment
But how that test is applied is unclear and the process for picking sponsors remains largely opaque. The Turkish COP31 presidency has not published its selection criteria, nor the financial terms of any of its partnership agreements, including Koç’s. The UNFCCC declined to clarify how it advises on such deals.
Campaigners have long argued that accepting sponsorship from polluting companies is wrong because it gives them a global stage, visibility and access to policymakers at talks that are meant to move the world away from fossil fuels, and tarnishes the reputation of the COPs.
Koç’s energy division, which is dominated by oil refiner Tüpraş, accounted for three-quarters of the parent firm’s income in the first half of 2026.
“How was Koç Holding ever chosen as a COP31 sponsor? Any corporation that makes most of its money from oil refining should not qualify as sustainable,” said Pascoe Sabido, a campaigner at Corporate Europe Observatory, which exposes company lobbying. “This is hugely embarrassing for the UNFCCC and its climate integrity check, which doesn’t appear to be worth the paper it’s written on.”
Koç Holding “is not just standing still but walking backwards”, he told Climate Home News.
Koç Holding and Tüpraş did not reply to multiple requests for comment. The UNFCCC secretariat and the Turkish COP31 presidency declined to respond to questions from Climate Home News on the sponsorship agreement.
Oil refining windfall
Türkiye’s biggest industrial group, Koç Holding has stakes in several key sectors of the economy, spanning vehicle manufacturing in a joint venture with Ford to electronics, home appliances and banking.
But the conglomerate’s crown jewel is oil refiner Tüpraş, which Koç controls. Last year its four refineries turned crude oil into 26.8 million tonnes of petrol, diesel, jet fuel and other products, enough to fill about 36 Olympic swimming pools every day.
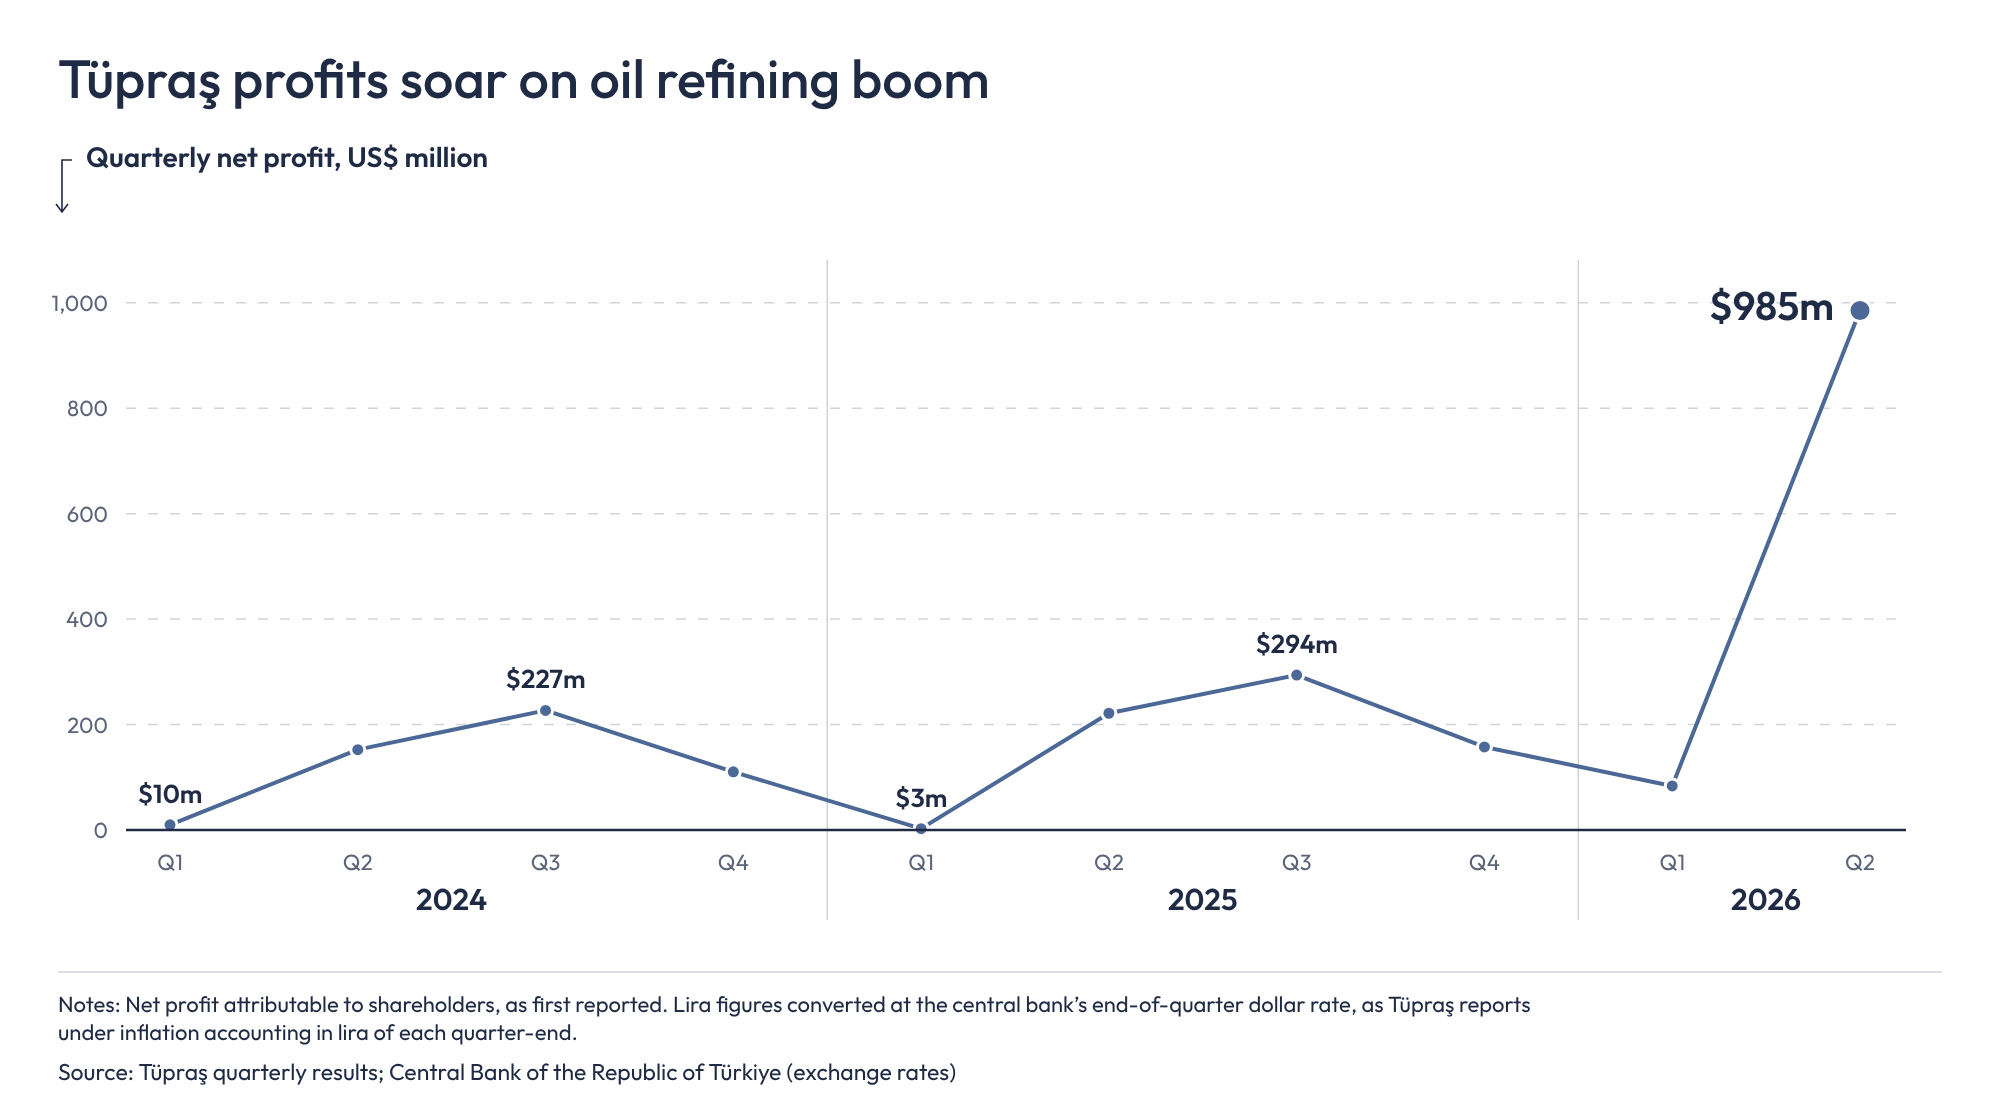
The company plans to raise its production to 29 million tonnes in 2026 – already a bumper year so far with soaring profits, thanks to sky-rocketing refining margins driven by a crunch in global oil processing capacity caused by the Middle East crisis.
The oil business boom sits awkwardly with the climate and energy transition plans Koç and Tüpraş unveiled in 2021, when both pledged to become carbon neutral by 2050. Then, Tüpraş set out its aim to become “a leading carbon-neutral energy company”.
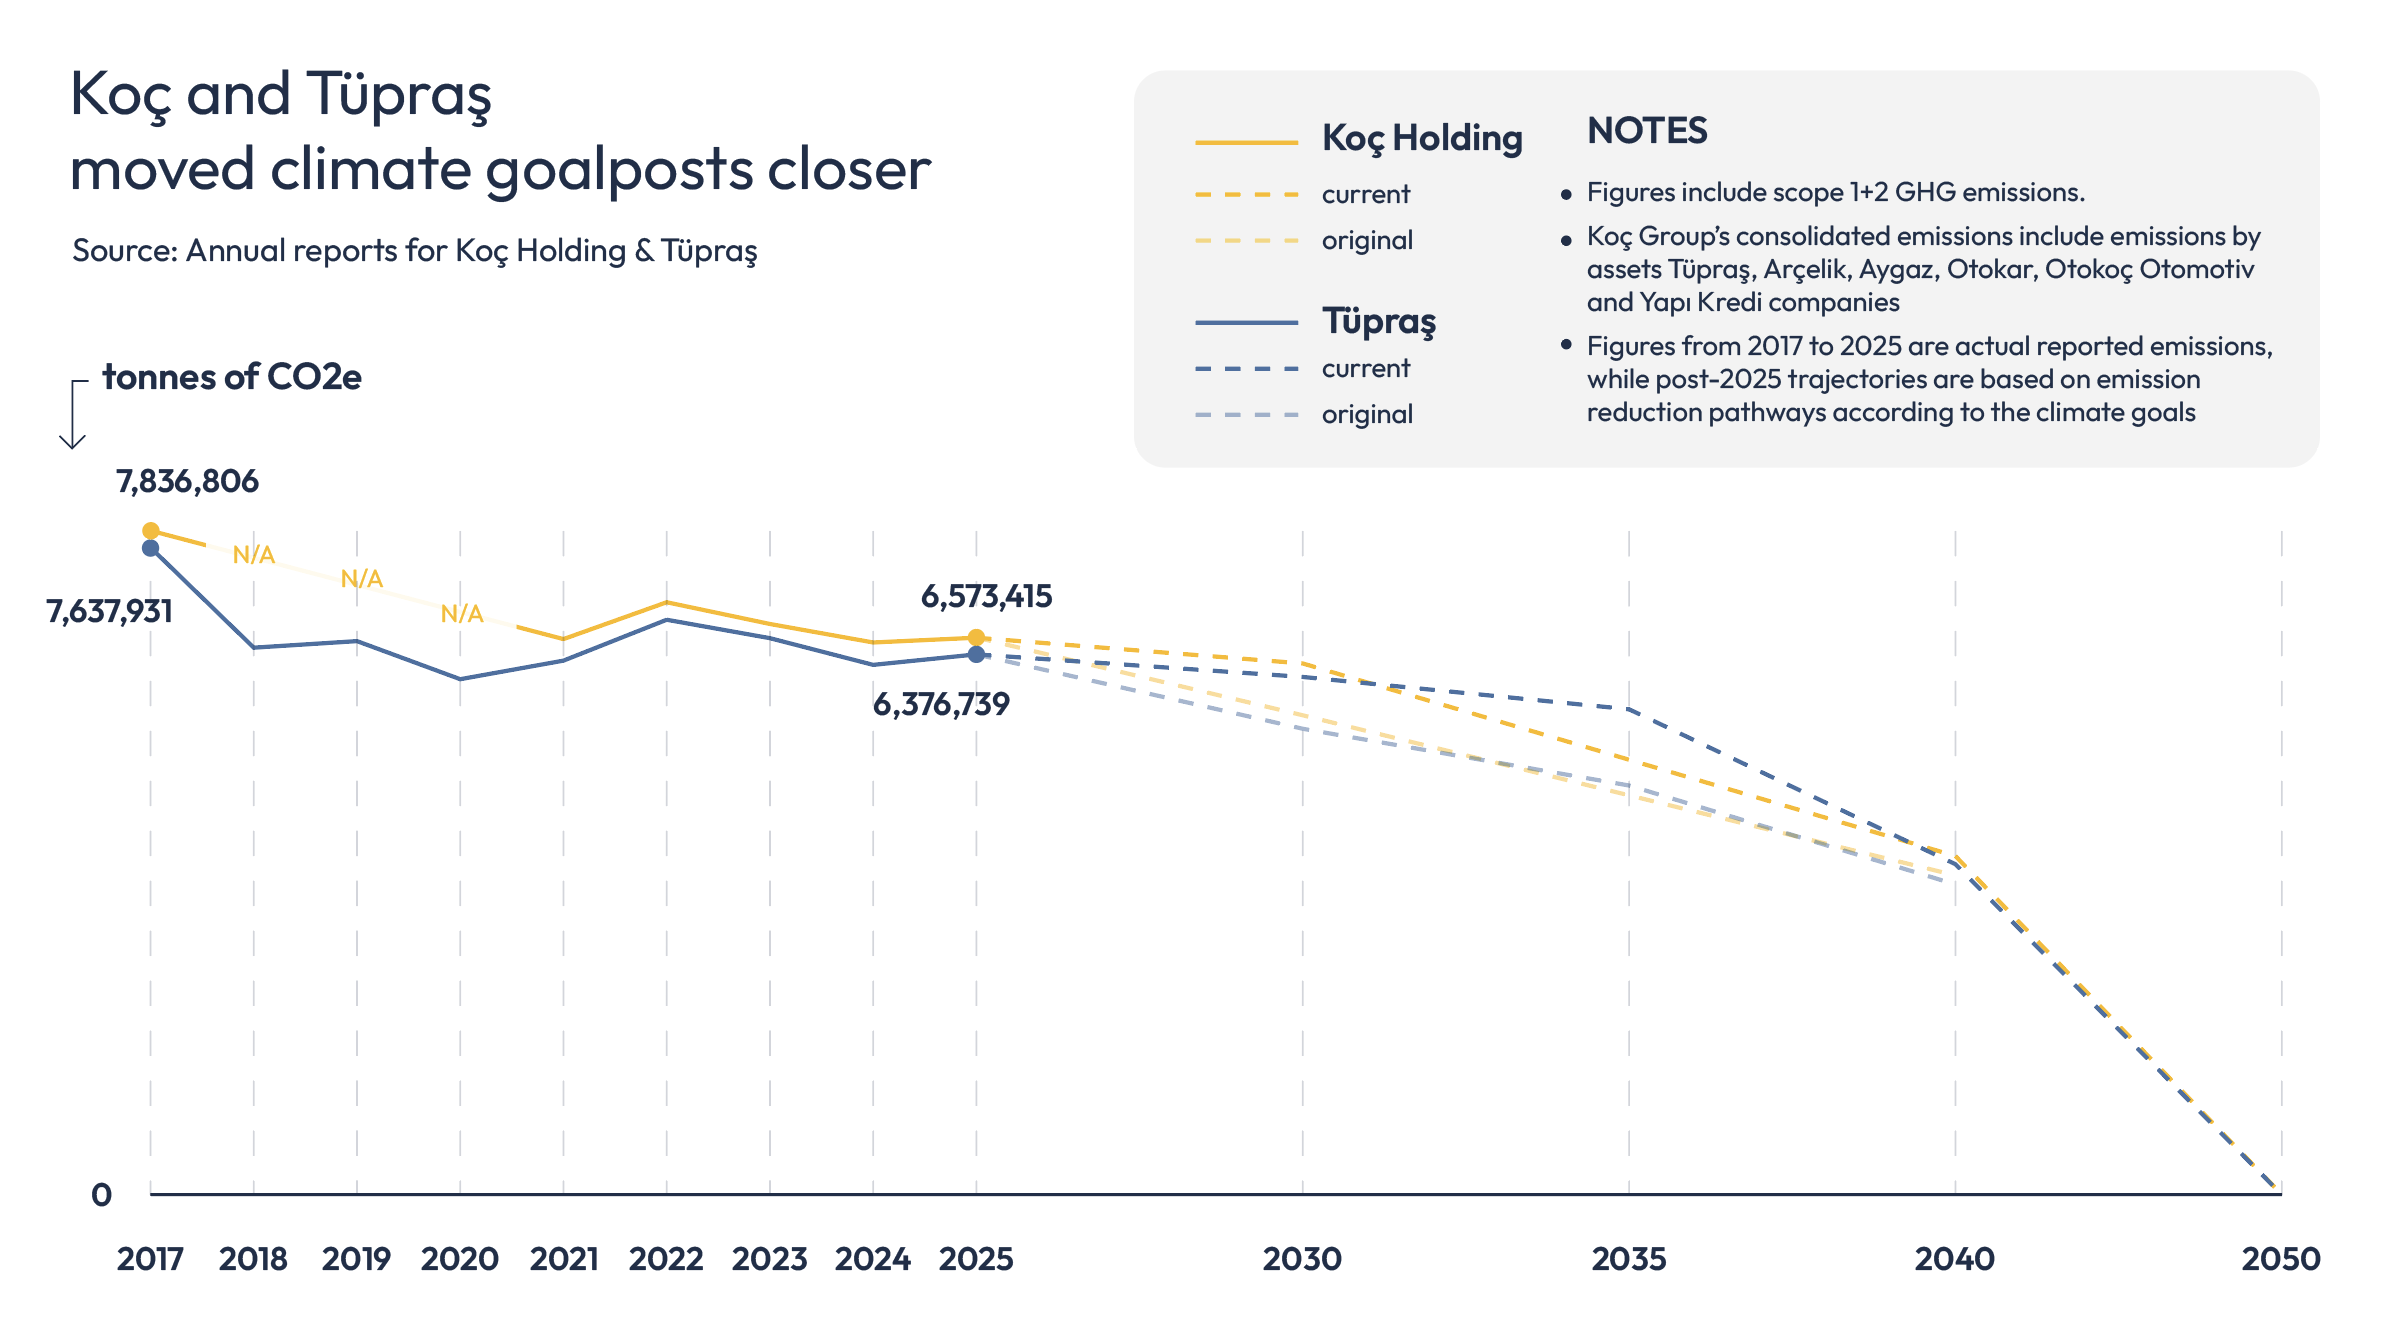
Despite these promises, in 2025, both companies lowered their targets for cutting emissions from their own operations by 2030, from 27% to 20% below 2017 levels. Tüpraş also cut its 2035 goal from 35% to 25%. The company still technically retains its long-term target of carbon neutrality by 2050, but the new plan will require much more drastic cuts after 2035.
Lowering the climate bar
Tüpraş blamed its weakening of climate ambition on “changing market dynamics, economic conditions and technological developments”. In a presentation announcing the revision to investors, the refiner said the energy outlook had changed since 2021.
The reasons it listed included elevated geopolitical tensions, increased investment in oil and gas extraction, which it said showed refined fuels remain vital for energy security – and even the depletion of the carbon budget to keep global warming to 1.5C.
Its parent company Koç pointed the finger at the slow pace of green hydrogen development, which the group said now had a “low feasibility” of transforming the energy sector after it had previously pinned much of its transition plan on the sustainable fuel.
The Turkish company’s new 2030 targets are certainly within reach. Tüpraş had already cut its operational emissions by 17% from 2017 levels by 2025, with nearly all of that progress achieved before the transition plan was unveiled, while Koç had reduced them by 16%.
The softer targets also exclude the bulk of the group’s climate impact. Most of its emissions come not from its own refineries and factories but from the products it sells: petrol, diesel and jet fuel burned in the engines of cars or planes.
These so-called Scope 3 emissions make up about 97% of Koç’s carbon footprint. They rose by around a sixth between 2019 and 2024, and neither Koç nor Tüpraş has set a target to cut them.
Efe Baysal, Türkiye team lead at campaign group 350.org, said there is a “clear contradiction” between talking about climate action while weakening emission targets and seeing emissions from the use of petroleum products keep rising.
“If the company is serious about the transition, it needs a clear plan to wind down fossil fuel operations, rather than relying on efficiency measures and technologies that let business as usual continue,” she told Climate Home News.
‘Sustainable refining’ push
Tüpraş’s updated transition plan rules out expanding its oil refineries, but commits to “maintaining the existing capacity” and running it “at maximum potential”. Oil refining is expected to remain its main source of earnings for years to come. Koç listed “growing oil demand and diesel deficit” in Türkiye as a competitive advantage for its energy business in a pitch to investors last month.
The biggest component of the Tüpraş transition plan is what the company calls “sustainable refining”. It plans to invest $3.9 billion between 2025 and 2035 in programmes to modernise its refineries, improve their energy efficiency and bring down the direct emissions they generate. The company is also shifting some of its production to petrochemicals, which it expects to reduce its Scope 3 emissions.
Australia says COP31 co-presidency will work on a cover decision
Alongside these “sustainable refining” efforts, Tüpraş is also investing in renewable power.
Four years ago, it bought Entek, which produces electricity primarily from six hydropower plants and one gas plant. Since the acquisition, Tüpraş has started building a utility-scale solar farm in Romania and a wind power plant with storage in Türkiye, alongside smaller solar energy installations at some of its refineries. A dozen more renewable energy projects are currently in the pipeline, according to its latest annual report.
In a self-declared bid to become “Türkiye’s leading producer of zero-carbon electricity”, Tüpraş wants to reach installed capacity of 1.6 gigawatts (GW) by 2030 – a target it raised in its updated plan – and 2.5GW by 2035. The Turkish government has committed to rolling out 120GW of wind and solar capacity nationwide by then.
Setback for green fuels
Tüpraş plans to supply most of its low-carbon electricity to run its future production plants for green hydrogen, an alternative fuel that can replace fossil fuels in some heavy industries and long-distance transport.
A few years ago, green hydrogen looked set to become a key pillar of the global energy transition, with companies pitching visionary projects and governments rolling out strategies for the fuel to decarbonise economies. But inflated forecasts, high costs and weak demand have led to a reality check for prospective producers like Tüpraş.
The Turkish refiner significantly scaled back its green hydrogen plans last year. While it originally hoped to start producing the clean fuel in 2025, it now targets a first pilot project by 2030 with commercial large-scale production not expected before 2035. That’s primarily because the cost of electrolysers, the machines that split water into hydrogen and oxygen, has risen fourfold since its original projections, the company said.
Is the world’s big idea for greener air travel a flight of fancy?
Tüpraş’s ambition to become Türkiye’s leading producer of sustainable aviation fuel (SAF) has also seen a partial rethink. The firm originally said it would convert by 2026 a unit in its sprawling oil refinery in the port city of Izmir into a plant that would produce SAF from waste cooking oil into “green” jet fuel.
But it is now planning to build a dedicated plant which is expected to be commissioned towards the end of 2028. That means its SAF output will be added to its existing fossil fuel refining capacity rather than replacing any of it.