
Research on climate change in urban areas is skewed towards large, well-established cities in the global north, according to analysis of more than 50,000 studies.
The research, published in Nature Cities, uses keyword searching and machine-learning methods to produce a database of studies on climate change and cities published over 1990-2022.
The authors find that small, fast-growing cities – especially in Africa and Asia – are underrepresented in their database.
“While cities like London, New York and Berlin are extensively studied, fast-growing cities such as Goma (Democratic Republic of the Congo), Surat (India) and Huế (Vietnam) are barely visible in the literature,” one study author tells Carbon Brief.
Inhabitants of these cities have collectively contributed very little to global greenhouse gas emissions, but face the greatest impacts from the warming planet, the authors say.
The paper finds that literature on climate change and cities is growing “exponentially”, with 84% of studies on this topic published over 2012-22.
The new analysis is published as scientists from around the world start work on the Intergovernmental Panel on Climate Change (IPCC) special report on climate change and cities, which is due for publication in March 2027.
The study finds that, in its most recent set of headline reports, the IPCC captured “only” 5% of the total available literature on climate change and cities.
One study author tells Carbon Brief that the study is a “call to action” for the IPCC and broader research community “to synthesise more, to look beyond familiar places and to take seriously the diversity of urban realities that will define the future of climate mitigation and adaptation”.
Climate change and cities
More than half of the world’s population live in cities. These densely populated areas are responsible for the majority of global emissions and are also hotspots for climate extremes, including heatwaves and flooding.
Research about climate change and cities is a fast-growing field that encompasses, among other topics, the impacts of climate change on city infrastructure, adaptation measures that city-dwellers are taking and technological measures to limit emissions from cities.
The IPCC’s upcoming assessment report will feature its biggest overview of research on cities to date, as the organisation has commissioned a special report on climate change and cities as part of its upcoming assessment cycle. The report’s outline has already been agreed and the final document is scheduled for publication in March 2027.
However, the new study argues that, without a dedicated effort to “pre-aggregate the underlying literature by the entire research community”, the IPCC “may struggle to deliver a balanced and comprehensive review”.
The new analysis is the “first global stocktake of literature” on climate change and cities, according to a press release from the University of Sussex. The research was produced in-part to help advise the authors of the IPCC report about the current landscape of literature on climate change and cities, the study authors tell Carbon Brief.
Author Dr Tim Repke is a researcher at the Potsdam Institute for Climate Impact Research. He tells Carbon Brief that he hopes that the new study “can serve as a starting point of searchable, clean data” to help the authors of the upcoming IPCC special report to “do their work more efficiently”.
A growing field
The amount of literature on climate change in cities is “much larger than previously estimated”, the paper says.
Moreover, the analysis points to “rapid, exponential growth” in literature on climate change and cities over the past three decades.
The graph below shows the number of studies about climate change and cities published each year over 1990-2022 (dark blue) and the subset of studies that focus on specific city case studies (light blue).
The plot also shows how many studies were published during the writing periods of each IPCC assessment report. For example, 37,539 studies on climate change and cities were published in time to feature in the IPCC’s sixth assessment cycle (AR6).
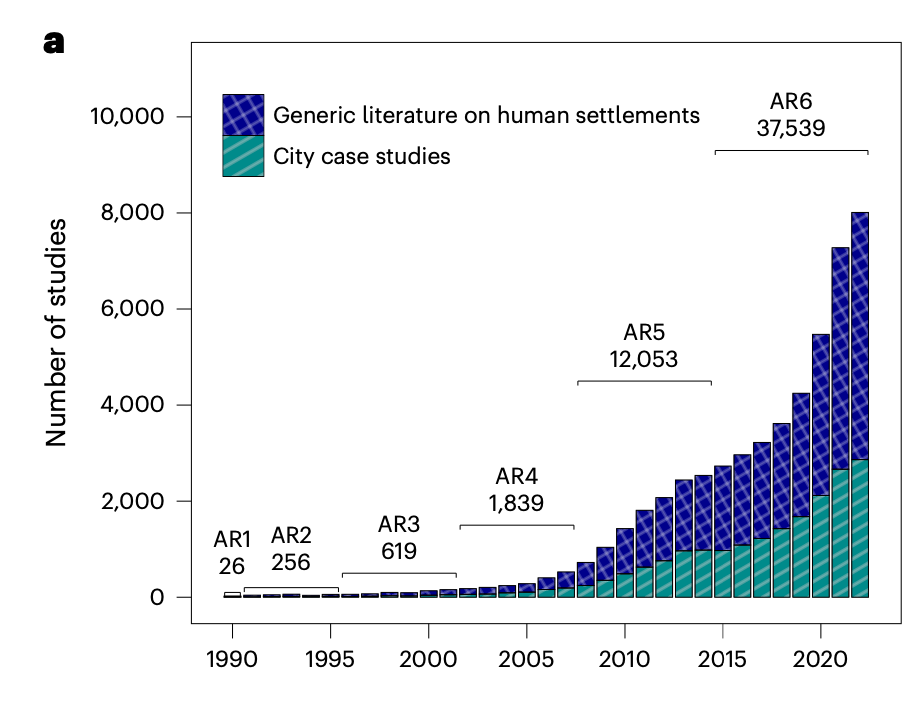
The authors find that 84% of studies in their database were published over 2012-22.
Literature on climate change and cities is currently growing 4.5 times faster than literature on climate change alone, they add.
Dr Simon Montfort is a postdoctoral researcher at Switzerland’s École Polytechnique Fédérale de Lausanne and lead author of the study. He tells Carbon Brief that the rapid growth in literature on climate change and cities is “not really surprising” because population growth in cities means that these areas are “becoming more and more important”.
The data can be explored further in their interactive online tool.
Uneven focus
There is a well-established skew in climate change literature towards wealthy nations in the global north. The new study finds that this skew is highly evident in literature on climate change and cities.
The map below shows the locations of the 20,000 “case study” papers. Darker colours indicate more highly researched areas. The map shows cities that were researched in one study (pink), between one and five studies (orange) and in more than five studies (red). The graph in the bottom left shows this information broken down by continent.
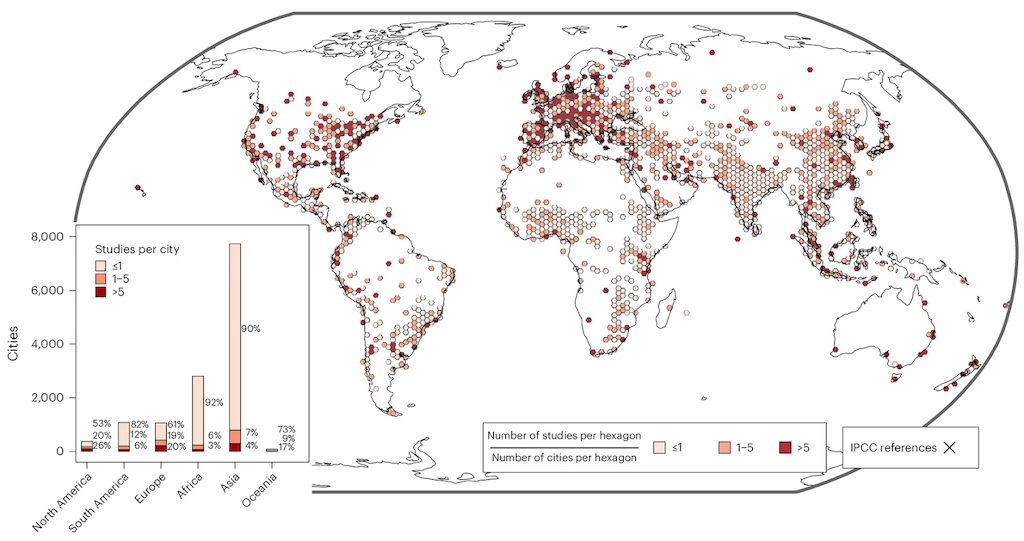
The authors identify more than 4,000 studies in Europe and 3,000 in North America. According to the authors, half of cities in these continents are covered by more than one study.
However, the map reveals a lack of research focused on cities in central and South America, Africa, the Middle East and south and south-east Asia.
The authors identify more than 8,900 studies focused on cities in Asia. One-third of these focus on Chinese cities, they find. The authors identify more than 1,500 studies on Beijing alone, most of which focus on mitigation, rather than impacts or adaptation.
Meanwhile, they find that 92% of cities in Africa are researched in no more than one study. Nigeria is the most highly studied country on the continent, with almost 400 studies – half of which focus on Lagos.
The authors identify a bias in their research database towards large cities with high emissions. Meanwhile, they find that small, fast-growing, non-coastal cities are underrepresented in the literature.
Prof Felix Creuztig is the head of the working group on cities at the Potsdam Institute for Climate Impact Research. He is an author on the study and on the upcoming IPCC special report.
He tells Carbon Brief:
“While cities like London, New York and Berlin are extensively studied, fast-growing cities such as Goma, Surat and Huế are barely visible in the literature. These smaller and rapidly urbanising cities in Africa and Asia are precisely where climate risks and emissions are increasing fastest, yet they are strikingly underrepresented.”
50,000 studies
To identify all existing literature on climate change and cities, the authors conducted their search using the open-access research database OpenAlex.
They first used a long list of keywords to search the abstracts of every paper on OpenAlex for research focused on cities and climate change. Keywords for literature on cities included “urban” and “built-up”, while key words for climate change ranged from “changing climate” to “carbon taxes”.
They then checked these papers using a “machine learning classifier”, which filtered out any research that was unsuitable.
The authors used a machine-learning approach to scan the abstracts of studies in their database, to determine which topics are most frequently covered.
More than half of the papers in the database were focused on mitigation, the authors found. The impacts of climate change on cities was covered in around 15,000 papers, and the rest covered adaptation and “cross-cutting” topics.
Lead author Montfort tells Carbon Brief that the database of 50,000 articles is “quite a precise sample, meaning that it includes few irrelevant articles”.
However, he adds that there may be “many relevant articles missing from our sample”. For example, the authors find that their database does not completely capture literature from the “physical sciences”, such as smart energy grids or radiative cooling methods.
Language is another notable bias, as the database only includes research published in English.
Dr Doan Quang Van is a researcher at Japan’s University of Tsukuba and a lead author on the upcoming special report. He praises the study, but notes that the English-only database likely leads to an “underappreciation of non-English regions”.
He also notes that Indigenous knowledge, which is “not necessarily contained in ‘official documents’ like papers or reports” is not included in the database.
IPCC recommendations
The authors compare the tens of thousands of studies cited by the IPCC in its most recent assessment cycle – AR6 – to their own database of literature on cities and climate change. They estimate that the IPCC cited almost 2,500 studies from the database in AR6, representing around 5% of the total.
They find that the IPCC’s choices about which studies to include further deepens the skew towards “large and mega cities” in the global north that is already evident in the literature.
Lead author Montfort tells Carbon Brief that the case studies are a “rich-evidence base” of “nuanced, case-specific knowledge”.
He says that it is important to expand the evidence base to less well-studied cities, but acknowledges it is “highly infeasible to conduct a study for every single city”. As such, he suggests that researchers should “look for ways to generalise findings from the more than 20,000 city-specific case studies already available”. He adds:
“If cities can learn from each other’s experiences, the existing evidence could go much further in informing city practitioners.”
To do this, the authors suggest that scientists should develop a data-driven method of grouping cities based on size, location and language, to enable “cross-city transfer learning from successful climate solutions”.
Dr Tamara Janes is a member of the climate information for international development team at the UK Met Office and an author on the upcoming IPCC special report. She was not involved in the new research.
She tells Carbon Brief that the study is “useful and timely”, adding that it “will undoubtedly help the ongoing special report by providing a solid foundational understanding for the current state of urban research worldwide”.
Janes adds that “this type of study is not only useful for researchers to design their research questions, but also for donor agencies as gaps in research can then be prioritised through flexible funding initiatives”.
Study author Crueztig says:
“For the IPCC and the broader research community, this is a call to action: to synthesise more, to look beyond familiar places and to take seriously the diversity of urban realities that will define the future of climate mitigation and adaptation.”
IPCC working group two co-chair, Dr Winston Chow, tells Carbon Brief that the “voluminous literature on climate change today presents challenges in its assessment”. He adds:
“Our experts are aware of these challenges towards developing reliable findings in informing our assessments and the IPCC is formally discussing this issue in a forthcoming expert workshop on methods of assessment.”
The authors add that they hope their interactive map, which is available online, will update automatically in the future to provide a “searchable, interactive, living database” of literature on climate change and cities.


The post Fast-growing, global-south cities are ‘strikingly underrepresented’ in climate research appeared first on Carbon Brief.
Fast-growing, global-south cities are ‘strikingly underrepresented’ in climate research
The UK’s new prime minister Andy Burnham remained tight-lipped on his views on climate change during his leadership campaign.
When asked his views on allowing new North Sea drilling in June – a move that the oil-and-gas industry and right-wing media have pushed for in recent months – he said he had “something of an open mind” on the issue.
But a trawl of Burnham’s past comments about climate change, net-zero and fossil fuels reveals a different picture.
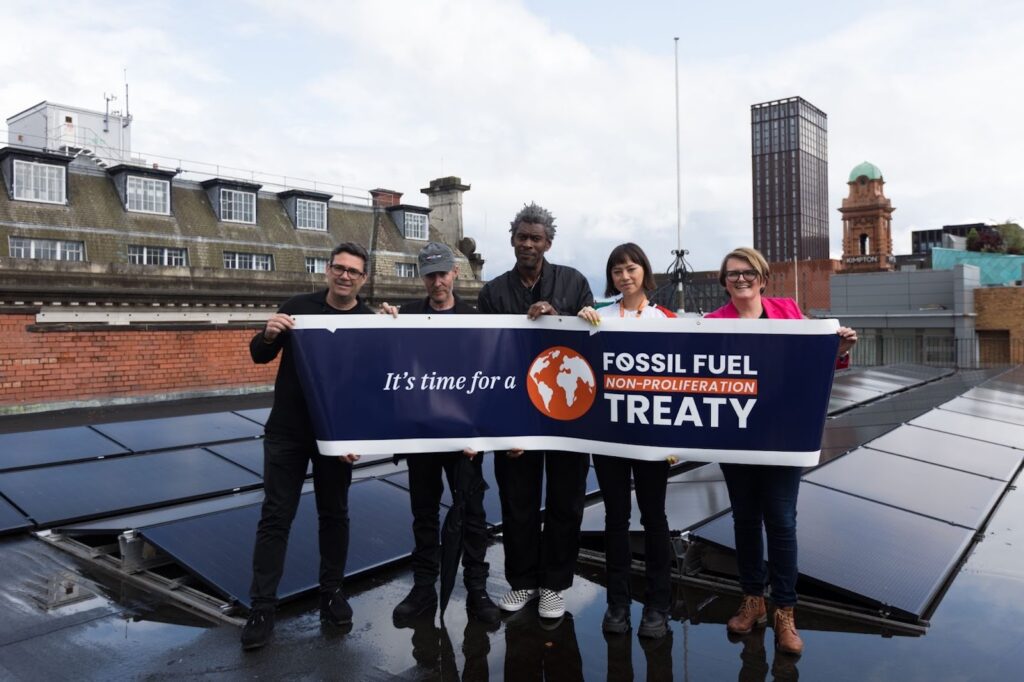
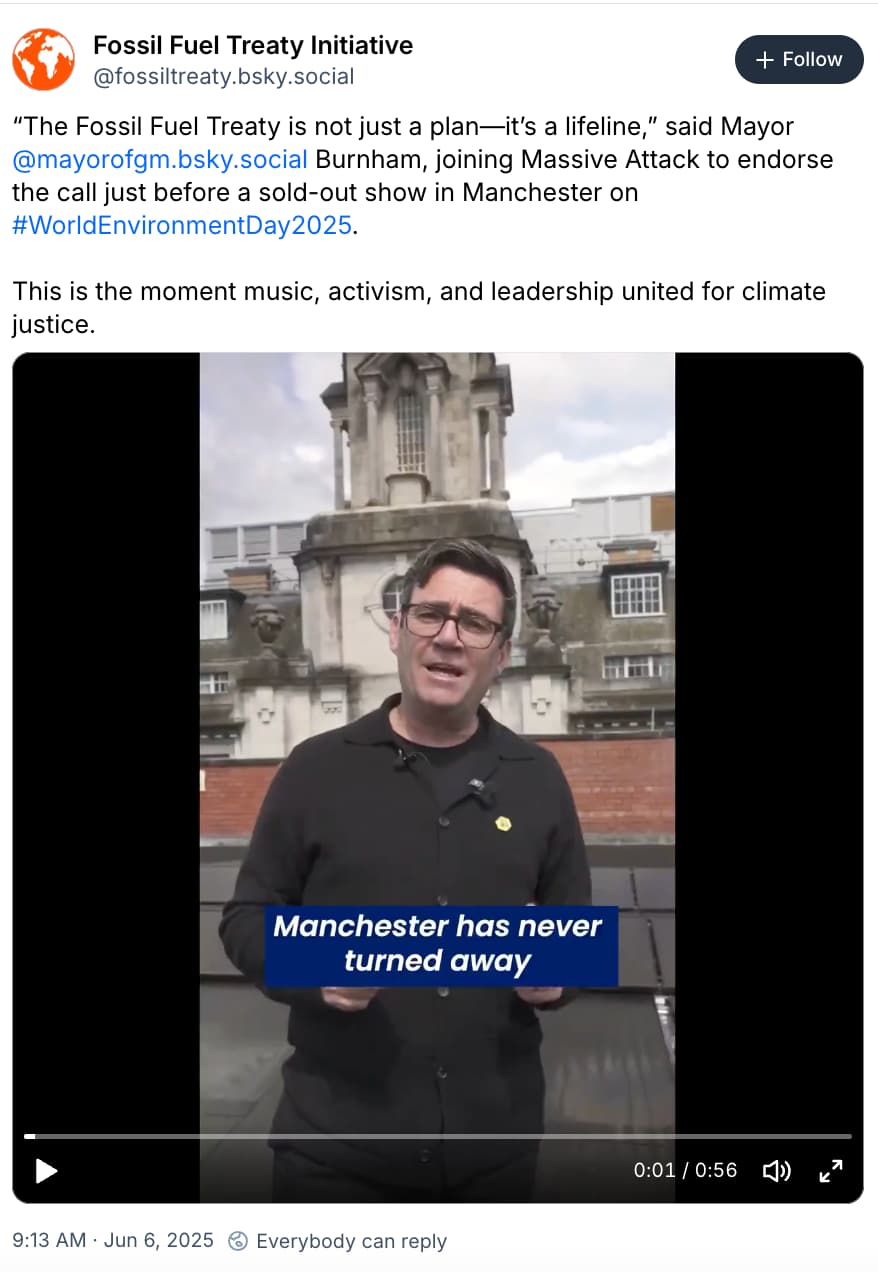
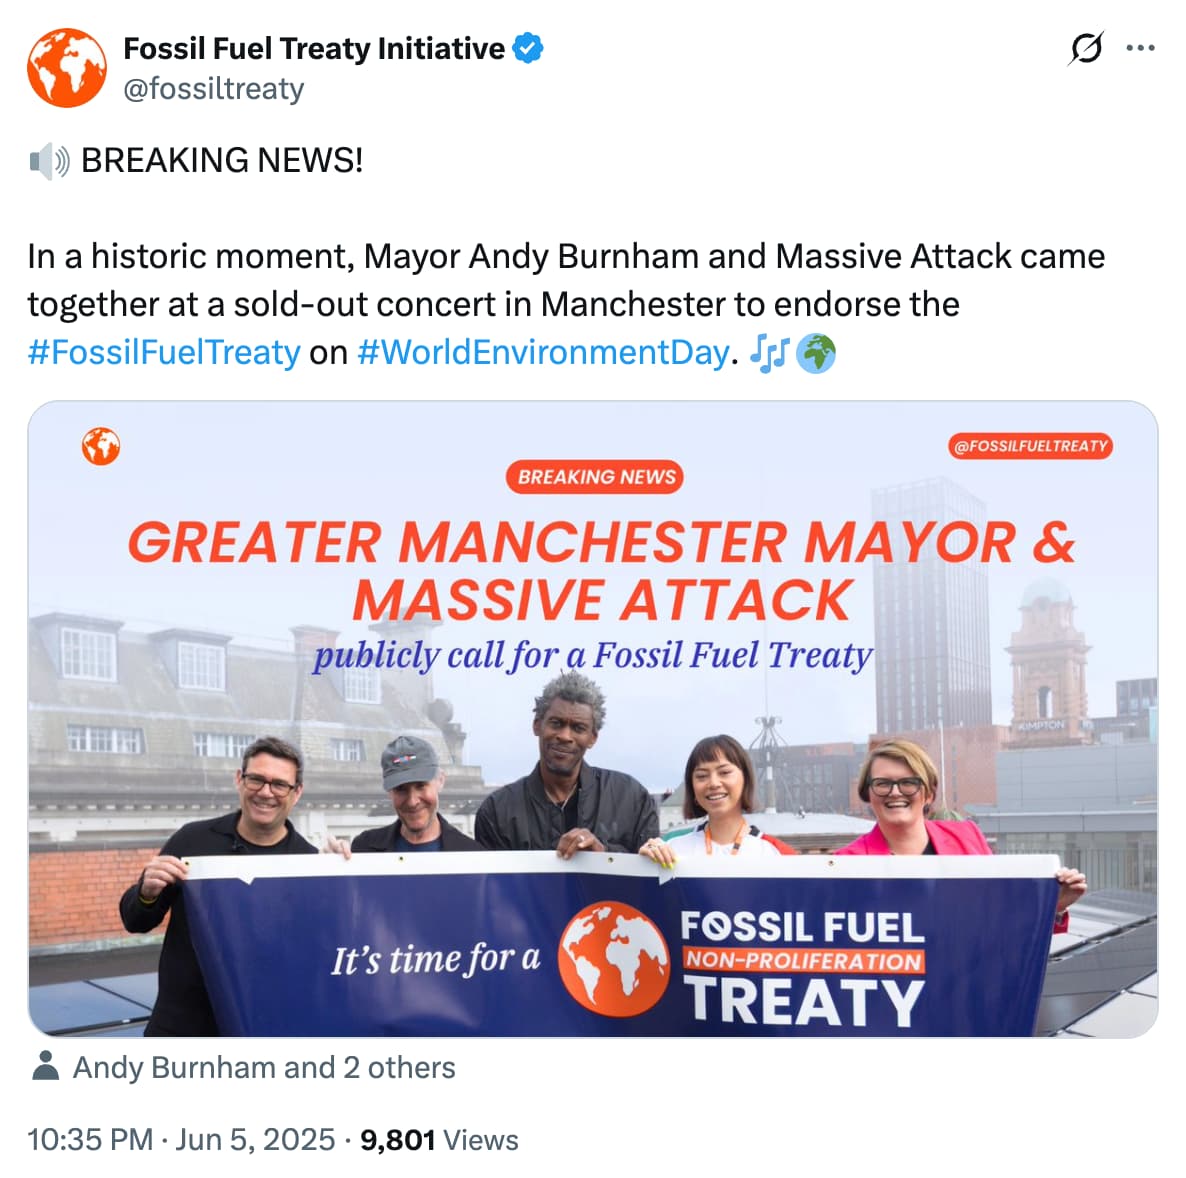
Just a year ago in June 2025, Burnham, while mayor of Greater Manchester, gave his support to the fossil fuel treaty – a proposed international pact on phasing out coal, oil and gas – calling it a “lifeline” that “all governments” should join.
In a video message endorsing the treaty, he also said that “there should be no turning away from net-zero”.
During his last bid to be Labour leader in 2015, he used similar language, saying:
“Labour under my leadership will never turn our back on either our duty to tackle climate change or the prospects offered by the green economy.”
Burnham has spoken about the threat of climate change since at least 2008, noting in 2021 that accelerated action could “create thousands of good jobs”, but also warning that net-zero risked becoming the “next Brexit”.
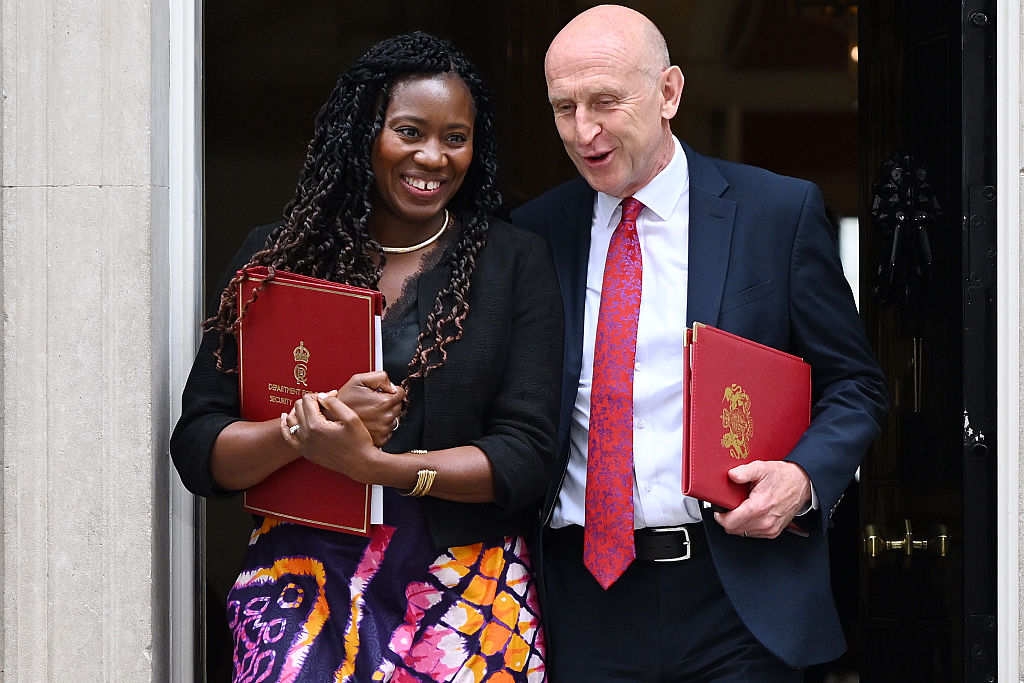
Burnham is yet to appoint his cabinet, but there is much speculation that he will select current net-zero secretary Ed Miliband as his chancellor – with their ally Miatta Fahnbulleh having a “strong chance” of taking Miliband’s former position.
Below, Carbon Brief recounts 28 things that Burnham has said about climate change, net-zero, fossil fuels, energy and transport.
Climate change
“Tackling climate change isn’t just about protecting the planet – it’s a powerful opportunity to build a fairer, greener future for our communities and businesses.”
Calling for local councils to be given more power and money for climate action, 29 November 2025
“There is little doubt that Greater Manchester’s biodiversity has taken a hit over the years, with habitats being lost, destroyed and becoming less diverse due to the impact of development, climate change, pollution and invasive species…We are committed to delivering a city-region for all residents to enjoy – a fairer, greener and more prosperous place for everyone.”
Statement after Greater Manchester declared a “biodiversity emergency”, 25 March 2022
“Over the next decade, if we accelerate our response to the climate crisis, we can create thousands of good jobs, improve homes, overhaul our transport system and make [Manchester] an even better place to live.”
Greater Manchester Green Summit, 18 October 2021
“The environment has never been higher on the national and international agenda.”
Statement after visiting a peat bog restoration project in England, 9 January 2020
“I think climate change [action] will be driven more quickly from the bottom up, if I’m honest. It’s the will of evolution if you wait for the government to act…When governments aren’t listening you get out and get your voice heard…so I think [climate protesters] deserve our encouragement, not our criticism.”
Speaking to Manchester Evening News at a student climate protest in Manchester, 24 May 2019
“Labour under my leadership will never turn our back on either our duty to tackle climate change or the prospects offered by the green economy.”
Labour leadership candidate speech, 15 July 2015
“Climate change can seem a distant, impersonal threat – in fact the associated costs to health are a very real and present danger…We need well-designed climate change policies that drive health benefits.”
Speaking to the Guardian about a study on climate and health, 25 November 2009
“The Stern report on the economics of climate change has changed the debate, in this country and around the world. It made it clear that the people who could suffer most from a failure to tackle climate change, or from a lack of ambition in our approach to it, are those living in the developing countries. They are the most vulnerable…[and] Stern said that the cost of not acting would be large. That is why the government took various measures in the recent spending review to ensure that we are prepared to face the challenges posed by climate change.”
Speaking in the UK parliament on the economic impacts of climate change on his final day as chief secretary to the Treasury, 24 January 2008
Net-zero
“There should be no turning away from net-zero.”
Speaking after giving his support to the fossil fuel treaty – a proposed global pact to introduce laws to phase out coal, oil and gas – on behalf of Manchester, 6 June 2025
“An opportunity is opening up for Britain as other countries move away from net-zero. We should seize that…We can make Britain a green leader. This is not the time to tiptoe, it is the time to commit to this path.”
Speaking at Innovation Zero World Congress in London, 29 April 2025
“[We] need a government that fully buys into the 2038 vision because the UK will not get to 2050 unless places like Greater Manchester are freed up to go faster – and we’re ready to go faster.”
Speaking about Greater Manchester’s aim to reach net-zero by 2038, 19 October 2022
“In Greater Manchester we have plans to build 30,000 net-zero social rented homes because we recognise that a successful city region needs good quality, affordable accommodation for everyone.”
Speech on the future of cities, 24 June 2022
“By building a broad consensus behind the drive to net-zero, we can ensure that the transition is a fair one that delivers social justice as well as climate justice. This is an opportunity for all of us to show how cutting carbon emissions in our cities can make a real difference to our communities – away from the abstractions and rooted in the real world.”
Panel discussion in Glasgow during the COP26 climate summit, 12 November 2021
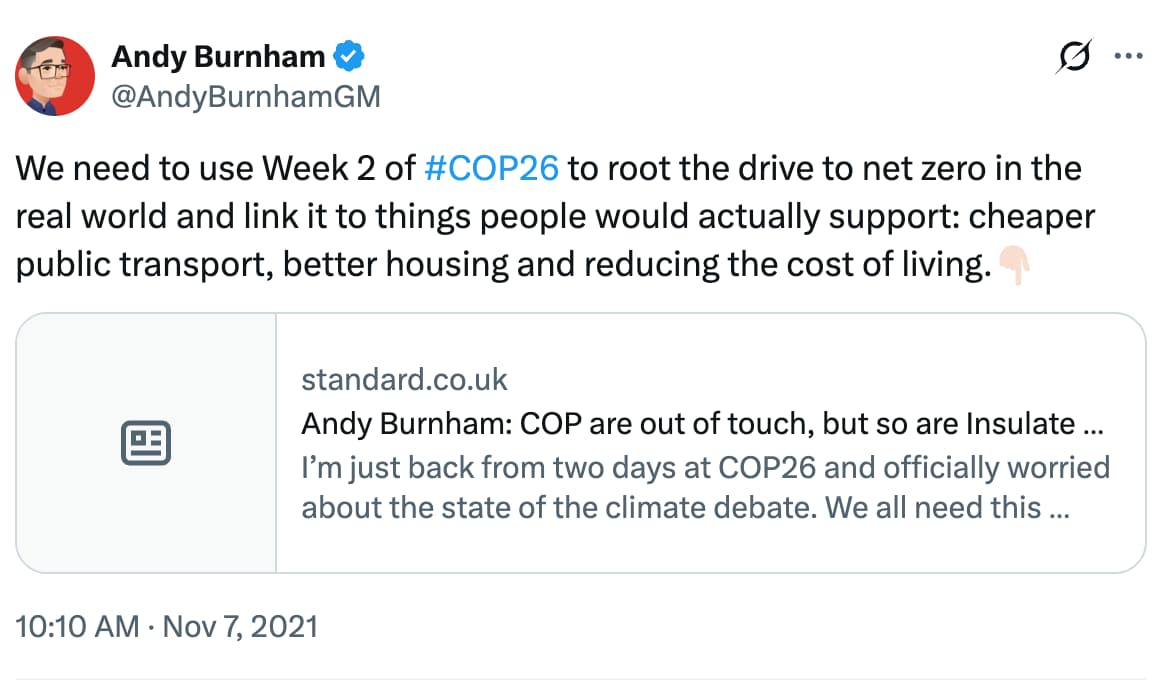
“To the extent that people have picked up anything from COP26, it’s a sense that the drive to net-zero will mean cost and inconvenience for ordinary people and offsetting for the wealthy and entitled. All of a sudden, you can feel how net-zero could become the new Brexit – a debate that gets very divided on class grounds…This has got to be a wake-up call. We cannot let this happen. We need to act now to build a broad social consensus behind the drive to net-zero. How to do that? It starts with taking control of the climate narrative from those steering it in the wrong direction and turning it around…We must show how, if done in the right way, the drive to net-zero is actually an opportunity to reduce the cost of living; to make people’s lives better and society fairer.”
Writing for the London Standard, 5 November 2021
“The drive to net-zero is a chance to re-industrialise the north of England, this time in a clean way. Create really good jobs, future-facing jobs for people, better public transport, improve people’s homes…If we go quickly towards net-zero, it’s the quickest way to level up the country.”
ITV interview at COP26, 1 November 2021
“If we really embrace the drive to net-zero, that is the route to level up the country…But it needs substantial investment, upfront, now, of the kind that Rachel Reeves, shadow chancellor [and chancellor under Keir Starmer’s government], has been talking about. We need long-term predictable funding.”
Interview with GB News at COP26, 1 November 2021
“I would have preferred to hear slightly less about carbonated wine and much more about a decarbonised economy.”
Referencing a UK budget, which included tax cuts for sparkling wine and other drinks, 28 October 2021
“Decarbonising is not just about lowering costs on to people. It’s the route to get better, cheaper public transport. It’s the route to getting homes that are cheap to run. It’s actually the way we can create thousands of good jobs for the people who live in Greater Manchester. This is the route to levelling up the country by going further and faster on decarbonisation.”
Speaking to Manchester Confidential, 20 October 2021
“[I am] asking people to stop seeing the environmental agenda as a cost and a burden agenda. I think this is a barrier that we’ve got to get over. Already in the media interviews I’ve done today, people are saying ‘can you afford it?’, ‘can it be achievable when times are tough?’.
“My answer to that is, at some point in the 21st century, all homes will be zero-carbon. At some point in this century, all buildings of any kind will be zero-carbon…All cars will be zero-carbon, all public transport will be zero-carbon…The question is: when? And surely the places that embrace those things first are putting themselves in a position of economic strength when it comes to facing up to the future. Rather than seeing the whole agenda as a burden, we’ve got to see it for the benefits that it can bring.
“There may be a greater upfront cost in a zero-carbon home, but let’s stop thinking, as we tend to do in Britain, of the short-term, the short-termist approach to life. Surely let’s start talking to the public about the lifetime cost.”
Greater Manchester Green Summit, 21 March 2018
Fossil fuels
“I’ve got something of an open mind, you know. I don’t have a sort of fixed position.”
Speaking on the issue of new North Sea oil and gas in a New Statesman interview, 3 June 2026
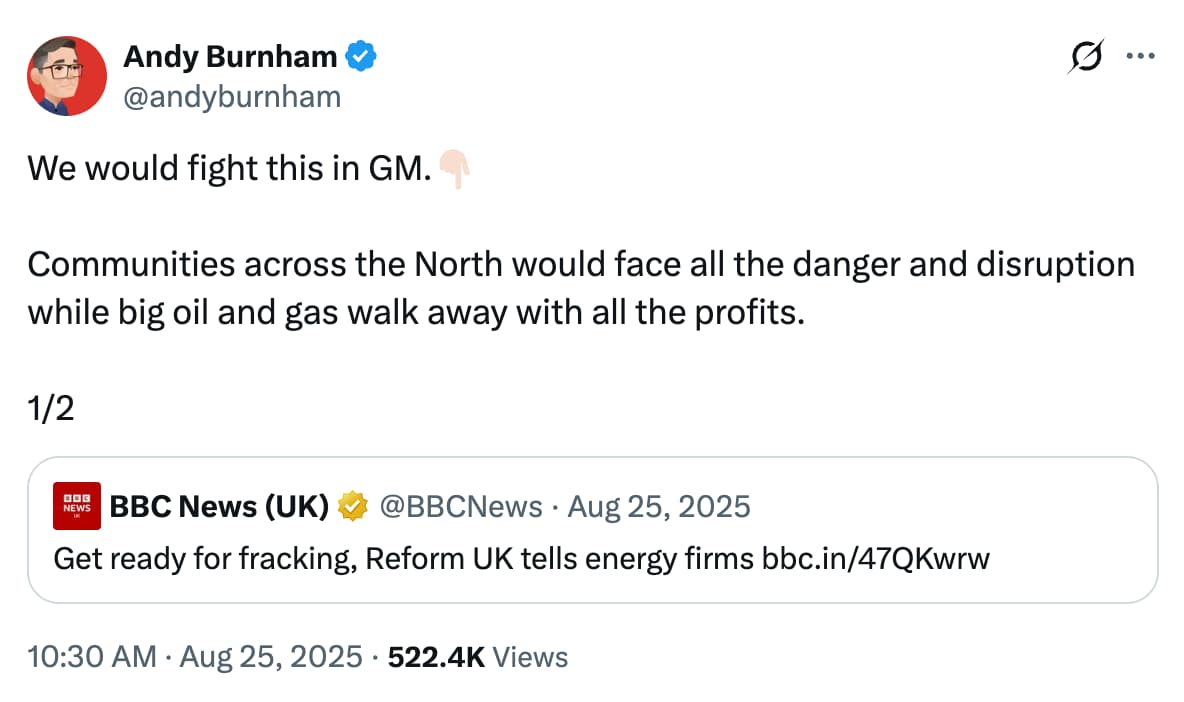
“We would fight this in GM [Greater Manchester]…Communities across the north would face all the danger and disruption while big oil and gas walk away with all the profits.”
In response to Reform’s call for fracking, on X, 25 August 2025
“I am proud to endorse the fossil-fuel treaty proposal today on behalf of Greater Manchester. It’s not just a plan – it’s a lifeline. It’s a call to end coal, oil and gas, hold polluters accountable…I urge all governments, nationals and subnationals to join this fight.”
Statement upon endorsing the fossil-fuel treaty, 5 June 2025
“Fracking is the past, it is not the future.”
Speech at London climate protest, 20 September 2019
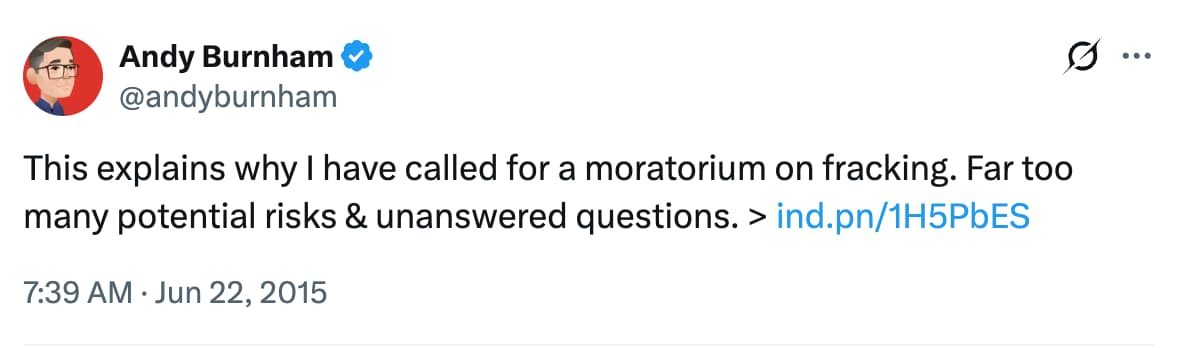
“I have called for a moratorium on fracking. Far too many potential risks and unanswered questions.”
On X, 22 June 2015
Energy and transport
“What I would do, if successful, is lay out a plan for more public control over water, energy, transport, so that over the period we can get those bills down, fares down, and give people and give businesses breathing space.”
LBC interview, 2 July 2026
“I am all in favour of tough decisions at a national level. I don’t believe there should be a third runway at Heathrow, for instance. But I think those are decisions for national government.”
Guardian interview, 13 June 2019
“There is a debate to be had about aviation, isn’t there? There are changing public attitudes about aviation. Rather than just saying no to people flying, don’t we need to accelerate research into low and zero-carbon forms of aviation?”
Guardian interview, 13 June 2019
“Today, I stand alongside the mayors of some of the greatest cities in the world. I’m committed to a cleaner, greener and healthier future for Greater Manchester. Around a third of greenhouse gas emissions in our city-region come from transport.”
When signing the C40 Fossil-Fuel-Free Streets Declaration, which includes support for zero-emissions vehicles and walking and cycling, on behalf of Manchester, 14 September 2018
This article was updated on 20 July to reflect Burnham replacing Keir Starmer as UK prime minister.

UK withdraws millions in funding from world’s second-largest rainforest in Congo
Analysis: UK newspapers have already printed 63 editorials in 2026 backing North Sea drilling
Livestock heat deaths in transit doubled in UK record-hot summer of 2025

Analysis: UK sales of electric vehicles just overtook petrol cars for the first time
The post 28 quotes from new UK leader Andy Burnham on climate, net-zero and fossil fuels appeared first on Carbon Brief.
28 quotes from new UK leader Andy Burnham on climate, net-zero and fossil fuels
Climate Change
Greenpeace welcomes dismissal of Woodside’s anti-democratic “SLAPP suit” against climate campaigners
SYDNEY, Thursday 23 July 2026 — Greenpeace Australia Pacific has welcomed news that a ‘fishing expedition’ brought by Woodside in connection with a 2023 climate protest has been dismissed in full, celebrating it as a win for the community in their ongoing fight to stop Woodside from drilling for oil and gas at Scott Reef.
The Supreme Court of Western Australia today threw out Woodside’s case, finding it had not succeeded in establishing it might have a cause of action against an unknown party involved in a three-year-old protest to bring attention to the harmful effects of Woodside’s gas expansion on climate and cultural heritage.
It comes as public opposition to Woodside’s plans to drill over 50 gas wells at Scott Reef continues to mount.
David Ritter, CEO at Greenpeace Australia Pacific, said: “Greenpeace welcomes the news that this case has been dismissed. Woodside’s use of a SLAPP* suit of this kind is a grotesque attempt to use legal tactics to silence people. There should be no place for SLAPP suits in Australian democracy.
“Community opposition to Woodside’s dangerous plans to drill over 50 gas wells at Scott Reef is large and growing.
“Woodside’s plan to drill for gas at Scott Reef is breaking hearts in the Australian community. Their plan to drill for gas at the pristine, magnificent Scott Reef, risking precious marine wildlife like turtles and whales, oceans and the climate, is a disaster waiting to happen, and one that over half a million Australians are calling on the WA and Federal governments to stop.”
-ENDS-
Notes for editor
A petition calling on the federal and WA governments to save Scott Reef has more than 552,000 signatures.
*SLAPP stands for “Strategic Lawsuit Against Public Participation”. It is a legal tactic used by powerful corporations, particularly within the fossil fuel industry, to censor, intimidate, and silence critics by burdening them with the high costs of a legal defense until they abandon their environmental advocacy or protests.
Media contact
Lucy Keller on +61 491 135 308 or lucy.keller@greenpeace.org
Kimberley Bernard on +61 407 581 404 or kbenard@greenpeace.org
Greenpeace welcomes dismissal of Woodside’s anti-democratic “SLAPP suit” against climate campaigners
Britain’s new prime minister announced in his first week that he will cut the cost of public transport and electricity, making lower-emission technologies like bus travel, electric vehicles and heat pumps more affordable for voters. But some of the funding for those policies will come from the budget for international climate finance, the government has said, raising concerns about fairness.
Former Manchester Mayor Andy Burnham took over from Keir Starmer as Labour Party leader and prime minister on Monday, appointing climate advocates Ed Miliband as foreign and development minister and Miatta Fahnbulleh as climate and energy minister.
On Tuesday, Burnham said his government would cut the value added tax (VAT) households and some small businesses pay on their electricity bills from 5% to zero from October 1, saving households £45 ($60) a year.
On Wednesday, he said the maximum fare bus companies in England can charge for a single journey will be reduced from £3 ($4) to £2 ($2.67) from January 1, 2027. The government said the subsidies to achieve this would be mostly funded by switching money set aside for overseas climate finance projects from grants to loans. It did not give further information in its announcement, while the UK’s transport minister told Sky News the plan is still being worked out.
-
Tropical forest protection fund at risk after UK stalls on pledge
The Brazil-led TFFF was launched at COP30 as an innovative financial model to keep rainforests standing, but is still short on startup cash -
UK halves Green Climate Fund contribution, as it spends more on security
After promising £1.6 billion to the UN’s flagship climate fund in 2023, the UK government has now said it will only hand over half as much -
EU, UK lead push for electrification as “powerful weapon” against fossil fuels
A group of dozens of countries seeks to build momentum for a COP31 pledge to electrify 35% of global energy use by 2035 as an alternative to fossil fuels


The floated changes to the climate finance budget were immediately criticised by groups working on climate justice for developing countries, including Bond, the UK network for NGOs, which described the decision as “disappointing”.
“Robbing Peter to pay Paul is not the answer and pitches marginalised communities in the UK against marginalised communities in lower-income and climate-vulnerable countries,” BOND CEO Romilly Greenhill said in a statement. “Climate finance must not worsen the debt burden of countries that are already suffering the worst – and most costly – impacts of a climate crisis they did not cause.”
Hunt for money
Burnham promoted both policies as measures to combat the rising cost of living and “give people breathing space”, with climate campaigners and industry groups noting they are also likely to reduce the UK’s climate-heating emissions by encouraging bus travel and the use of electric vehicles and heating.
But thorny questions remain over how the policies will be paid for. The government said Tuesday’s VAT cut for electricity would be funded by scrapping the previous government’s digital ID programme, but Darren Jones, a former minister involved with that policy, said it had been “unfunded” – a statement that dominated media coverage.
A day later, the government said the new bus fare cap would cost £454 million ($606m). Transport minister Heidi Alexander told Sky News that £54 million would be taken from an under-spend in the budget of the Department for Energy Security and Net Zero (DESNZ) and £400 million would come from changing unspecified international climate finance from grants to loans. The details “still need to be worked through”, she said, adding that the government “had wanted to make an announcement today”.
Mohamed Adow, director of Nairobi-based think-tank Power Shift Africa, said “climate finance was never meant to be a pot of money that governments raid when they need to pay for domestic spending”.
DESNZ had not responded to a request for comment at the time of publication. “We’re not wanting to fleece anyone here, and we actually want to maximise the development potential of this money that is available,” minister Alexander said in her TV interview.

Aside from the controversy over their funding, the policies themselves were widely welcomed by climate campaigners. Jess Ralston, energy lead at the Energy and Climate Intelligence Unit (ECIU), said the tax cut on electricity bills “could help households to switch to electric heat pumps, protecting UK homes from becoming ever more exposed to the whims of Putin and Trump when turning on their gas boiler”.
The last few months have seen global momentum build behind electrification, spurred by the US-Iran war disrupting oil and gas supplies and driving up prices. The Turkish and Australian COP31 presidencies have announced a global target to boost electrification, backed by the European Union, Canada, Philippines, UK and others.
Campaigners call for lower power prices
While reaction to the VAT cut was supportive, some questioned whether £45 a year of savings per household is enough and called for more measures to cut electricity bills.
Friends of the Earth’s energy lead Imogen Dow said those on the lowest incomes should be given cheaper electricity through a “social tariff” and the Institute for Public Policy Research (IPPR) think-tank – which is close to the Labour Party – said levies on energy bills should be shifted to general taxation.
Matthew Paterson, a politics professor at Manchester University, told Climate Home News that the most effective way to reduce electricity bills is to take on the UK’s private electricity companies, while consumer-oriented measures like the VAT cut are “tinkering around the edges”.
Jarrod Birch, head of policy and public affairs for the EV charging industry association Charge UK, said that while the policy would make home-charging cheaper, people who charge their vehicles at public points will still have to pay 20% VAT. The UK’s tax authority is fighting a court ruling that ordered it to reduce the tax motorists pay on public chargers to the current household rate of 5%.
Further measures will be the responsibility of Secretary of State for Energy Security and Net Zero Miatta Fahnbulleh, who is relatively new to politics after a career at left-wing, pro-climate think tanks the IPPR and the New Economics Foundation.
Michael Jacobs, political economy professor at Sheffield University and former adviser to UK Labour prime minister Gordon Brown, said Fahnbulleh would be a “climate advocate” who would continue the “progressive climate agenda” of her predecessor Ed Miliband.
“She’s a very creative policy wonk so I expect there to be lots of policy innovation under her,” he said, “I think she will be looking at new ways to encourage take-up of heat pumps and domestic batteries.”
Aid budget in Miliband’s hands
Despite reports he could be made finance minister, Miliband has been appointed Secretary of State for Foreign and Commonwealth Affairs. Miliband has attended many climate COP meetings over several decades, most recently representing the UK at COP29 and COP30, and has been targeted by the right-wing media for his support for climate action and opposition to new oil and gas drilling in the UK’s part of the North Sea.
In his new role, Miliband will be responsible for the UK’s overseas aid budget including its international climate finance, which the Starmer government had slashed to fund increases in defence spending.
UK cuts support for climate action abroad to fund military instead
Jacobs said he expected Miliband to prioritise climate and development in the UK’s foreign policy and to push Burnham and new finance minister John Healey to reverse Starmer’s aid cuts.
But there are fears Healey could try to cut the aid budget further to fund the military. Healey was a surprise pick for Chancellor of the Exchequer and grabbed headlines when he resigned as Starmer’s defence minister in June over what he saw as insufficient defence spending.
The post Will new UK PM’s green measures at home cause climate finance pain overseas? appeared first on Climate Home News.
Will new UK PM’s green measures at home cause climate finance pain overseas?


28 quotes from new UK leader Andy Burnham on climate, net-zero and fossil fuels

SkySpecs Turns Blade Data Into Smarter Repairs
Greenpeace welcomes dismissal of Woodside’s anti-democratic “SLAPP suit” against climate campaigners
-
Climate Change12 months ago
Guest post: Why China is still building new coal – and when it might stop
-
Greenhouse Gases12 months ago
Guest post: Why China is still building new coal – and when it might stop
-

 Greenhouse Gases2 years ago
嘉宾来稿:满足中国增长的用电需求 光伏加储能“比新建煤电更实惠”
-

 Climate Change2 years ago
嘉宾来稿:满足中国增长的用电需求 光伏加储能“比新建煤电更实惠”
-
Climate Change2 years ago
Bill Discounting Climate Change in Florida’s Energy Policy Awaits DeSantis’ Approval
-

 Renewable Energy9 months ago
Sending Progressive Philanthropist George Soros to Prison?
-

 Carbon Footprint2 years ago
US SEC’s Climate Disclosure Rules Spur Renewed Interest in Carbon Credits
-
Greenhouse Gases1 year ago
嘉宾来稿:探究火山喷发如何影响气候预测