
Welcome to Carbon Brief’s DeBriefed.
An essential guide to the week’s key developments relating to climate change.
This week
Shifting political players
EU LEADERSHIP: Ursula von der Leyen has secured another five years as president of the European Commission following a vote yesterday in which she won the backing of 401 MEPs – 40 more than needed, reported Bloomberg. In her reelection bid, von der Leyen committed to EU climate goals including the still-pending 90% emissions reduction by 2040 target and a new Clean Industrial Deal, Euractiv reported. However, the publication noted that her comments on nature protection were limited to “positive rhetoric” only.
PARIS PM: Elsewhere in Europe, veteran climate negotiator Laurence Tubiana has been proposed as the next French prime minister, with backing from the Socialist, Green and Communist parties in the current hung parliament, reported Climate Home News. Tubiana, who is currently CEO at the European Climate Foundation [which funds Carbon Brief], was one of the “architects” of the Paris Agreement in 2015, according to Bloomberg.
VANCE’S STANCE: In the US, Donald Trump’s newly selected running mate JD Vance has come under scrutiny for his climate scepticism. The Republican vice presidential candidate is “a staunch supporter of the oil and gas industry and an opponent of renewable energy”, according to the Independent, but has reportedly only held such views in recent years, a shift that coincides with his bid for Trump support. He also has investments in “green” technologies, reported E&E News, but the New York Times emphasised his public anti-climate sentiments and his sponsorship of green legislation repeals as a senator for Ohio.
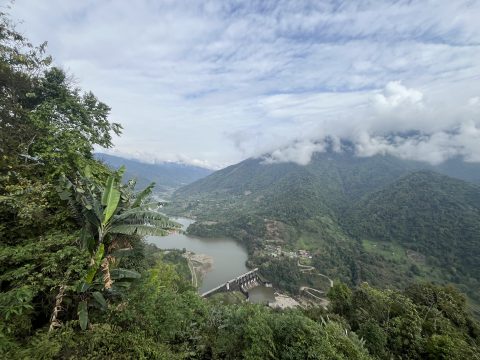
AFRICAN COAL: In South Africa, a political ecologist wrote in the Conversation that the country’s newly appointed environment minister has shown support for continuing to use coal and said his government would not be “bullied” into transitioning away from fossil fuels too quickly. It comes as Agence France-Presse reported that the country’s president Cyril Ramaphosa has “reaffirmed the coal-dependent nation’s commitment to moving towards renewable energy, but insisted that communities and workers must not lose out”.
Labour must ‘make up lost ground’
KING’S SPEECH: The UK’s new Labour government has confirmed a legislative agenda with the environment “front and centre”, reported the Guardian. The king’s speech mentioned that the government will set up the publicly owned GB Energy to “own, manage and operate clean power projects” across the UK, reported BBC News. The company is set to be capitalised with an £8.3bn investment. Meanwhile, Politico reported that Labour is set to appoint a climate envoy, a role that has been empty for more than a year.
NEW ADVICE: The Climate Change Committee (CCC), which advises the UK government on its climate policies, released its annual progress report on Thursday, urging Labour to “make up lost ground” after a lack of sufficient action under the last Conservative government. Carbon Brief covered the recommendations in detail (more on this below). Elsewhere, the Times reported that Emma Pinchbeck, chief executive of the industry group Energy UK, has been appointed “preferred candidate” for the next chief executive of the CCC.
Around the world
- ‘HELLISHLY HOT’: A heatwave across southern Europe and the Balkans has led governments to issue severe weather warnings, said France 24, with temperatures rising above 40C.
- CHINA ‘THIRD PLENUM’: A communique from China’s highly influential “third plenum” meeting called for a “coordinated approach to carbon cutting, pollution reduction, green development and economic growth”, as well as for the country to “actively respond to climate change”, according to state news agency Xinhua.
- CARIBBEAN VULNERABILITY: In the aftermath of Hurricane Beryl, which killed at least a dozen people and destroyed infrastructure across the Caribbean, the Associated Press reported that officials are demanding more funding from “financial and development institutions” to rebuild and address climate change.
- PROTEST IN PERIL: Five UK climate activists from Just Stop Oil received record-length jail sentences of up to five years for a plan to block London’s M25 motorway, reported Reuters. Meanwhile, the right to peaceful protest in Australia is also “in peril”, the Guardian reported.
- GLOBAL FLOODS: Downpours and flooding have killed hundreds in South Asia, caused “emergency alerts” in China, left more than 50 people dead in Niger and caused damage in Toronto, Canada.
$8.4bn
The amount of debt eradicated through “debt-for-nature” swaps from 1987-2023.
$7.6tn
The total amount of debt service paid by low- and middle-income countries over the same timescale, illustrating how swap schemes are “far too small to have any impact”, experts told the Carbon Brief.
Latest climate research
- European “fire weather” – conditions favourable to the ignition and spread of wildfires – will become “more severe” due to climate change, showed a new study in Environmental Research Letters.
- Optimising the conversion of organic waste into biogas for energy has considerable decarbonisation potential in China, said new research in Nature Communications, which found that their proposed system could contribute 3.77% of the emissions reduction needed for the country’s 1.5C-aligned target.
- Nature-based solutions have “consistently proven to be a cost-effective approach” to address disaster risk, reported researchers in Science of the Total Environment.
(For more, see Carbon Brief’s in-depth daily summaries of the top climate news stories on Monday, Tuesday, Wednesday, Thursday and Friday.)
Captured

UK emissions have been falling steadily for years, largely driven by the phaseout of coal and the growth of renewable power. However, only one-third of the reductions required to achieve the UK’s goal under the Paris Agreement of cutting emissions 68% by 2030 are covered by plans the CCC deems to be “credible”, according to its latest progress report. There is an even larger credibility gap for the sixth carbon budget for 2033-2037, with only a quarter of the cuts needed covered by “credible” policies. This is illustrated in the chart above, which shows the emissions cuts needed to reach net-zero (red), compared to cuts expected from policies that the CCC deems “credible”.
Spotlight
The climate impact of generative AI
Carbon Brief investigates the climate implications of the accelerating use of generative AI tools.
Google’s latest environmental report indicated that its total emissions have increased by almost 50% since 2019 and 13% year-on-year – a change it puts down to the growth of its data centres and rising emissions in its supply chain.
The report added that rolling out artificial intelligence (AI) services might make it “challenging” to cut emissions due to the “increasing energy demands from the greater intensity of AI compute”.
Since March, Google has been integrating its generative AI tool Gemini into search functions, matching the exponential uptick in day-to-day AI use through Chat-GPT, Microsoft Copilot and other such tools. (“Generative AI” is AI that is capable of generating text, images, videos or other data from scratch in response to a prompt.)
But there’s a catch: when a query is sent to a generative AI model (a process known as inference), it uses a lot more energy than a traditional search, creating an expectation that the energy demand of data centres will shoot up as a result.
Soaring energy demand
A recent study, still awaiting peer review, found that a multipurpose AI system could use up to 33 times more energy than computers running task-specific software and that generating two images with AI uses as much energy as charging a smartphone.
Dr Sasha Luccioni, AI and climate lead at AI company Hugging Face and lead author of the study, explained to Carbon Brief that multipurpose models “tend to be larger in size” and are trained for several different outputs, “which makes them more computationally-intensive”.
Training AI models before they are available for use also takes large amounts of energy. OpenAI’s GPT-3 required 1,287MWh during training, enough electricity to power 120 average US households for one year.
Direct energy consumption is not the only factor to consider. Felippa Amanta, a PhD researcher of digital services at the University of Oxford’s Environmental Change Institute, told Carbon Brief that “generative AI can have quite unpredictable indirect energy effects from how they’re being used by households”.
People are also using AI assistants for things they never needed it for before – a phenomenon Amanta explained as “induced demand”.
AI is changing our day-to-day behaviour, “from finding recipes, to writing emails, making CVs and the list goes on”, she said. It is this increase in user inference that can drive up data centre energy demands.
A report from the International Energy Agency (IEA), released today, said that the rise of AI was putting an increased focus on the energy use of data centres. (AI currently accounts for around 10% of data-centre electricity use.)
It said that electricity consumption from data centres as a whole accounted for a “limited” 1-1.3% share of global electricity demand in 2022. This could rise to between 1.5% and 3% by 2026, according to its projections. (By contrast, electric vehicles are expected to account for between less than 1.5% and 2% by 2026.)
The agency noted that expectations of future data centre energy demand growth were highly uncertain, depending on the uptake of AI services and the efficiency of the chips used to run them. (It noted that chipmaker Nvidia recently unveiled a new chip that was 25 times more energy efficient than previous models.)
As with any electricity-intensive technology, the climate impact of surging AI use will be determined by the extent to which renewables can meet the demand. In April, the Financial Times reported that fossil-fuel companies are hoping that surging energy demand from AI use will “usher in a golden era” for gas production.
Efficiency and regulation
On the flip side, AI has the potential to be a tool for climate action, chiefly by increasing energy efficiency. For example, AI could be used to improve the efficiency of power grids or daily commutes.
But as generative AI tools become integrated into our lives, there is a risk of a rebound effect, where the ease and ubiquity of AI solutions make us use services more, countering any efficiency savings, Amanta said.
Another issue facing the rapidly changing AI environment is a lack of transparency.
The climate impacts of AI models can potentially be mitigated by increasing their computational efficiency, powering data centres with clean energy, or using more task-specific models – but a lack of transparent data is slowing the development of legislation to regulate this shift, Dr Luccioni told Carbon Brief:
“The fact that we can’t get an accurate estimate of the energy usage or emissions of the many AI-enabled tools used by millions of people daily is problematic.”
Without understanding the scope of the issue, it is difficult to regulate energy intensity or add constraints on companies, she added. The IEA’s report also called for more reliable data.
Amanta pointed to examples of policies being proposed in the US and Singapore that recognise the environmental impacts of AI’s growth and aim to regulate their efficiency and sources of energy. The EU’s AI Act, which came into force in June, includes environmental considerations.
Watch, read, listen
SEA LEVEL RISE: A coastal village in Myanmar is being eroded away due to rising sea levels and residents are struggling to access fresh groundwater, reported the Mekong Eye.
CLIMATE CONFLICT: Earthrise released a video exploring the intersectionality of climate change and conflict, speaking to Sudanese climate activist, Watan Mohamed.
FACTCHECKING TWISTERS: The new tornado disaster film gets a lot of things right about climate science, said experts in Nature.
Coming up
- 15 July-2 August: Second part of the 29th Session of the International Seabed Authority Assembly and Council, Kingston, Jamaica
- 22-26 July: 27th Session of the FAO Committee on Forestry, Rome
- 25-26 July: G20 3rd Finance Ministers and Central Bank Governors meeting, Rio de Janeiro
Pick of the jobs
- International Institute for Sustainable Development (IISD), senior communications officer, India energy programme | Salary: Unknown. Location: Delhi, India (remote)
- Environment America, climate solutions associate | Salary: $32,500. Location: Pennsylvania, US
- Climate Outreach, fundraising administrator | Salary: £23,000. Location: Oxford, UK (remote)
Climate Central, vice president for science | Salary: $140,000-$160,000. Location: Princeton, New Jersey, US (remote)
DeBriefed is edited by Daisy Dunne. Please send any tips or feedback to debriefed@carbonbrief.org.
This is an online version of Carbon Brief’s weekly DeBriefed email newsletter. Subscribe for free here.
The post DeBriefed 19 July 2024: New political players in EU and US; UK govt urged to make up ‘lost ground’ on targets; AI’s climate impact appeared first on Carbon Brief.
Reports of human rights and environmental abuses linked to Chinese companies’ overseas investments in the mining and refining of minerals needed for the clean energy transition are on the rise, research by a monitoring group has found.
The number of recorded allegations of harm at projects tied to Chinese firms have increased every year since 2021, rising to 148 in 2025, according to the Business and Human Rights Centre (BHRC). On Wednesday it released new data showing that a total of 434 allegations of abuse were made against Chinese-backed projects over the five-year period in projects across the world.
The world’s top cleantech manufacturer, China is also the leading financier of critical minerals projects worldwide. The country has committed more than $120 billion in foreign direct investment into mineral mining and processing since 2023, Australian think-tank Climate Energy Finance recently found.
“China plays a central role in global transition mineral supply chains, and as such has a unique opportunity to raise the bar on human rights and community engagement at every stage of mining,” said Michael Clements, BHRC’s executive director.
“While there have been encouraging developments, from stronger regulations to more company engagement, there remains a gap between human rights commitment and action,” he said.
The report comes as communities affected by Chinese-backed mineral projects have filed the first two cases to a Beijing-based mediation mechanism intended to bring willing Chinese companies to the discussion table with affected communities.
Allegations of harms on the rise
BHRC’s latest analysis – including data for the period 2023-2025 – covered mining, smelting and refining projects for 11 minerals considered key to manufacturing clean energy technologies such as batteries, EVs and solar panels needed to move away from climate-heating fossil fuels.
The highest number of abuses was recorded in Indonesia, the world’s largest producer of nickel, which is used to make EV batteries. After the Indonesian government banned exports of raw nickel, Chinese firms invested billions of dollars to develop a large-scale nickel smelting and processing industry in the Southeast Asian country, largely powered by coal.
Other countries with a high number of recorded harms include the Democratic Republic of Congo, where Chinese firms dominate cobalt and copper production; Myanmar, where unregulated rare earths mining has caused widespread environmental destruction; Serbia, where Chinese-backed mining of some of Europe’s most significant copper and gold deposits is swallowing land and homes, and Zimbabwe, where Chinese investments have turned the nation into Africa’s top lithium producer.
Growing risks for people and nature
Allegations tracked by BHRC included negative impacts on local livelihoods, health and land rights, workers’ health and safety and work-related deaths, as well as water pollution and environmental contamination. In addition, 18 people were attacked for raising concerns about Chinese transition mineral projects between 2023 and 2025.
The report shows that 10 Chinese companies, including Zijin Mining, Tsingshan Group and Zhejiang Huayou Cobalt, accounted for nearly two-thirds of all allegations recorded in the last five years. It found that some Chinese companies “still appear to turn a blind eye to these issues” but noted that several others have been more responsive to allegations of abuse. However, even among companies with human rights policies, implementation remains a challenge, BHRC warned.
-
India looks to untapped graphite riches for slice of critical minerals boom
Clean energy demand for battery-grade graphite is surging, but India faces hurdles as it positions itself to compete with China’s grip on the supply chain -
Indonesia turns traditional Indigenous land into nickel industrial zone
Indonesia supplies the EV industry with critical battery materials but the sector’s rapid expansion is infringing the rights of Indigenous peoples -
Recycling could meet half of Europe’s critical mineral needs by 2050
A new report by an EU-funded research project says the bloc could harness its “urban mines” to reduce its dependence on China for energy transition minerals


Zijin Mining and Zhejiang Huayou Cobalt repeatedly responded to the allegations of harm by saying they take environmental and social risks seriously and adhere to international standards. Tsingshan Group never responded to BHRC’s requests for comment.
Platform for dialogue between communities and Chinese firms
At the same time, Chinese authorities have made “significant progress” on introducing a more specific framework for managing environmental and social risks in overseas investment, BHRC said.
This includes global consultation on a draft Sustainable Mining Code, adherence to UN guiding principles on business and human rights, and greater emphasis on oversight of companies operating overseas.
The China Chamber of Commerce of Metals, Minerals & Chemicals Importers & Exporters (CCCMC) set up a mediation and consultation mechanism intended to provide a platform for dialogue between affected communities or civil society groups that have raised concerns and Chinese companies.
More than three years since its launch, the mechanism has now received its first two complaints from local communities and many more are considering filing a case, Margaux Day, executive director at the nonprofit Accountability Counsel, told an event hosted by Climate Home News last month.
“This is incredibly exciting in that it fills a governance and accountability gap where often communities who are seeking to protect their rights and the environment can’t reach someone who will respond to them,” she told the panel discussion at London Climate Action Week.
Climate Home News understands that the complaints were filed by communities in Latin America and Southeast Asia over labour rights and resettlement issues. No information about the cases has yet been made public. The mechanism’s secretariat did not respond to Climate Home News’ questions.
The mechanism was set up after the Chinese regulator for banks and insurers called on investor-level institutions to establish complaints bodies to hear from communities outside of China. But whether the new initiative will prove effective in tackling grievances remains an open question.
“Real potential” for better mining practices
Participation in the mechanism is voluntary for Chinese firms and it doesn’t have a fact-finding function, nor can it impose provisions for compensation or compliance with human rights standards.
But Day told Climate Home News that, if successful, it could bring companies to negotiate an outcome that is better for people and the planet and leads to more sustainable mining practice.
Chen Yu, an independent China advisor for campaign group Global Witness, agreed that the mechanism holds “real potential”.
“There exists nothing else at a similar level to promote dialogue between communities and Chinese mining companies in particular,” she said.
For companies, the mechanism opens “a channel for problem-solving and dialogue with communities”, she added, as “Chinese companies often remain cautious of approaching affected communities directly, afraid of making the problem bigger”.
However, Chen said the mechanism remains at an early stage of development, faces resourcing challenges and is not yet sufficiently understood by communities in mining areas or Chinese firms.
To help it address some of these challenges, the secretariat is currently seeking technical support from a range of organisations, including civil society groups. But, Chen said, “it will take time for the mechanism to show its value”.
The post Allegations of harms at China-backed transition minerals projects rise appeared first on Climate Home News.
Allegations of harms at China-backed transition minerals projects rise
Andreas Sieber is head of political strategy at 350.0g. Cat Abreu is director of the International Climate Politics Hub.
From the US abduction of Venezuela’s president at the start of this year to the Iran war which rumbles on, disruption is the new normal for global geopolitics, more often than not linked to conflict over supplies of oil and gas.
Events so far in 2026 – driven largely by the desire of the Trump administration to grab control of fossil fuels around the world – show that the climate community’s approach to energy diplomacy will have to evolve if we are to operate effectively and push for climate action in such a volatile landscape.
Today’s climate and energy governance must be able to cope with trade wars, genocide, fascism, spiralling inequality and challenges to multilateralism. The increasingly dominant paradigms of economic competitiveness, energy security and green industrialisation can help drive the transition but they also challenge our collective mission to deliver an equitable green shift.
US-China rivalry dominates
Longer-term geopolitical trends that are seeing power move from West to East and North to South have fuelled a US–China “superpower rivalry”, which is pulling the global economy apart and reining in trade.
A key question will be how the fracture “lines” are drawn: by the US and China, or also by other countries or blocs? Many governments will try to remain “in the middle” between the two giants to capture economic gains from both sides. Yet despite the language of “strategic autonomy”, Washington and Beijing may be in a position to force choices via market access, export controls and sanctions.
-
Top maritime court rejects bid to halt UN deep-sea mining inquiry
Two subsidiaries of The Metals Company sought to block the probe into potential contract breaches launched after the firm’s application for US-sponsored permits

At first glance, this may not seem particularly relevant for climate and energy politics. But Huawei’s exclusion from 5G operations across the political West and India following the so-called Clean Network Campaign by the US government serves as a warning of what could happen to climate green tech.
And the recent debate to cut out Chinese inverters from European markets follows the same pattern – US security forces perceive a risk and start encouraging their allies to drop Chinese technology.
The new drivers: competition and security
Despite this fracturing geopolitical and economic context, energy transition is still happening. To ensure it is effective and equitable, we need to understand what is driving it and how to adapt climate politics so that it better responds to these drivers.
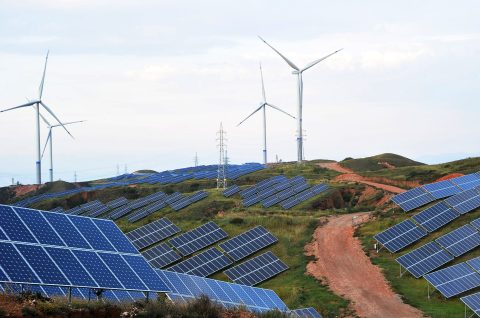
Put simply, China is supplying the world with low-cost renewables (roughly 60% of critical wind and 80% of solar components), batteries, EVs and other key elements. Other countries now also want their piece of the green tech pie and are forming industrial policies to get it.
It is this new competitiveness-driven logic that will shape the quest for decarbonisation, which has shifted from cooperating around the cost of tackling climate change to rivalry for the benefits of climate action.
Over 90% of new renewables projects are now cheaper than fossil alternatives. Gas-fired power is 3–4 times more expensive than solar and wind. In 2015, most decarbonisation policies were “traditional” emissions-cutting strategies like carbon pricing or net zero dates, whereas green industrial policies now underpin the majority.
Iran war could boost fossil fuel phase-out push, says Colombian minister
Meanwhile, security has become a central driver of energy politics. We are living through the second major fossil fuel crisis in just four years. Elevated oil and gas prices will impose up to $1 trillion in additional costs on the global economy by the end of the year if disruption continues in the Strait of Hormuz. Fossil fuel supply chains have exposed countries to conflict, coercion and brutal price shocks.
Fossil fuel volatility destabilises whole economies – higher fuel costs drive up food prices, increase political instability, and push millions into poverty and hunger. This incentivises governments to shield themselves from global shocks, especially in countries that are net fossil fuel importers and home to roughly three-quarters of the world’s population.
Yet security fears can cut both ways. The same instability that makes fossil fuel dependence untenable is also sharpening concern over China’s dominance of critical clean technologies and supply chains.
Equity, cooperation and the opportunity for change
Developing countries benefit from the rapid uptake of renewables enabled by low-cost Chinese technologies. But significant fiscal space and public investment is needed for the electricity grids and infrastructure required to fully unleash the energy transition, as well as for green industrialisation to diversify revenue streams.
Despite this, industrial-scale domestic production and ownership often remain out of reach for too many countries that lack the fiscal space to allow green supply chains to flourish and compete with their traditional industrial base. But more just and diversified green tech supply chains could be achieved with concomitant support.
Can giant batteries unlock Africa’s green industrial future?
For the first time in decades, the international order is being substantially reshaped. If within this context, decarbonisation is increasingly driven by green industrial policy, energy security and competitiveness, the climate policy community must better anticipate where these debates are moving. We must speak the same language, and enter the forums where decisions are made, including security, trade and bilateral or trilateral spaces.
We should build on an enlightened self interest recognising that cooperation remains essential and beneficial. This includes using the UN climate process differently: less as an ever-expanding negotiation machine, and more as a space for norm-setting, political alignment and deal-making. In an age of fragmentation, effective cooperation must not only be framed as necessary but thought of as a strategically compelling source of resilience and shared advantage.
The post Energy transition policymaking must evolve to fit an age of rupture appeared first on Climate Home News.
Energy transition policymaking must evolve to fit an age of rupture
Low-income Indian workers, many of them migrants from rural areas hit by climate change, are paying for worsening extreme heat through lost working days and health complications, with the cost equivalent to 2% of national GDP per year, new research shows.
The International Institute of Environment and Development (IIED), a London-based think-tank, worked with local organisations to survey around 540 households of informal workers in three Indian cities: Ajmer, Delhi and Agra. Most had migrated from rural areas to find work in industries such as construction, brick-making, garment manufacturing and food packaging.
The survey found them struggling through long working days with little access to shade, cooling, rest or water, as well as few toilets for women. And even when they go home, many live in makeshift shelters or airless cramped rooms with barely a single fan, bringing almost no respite.
Outdoor workers are losing about 24 days of work a year due to heat, costing them nearly a tenth of their annual earnings, while indoor workers sacrifice roughly 15 days. On top of losing income, they are also bearing the cost of health problems like heat exhaustion, psychological stress and kidney damage brought on by repeated dehydration.
If the survey’s findings are extrapolated to a national level, the IIED researchers estimate that the decline in productivity and effects of kidney disease combined add up to lost wages of $78 billion each year.
-
Top maritime court rejects bid to halt UN deep-sea mining inquiry
Two subsidiaries of The Metals Company sought to block the probe into potential contract breaches launched after the firm’s application for US-sponsored permits -
Most “zombie credits” locked out of new UN carbon market after China and India snub
Fears of a flood of environmentally-dubious carbon credits have faded, with most old projects not able to transition to new UN market

Vishram Meena, 45, from Alwar in Rajasthan, has worked on construction sites in Ajmer for more than a decade, toiling for 10 to 12 hours a day carrying materials and mixing cement in the full sun.
In May 2024, on one of the hottest days, he collapsed after feeling dizzy and suffering a nosebleed. His wife and colleagues managed to get him to hospital where he was diagnosed with heat stroke. He has since returned to the same building work because the family needs the money.
“I went back because what else could I do? We are not machines. We are human beings. The heat is killing us slowly,” he was quoted as saying in a report on the survey’s findings.
“Victorian-era” conditions
Ritu Bharadwaj, IIED’s director of climate resilience, finance and loss and damage, described some of the stories from workers about their experiences of extreme heat as “genuinely horrifying”.
Kusum, a tailor at a garment manufacturing and export unit in Kapashera, Delhi, recounted how the machines for ironing finished garments are in the same tiny room where workers are making the clothes, with steam and hot air building up through her shift.
Fans are too far apart to move the air and nothing has changed in over a decade, she said, adding that “in summer, the unit feels like a furnace”.
“These are Victorian-era working conditions and they’re completely unacceptable in the 21st century,” said Bharadwaj. She called for stepped-up social protection from the government to pay people for days they are unable work due to heat, as well as micro-insurance schemes with payouts triggered by temperature measurements.
This money would help families buy food and pay medical bills when their income dips if they fall ill or cannot work their usual hours due to soaring temperatures.
Climate change-driven heatwaves hit Delhi’s Red Fort market traders
The aim of the IIED study, Bharadwaj added, is to get policy-makers’ attention by showing the scale of damage extreme heat is doing to India’s GDP in an economy whose growth relies on service-led industries. “If the workers within them start falling sick, you know it’s the economic growth which is going to get impacted,” she told a webinar to present the research.
“Whether [policymakers] care about the workers or not, at least they would care about the GDP, and therefore then invest in their care,” she explained.
Labour code leaves out heat
However, Bharadwaj noted that a 2026 reform to India’s labour law bringing a range of regulations together in one code does not include heat-related protections for workers and only applies to businesses above a certain size. She urged the government to introduce a temperature threshold above which all workers would be able to stop their activities.
IIED and its partners have also carried out a similar study in Bangladesh which will be published later this month, showing that extreme heat is costing its workforce the equivalent of nearly 1.4% of GDP.
Shakirul Islam, chairperson of the Ovibashi Karmi Unnayan Program (OKUP) in Bangladesh, said the government had introduced stricter safety policies for garment-making companies after the Rana Plaza complex collapsed in 2013. But, he said, these rules are rarely followed by manufacturers, especially at the level of smaller subcontractors.
The workers’ welfare centres that do exist are open mainly during work hours so they are difficult to visit. Some companies also make saline water available for heat stress, which is no good for those with high blood pressure, he noted.
For Indian women workers, a just transition means surviving climate impacts with dignity
Archana Shukla Mukherjee, CEO of India’s Change Alliance, which also partnered with IIED on the survey, said it was time to hold both the government and businesses accountable for finding solutions to the intensifying problem of extreme heat’s effects on workers.
She said that employee state insurance schemes should identify heat stroke as an occupational disease while companies along the whole supply chain should start putting in place heat protection measures, including for informal workers and migrants.
If the tools and mechanisms available to help workers do not reach the most vulnerable and marginalised people, “then I think we are not doing something right,” she said.
The post Extreme heat costing India’s poorest workers 2% of GDP, survey finds appeared first on Climate Home News.
Extreme heat costing India’s poorest workers 2% of GDP, survey finds


-
Climate Change11 months ago
Guest post: Why China is still building new coal – and when it might stop
-
Greenhouse Gases11 months ago
Guest post: Why China is still building new coal – and when it might stop
-

 Greenhouse Gases2 years ago
嘉宾来稿:满足中国增长的用电需求 光伏加储能“比新建煤电更实惠”
-

 Climate Change2 years ago
嘉宾来稿:满足中国增长的用电需求 光伏加储能“比新建煤电更实惠”
-
Climate Change2 years ago
Bill Discounting Climate Change in Florida’s Energy Policy Awaits DeSantis’ Approval
-

 Renewable Energy9 months ago
Sending Progressive Philanthropist George Soros to Prison?
-

 Carbon Footprint2 years ago
US SEC’s Climate Disclosure Rules Spur Renewed Interest in Carbon Credits
-
Greenhouse Gases1 year ago
嘉宾来稿:探究火山喷发如何影响气候预测