
Welcome to Carbon Brief’s DeBriefed.
An essential guide to the week’s key developments relating to climate change.
This week
Ceasefire causes oil price drop
CEASEFIRE SLUMP: Following the announcement on Tuesday of a two-week ceasefire agreement between Iran and the US and Israel, oil prices dropped below $96 per barrel, according to the Associated Press. However, price volatility resumed when a Saudi Arabian oil pipeline was hit just hours later, according to Reuters.
CRISIS COMBINED: Reuters and other outlets covered comments made by the International Energy Agency’s Fatih Birol to Le Figaro, where he said that the current energy crisis is worse than those of “1973, 1979 and 2022 combined”. It added that Birol said the “world has never experienced a disruption to energy supply of such magnitude”.
POLLUTERS PROFIT: The Guardian covered how the “worst polluters hold [the] world’s future in their hands as they benefit from higher fossil fuel prices”, but it added “global trends favour renewables”. The South China Morning Post reported that, according to experts, the diversification of energy sources is set to accelerate as the war continues to disrupt the world’s energy supplies.
Around the world
- CLIMATE GOALS PERIL: The UK opening new oil and gas fields in the North Sea “would imperil” international climate goals, experts told the Guardian. The warning came as the government pushed back against the speculation that it is set to approve new drilling projects, according to Sky News.
- COP33 CHANGES: The Indian government has withdrawn its offer to host the COP33 climate summit, “following a review of its commitments for the year 2028”, reported Climate Home News.
- ‘LONG-LASTING’ SHOCK: The Financial Times covered comments by EU energy commissioner Dan Jørgensen that the bloc was bracing for a “long-lasting” energy shock from the Iran war. Reuters reported that five EU countries have called for a windfall tax on energy companies’ profits in response to rising fuel prices.
- US BUDGET CUTS: US president Donald Trump’s 2027 budget proposal included targeting the “green new scam” with substantial cuts to energy and environment programmes, according to the Los Angeles Times.
- AFGHAN FLOODS: Since 26 March, at least 148 people have died and 216 have been injured due to heavy rains, floods, earthquakes and landslides in Afghanistan, reported Reuters.
- PENGUINS ENDANGERED: The “mass drowning” of emperor penguin chicks as sea ice melts due to climate change has led the International Union for Conservation of Nature to declare the species officially in danger of extinction, according to the Guardian.
86,120
The record number of battery electric vehicle sales registered in the UK in March, making up 22.6% of the total car market, according to the Society of Motor Manufacturers and Traders.
Latest climate research
- More than a quarter of the world’s population will face more frequent and severe hot-and-dry extreme events by 2100 under current climate policies | Geophysical Research Letters
- Climate change will increase wildfire exposure for nearly 10,000 species by the end of the century | Nature Climate Change
- A variety of climate hazards critically expose up to 30% of southern Africa to “environmental degradation” | PLOS One
(For more, see Carbon Brief’s in-depth daily summaries of the top climate news stories on Tuesday, Wednesday, Thursday and Friday.)
Captured
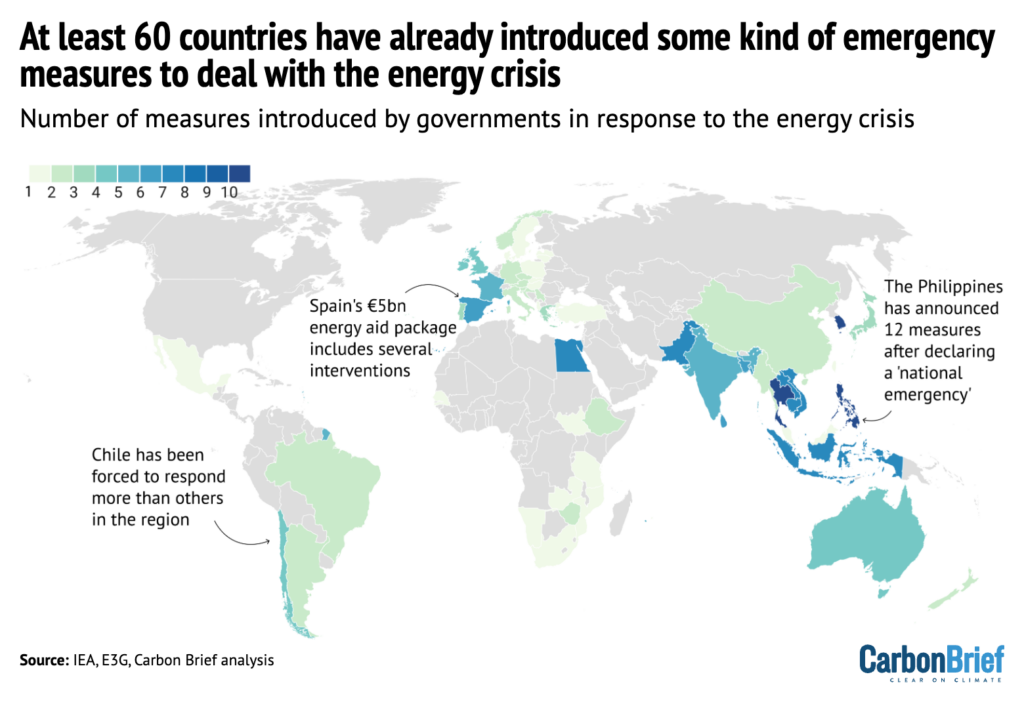
Carbon Brief analysis found that, since the beginning of the Iran war in late February, at least 60 countries have announced nearly 200 emergency energy-saving measures. Around 30 nations, from Norway to Zambia, have cut fuel taxes to help people struggling with rising costs, making this by far the most common domestic policy response to the crisis, said the analysis. Some countries have stressed the need to boost domestic renewable-energy construction, while others – including Japan, Italy and South Korea – have opted to lean more on coal, at least in the short term.
Spotlight
How drag is tackling climate change
This week, Carbon Brief looks at how some drag artists are using their performances to draw attention to climate change
Back in 2005, veteran climate journalist Bill McKibben wrote that “what the warming world needs now is art, sweet art” to help “build a general consciousness about climate change”.
Since then, the topic of climate change has spread to a host of art forms, from literature and music through to comedy and film.
One of the most recent art forms to take up the climate communication baton is drag, with performers using it as a “Trojan horse” to engage with audiences, according to Cheddar Gorgeous, a British drag performer.
‘Joy inspires momentum’
Drag artists around the world have begun to draw attention to the climate movement, using creativity, entertainment and their platforms to engage with their audiences.
In the UK, Cheddar Gorgeous declined a nomination for the British LGBT Awards due to its sponsorship by Shell and has made repeated calls for climate action.
Speaking on the “climate quickie” TEDx podcast, she argued:
“Drag can disrupt the master narratives that dictate our society. I love drag that makes you look at yourself and look at the world in a different way. And that can be deployed in all sorts of exciting ways.”
Drag has a proud history of disruption. As part of a TED talk titled, “Why joy is a serious way to take action”, US drag queen Pattie Gonia provided the audience with some “herstory” about the role of drag within protests. She said:
“Since the birth of the queer rights movement, drag performers and trans people have always been on the forefront of organising and protesting and community building.
“When we had the statistics and the facts on the millions of queer people dying of AIDS, yet no one was joining our fight, drag performers turned pain into joy and, in doing so, welcomed millions more people to fight with us.”

Pattie Gonia is arguably the best-known drag artist to engage with climate change. She is currently touring her environmental drag show “SAVE HER!” and has, according to her website, fundraised more than “$4.7m for LGBTQIA+, BIPOC and environmental non-profits”.
A key part of her message is the need for diversity and inclusion within the climate movement, adding that “our creativity is critical in this climate dilemma”. In her TED talk, she added:
“The problem in the climate movement isn’t just the abundance of carbon; it is the lack of joy. The scientific facts, the doom and gloom, they scare people, they wake them up. But joy is what will get people out of bed every day to take more action.”
Alongside Pattie Gonia, climate conversations are filtering into the wider drag movement, including being a topic repeatedly touched on in the highly successful TV drag contest, RuPaul’s Drag Race.
This ranges from drag artist Asia O’Hara explaining what global warming is in season 10 – telling her fellow contestants: “Bitch, the ice is melting!” – to queens dancing to “97% of scientists and four out of four Drag Race judges agree” that climate change “is real” during a challenge in season 11. (Drag Race host RuPaul Andre Charles has faced criticism for reportedly allowing fracking on his Wyoming ranch.)
Drag is opening up the climate movement to a wider audience, promoting diversity, inclusion and creativity in the space, according to its advocates. For Pattie Gonia, a key part of climate action has to be joy, she added:
“Joy provides an unbelievable opportunity to make the climate movement irresistible. Do not underestimate the power of joy. We deserve more than doom and gloom, because this is the only planet with a Beyoncé on it.”
Watch, read, listen
COOPERATION OVER CHAOS: In the Indian Express, Simon Stiell, the executive secretary of UN Climate Change, argued that “climate cooperation offers a way out of energy price chaos”.
ELECTRIC WORLD ORDER: On the Polycrisis podcast, Mark Blyth, a professor of international economics at Brown University, and Dr Naa Adjekai Adjei, a non-resident fellow, Africa, at the China Global South Project, discussed “what the US dollar has to do” with energy access in Africa.
‘THE RECKONING’: In the Equator, Mona Ali, associate professor of economics at the State University of New York, explored the closure of the Strait of Hormuz and the “end of American hegemony”.
Coming up
- 12 April: Hungarian elections
- 12 April: Peruvian elections
- 13-18 April: World Bank and International Monetary Fund Spring Meetings, Washington, DC, US
- 14 April: IEA Oil Market Report launch
Pick of the jobs
- Global Witness, several climate change jobs | Salary: Varied. Location: London
- London School of Economics, policy fellow – climate, gender and inclusivity | Salary: £53,949-£62,160. Location: London
- Climate Group, senior manager, international policy and advocacy | Salary: £47,160-£49,930. Location: London
- WWF, Nedbank green trust manager | Salary: Unknown. Location: Cape Town or Johannesburg, South Africa
- Greenpeace Australia Pacific, creative producer | Salary: AU$101,272. Location: Australia
- The Fairness Project, climate policy researcher | Salary: $96,000. Location: Remote (US)
DeBriefed is edited by Daisy Dunne. Please send any tips or feedback to debriefed@carbonbrief.org.
This is an online version of Carbon Brief’s weekly DeBriefed email newsletter. Subscribe for free here.
The post DeBriefed 10 April 2026: Worst energy crisis ‘ever’ | India withdraws COP33 bid | Drag artists and climate change appeared first on Carbon Brief.
Andreas Sieber is head of political strategy at 350.0g. Cat Abreu is director of the International Climate Politics Hub.
From the US abduction of Venezuela’s president at the start of this year to the Iran war which rumbles on, disruption is the new normal for global geopolitics, more often than not linked to conflict over supplies of oil and gas.
Events so far in 2026 – driven largely by the desire of the Trump administration to grab control of fossil fuels around the world – show that the climate community’s approach to energy diplomacy will have to evolve if we are to operate effectively and push for climate action in such a volatile landscape.
Today’s climate and energy governance must be able to cope with trade wars, genocide, fascism, spiralling inequality and challenges to multilateralism. The increasingly dominant paradigms of economic competitiveness, energy security and green industrialisation can help drive the transition but they also challenge our collective mission to deliver an equitable green shift.
US-China rivalry dominates
Longer-term geopolitical trends that are seeing power move from West to East and North to South have fuelled a US–China “superpower rivalry”, which is pulling the global economy apart and reining in trade.
A key question will be how the fracture “lines” are drawn: by the US and China, or also by other countries or blocs? Many governments will try to remain “in the middle” between the two giants to capture economic gains from both sides. Yet despite the language of “strategic autonomy”, Washington and Beijing may be in a position to force choices via market access, export controls and sanctions.
-
Top maritime court rejects bid to halt UN deep-sea mining inquiry
Two subsidiaries of The Metals Company sought to block the probe into potential contract breaches launched after the firm’s application for US-sponsored permits

At first glance, this may not seem particularly relevant for climate and energy politics. But Huawei’s exclusion from 5G operations across the political West and India following the so-called Clean Network Campaign by the US government serves as a warning of what could happen to climate green tech.
And the recent debate to cut out Chinese inverters from European markets follows the same pattern – US security forces perceive a risk and start encouraging their allies to drop Chinese technology.
The new drivers: competition and security
Despite this fracturing geopolitical and economic context, energy transition is still happening. To ensure it is effective and equitable, we need to understand what is driving it and how to adapt climate politics so that it better responds to these drivers.
Put simply, China is supplying the world with low-cost renewables (roughly 60% of critical wind and 80% of solar components), batteries, EVs and other key elements. Other countries now also want their piece of the green tech pie and are forming industrial policies to get it.
It is this new competitiveness-driven logic that will shape the quest for decarbonisation, which has shifted from cooperating around the cost of tackling climate change to rivalry for the benefits of climate action.
Over 90% of new renewables projects are now cheaper than fossil alternatives. Gas-fired power is 3–4 times more expensive than solar and wind. In 2015, most decarbonisation policies were “traditional” emissions-cutting strategies like carbon pricing or net zero dates, whereas green industrial policies now underpin the majority.
Iran war could boost fossil fuel phase-out push, says Colombian minister
Meanwhile, security has become a central driver of energy politics. We are living through the second major fossil fuel crisis in just four years. Elevated oil and gas prices will impose up to $1 trillion in additional costs on the global economy by the end of the year if disruption continues in the Strait of Hormuz. Fossil fuel supply chains have exposed countries to conflict, coercion and brutal price shocks.
Fossil fuel volatility destabilises whole economies – higher fuel costs drive up food prices, increase political instability, and push millions into poverty and hunger. This incentivises governments to shield themselves from global shocks, especially in countries that are net fossil fuel importers and home to roughly three-quarters of the world’s population.
Yet security fears can cut both ways. The same instability that makes fossil fuel dependence untenable is also sharpening concern over China’s dominance of critical clean technologies and supply chains.
Equity, cooperation and the opportunity for change
Developing countries benefit from the rapid uptake of renewables enabled by low-cost Chinese technologies. But significant fiscal space and public investment is needed for the electricity grids and infrastructure required to fully unleash the energy transition, as well as for green industrialisation to diversify revenue streams.
Despite this, industrial-scale domestic production and ownership often remain out of reach for too many countries that lack the fiscal space to allow green supply chains to flourish and compete with their traditional industrial base. But more just and diversified green tech supply chains could be achieved with concomitant support.
Can giant batteries unlock Africa’s green industrial future?
For the first time in decades, the international order is being substantially reshaped. If within this context, decarbonisation is increasingly driven by green industrial policy, energy security and competitiveness, the climate policy community must better anticipate where these debates are moving. We must speak the same language, and enter the forums where decisions are made, including security, trade and bilateral or trilateral spaces.
We should build on an enlightened self interest recognising that cooperation remains essential and beneficial. This includes using the UN climate process differently: less as an ever-expanding negotiation machine, and more as a space for norm-setting, political alignment and deal-making. In an age of fragmentation, effective cooperation must not only be framed as necessary but thought of as a strategically compelling source of resilience and shared advantage.
The post Energy transition policymaking must evolve to fit an age of rupture appeared first on Climate Home News.
Energy transition policymaking must evolve to fit an age of rupture
Low-income Indian workers, many of them migrants from rural areas hit by climate change, are paying for worsening extreme heat through lost working days and health complications, with the cost equivalent to 2% of national GDP per year, new research shows.
The International Institute of Environment and Development (IIED), a London-based think-tank, worked with local organisations to survey around 540 households of informal workers in three Indian cities: Ajmer, Delhi and Agra. Most had migrated from rural areas to find work in industries such as construction, brick-making, garment manufacturing and food packaging.
The survey found them struggling through long working days with little access to shade, cooling, rest or water, as well as few toilets for women. And even when they go home, many live in makeshift shelters or airless cramped rooms with barely a single fan, bringing almost no respite.
Outdoor workers are losing about 24 days of work a year due to heat, costing them nearly a tenth of their annual earnings, while indoor workers sacrifice roughly 15 days. On top of losing income, they are also bearing the cost of health problems like heat exhaustion, psychological stress and kidney damage brought on by repeated dehydration.
If the survey’s findings are extrapolated to a national level, the IIED researchers estimate that the decline in productivity and effects of kidney disease combined add up to lost wages of $78 billion each year.
-
Top maritime court rejects bid to halt UN deep-sea mining inquiry
Two subsidiaries of The Metals Company sought to block the probe into potential contract breaches launched after the firm’s application for US-sponsored permits -
Most “zombie credits” locked out of new UN carbon market after China and India snub
Fears of a flood of environmentally-dubious carbon credits have faded, with most old projects not able to transition to new UN market

Vishram Meena, 45, from Alwar in Rajasthan, has worked on construction sites in Ajmer for more than a decade, toiling for 10 to 12 hours a day carrying materials and mixing cement in the full sun.
In May 2024, on one of the hottest days, he collapsed after feeling dizzy and suffering a nosebleed. His wife and colleagues managed to get him to hospital where he was diagnosed with heat stroke. He has since returned to the same building work because the family needs the money.
“I went back because what else could I do? We are not machines. We are human beings. The heat is killing us slowly,” he was quoted as saying in a report on the survey’s findings.
“Victorian-era” conditions
Ritu Bharadwaj, IIED’s director of climate resilience, finance and loss and damage, described some of the stories from workers about their experiences of extreme heat as “genuinely horrifying”.
Kusum, a tailor at a garment manufacturing and export unit in Kapashera, Delhi, recounted how the machines for ironing finished garments are in the same tiny room where workers are making the clothes, with steam and hot air building up through her shift.
Fans are too far apart to move the air and nothing has changed in over a decade, she said, adding that “in summer, the unit feels like a furnace”.
“These are Victorian-era working conditions and they’re completely unacceptable in the 21st century,” said Bharadwaj. She called for stepped-up social protection from the government to pay people for days they are unable work due to heat, as well as micro-insurance schemes with payouts triggered by temperature measurements.
This money would help families buy food and pay medical bills when their income dips if they fall ill or cannot work their usual hours due to soaring temperatures.
Climate change-driven heatwaves hit Delhi’s Red Fort market traders
The aim of the IIED study, Bharadwaj added, is to get policy-makers’ attention by showing the scale of damage extreme heat is doing to India’s GDP in an economy whose growth relies on service-led industries. “If the workers within them start falling sick, you know it’s the economic growth which is going to get impacted,” she told a webinar to present the research.
“Whether [policymakers] care about the workers or not, at least they would care about the GDP, and therefore then invest in their care,” she explained.
Labour code leaves out heat
However, Bharadwaj noted that a 2026 reform to India’s labour law bringing a range of regulations together in one code does not include heat-related protections for workers and only applies to businesses above a certain size. She urged the government to introduce a temperature threshold above which all workers would be able to stop their activities.
IIED and its partners have also carried out a similar study in Bangladesh which will be published later this month, showing that extreme heat is costing its workforce the equivalent of nearly 1.4% of GDP.
Shakirul Islam, chairperson of the Ovibashi Karmi Unnayan Program (OKUP) in Bangladesh, said the government had introduced stricter safety policies for garment-making companies after the Rana Plaza complex collapsed in 2013. But, he said, these rules are rarely followed by manufacturers, especially at the level of smaller subcontractors.
The workers’ welfare centres that do exist are open mainly during work hours so they are difficult to visit. Some companies also make saline water available for heat stress, which is no good for those with high blood pressure, he noted.
For Indian women workers, a just transition means surviving climate impacts with dignity
Archana Shukla Mukherjee, CEO of India’s Change Alliance, which also partnered with IIED on the survey, said it was time to hold both the government and businesses accountable for finding solutions to the intensifying problem of extreme heat’s effects on workers.
She said that employee state insurance schemes should identify heat stroke as an occupational disease while companies along the whole supply chain should start putting in place heat protection measures, including for informal workers and migrants.
If the tools and mechanisms available to help workers do not reach the most vulnerable and marginalised people, “then I think we are not doing something right,” she said.
The post Extreme heat costing India’s poorest workers 2% of GDP, survey finds appeared first on Climate Home News.
Extreme heat costing India’s poorest workers 2% of GDP, survey finds
A United Nations investigation into deep-sea mining firms will continue after the world’s top maritime court rejected their bid to suspend the inquiry triggered by a US-backed push to extract critical minerals from the ocean floor.
In two orders issued on Saturday, the International Tribunal for the Law of the Sea (ITLOS) declined to halt an inquiry launched by the International Seabed Authority (ISA) into whether permit holders, including Tonga Offshore Mining Ltd (TOML) and Nauru Ocean Resources Inc (NORI), have breached their obligations under UN exploration contracts.
The two companies are subsidiaries of Canadian firm The Metals Company (TMC), which earlier this year sought permits from the United States to commercially mine the deep seabed in an area already covered by its UN exploration licences, bypassing the ISA’s regulatory process.
The inquiry was opened after TMC’s move raised questions over whether its subsidiaries had complied with their contractual obligations to the ISA, which regulates mining in international waters under the UN Convention on the Law of the Sea. TOML and NORI sued the ISA last June for allegedly targeting them “in breach of due process” and without “good faith”.
-
UN seabed regulator defends authority as mining firms seek to halt inquiry
Campaigners accused deep-sea mining frontrunner The Metals Company of obstructing an inquiry into its subsidiaries. The firm says it is being targeted without procedural basis -
Flood deaths in West African cities raise fraught issue of slum evictions
Deadly floods expose poor urban planning, over-population and spread of informal settlements on disaster-prone land – a problem authorities are struggling to manage -
Most “zombie credits” locked out of new UN carbon market after China and India snub
Fears of a flood of environmentally-dubious carbon credits have faded, with most old projects not able to transition to new UN market


While allowing the inquiry to proceed, the court ordered the ISA to ensure the companies receive due process. Judges said the regulator must explain the factual and legal basis of its inquiry, clarify the procedures being followed and provide TOML and NORI with a meaningful opportunity to respond.
The companies seeks to mine an area called the Clarion-Clipperton Zone, which holds vast reserves of critical minerals like nickel, manganese and rare earths but is also home to a little-studied deep ocean ecosystem with thousands of unnamed species.
In response to the court’s ruling, the ISA welcomed the decision, saying the inquiry “remains in effect” and would continue “with due regard to all applicable legal requirements”.
Last week, during an annual meeting of its member governments, ISA secretary-general Leticia Carvalho said the resources in the ocean floor are “the common heritage of humankind” and upheld the agency’s role as “more important than ever”.
TMC also welcomed the court decision in a statement and claimed that judges ruled to “protect the rights of TMC subsidiaries”.
“Contractors like NORI and TOML, who have together spent hundreds of millions of dollars on the promise of a fair regulatory framework, should be informed of the factual and legal basis of any non-compliance inquiries, understand the procedure being applied, and receive a meaningful opportunity to respond,” said Gerard Barron, CEO of The Metals Company.

Environmental groups said the ruling allows scrutiny of the companies’ actions to continue.
Louisa Casson, deep-sea mining campaigner with Greenpeace, said the “entire litigation has been an egregious waste of time and money”, which was part of the industry’s “textbook distraction tactic” meant to delay the consequences of the inquiry.
“If the inquiry confirms that TMC’s subsidiaries are breaching their contracts, governments must send the strongest possible signal that complicity in unlawful deep sea mining will not be tolerated,” she said.
While investigation is still ongoing, NORI’s contract is set to expire this week and is up for review. Governments asked the ISA to report back and make “make appropriate recommendations” by the next ISA assembly, its main decision-making body set to take place next week from July 27 to 31.
The court ordered both the ISA and TMC to submit a report on how they complied with the ruling by August 31, and called on both to “cooperate and refrain from any action that might lead to
aggravating the dispute”.
The post Top maritime court rejects bid to halt UN deep-sea mining inquiry appeared first on Climate Home News.
Top maritime court rejects bid to halt UN deep-sea mining inquiry


-
Climate Change11 months ago
Guest post: Why China is still building new coal – and when it might stop
-
Greenhouse Gases11 months ago
Guest post: Why China is still building new coal – and when it might stop
-

 Greenhouse Gases2 years ago
嘉宾来稿:满足中国增长的用电需求 光伏加储能“比新建煤电更实惠”
-

 Climate Change2 years ago
嘉宾来稿:满足中国增长的用电需求 光伏加储能“比新建煤电更实惠”
-
Climate Change2 years ago
Bill Discounting Climate Change in Florida’s Energy Policy Awaits DeSantis’ Approval
-

 Renewable Energy9 months ago
Sending Progressive Philanthropist George Soros to Prison?
-

 Carbon Footprint2 years ago
US SEC’s Climate Disclosure Rules Spur Renewed Interest in Carbon Credits
-
Greenhouse Gases1 year ago
嘉宾来稿:探究火山喷发如何影响气候预测