


The copper market is seeing big changes lately. A short-term trade truce between the US and China has helped push copper prices up, giving investors some relief. At the same time, China is producing more refined copper than ever before.
But there’s a problem, there isn’t enough copper ore to meet demand. Even with record imports, supply is still tight. With inflation and global growth concerns still hanging around, the market remains on edge.
Let’s study deeper…
Copper Prices Rally on Eased Trump’s Tariff Tensions
COMEX July Futures: Copper futures for July delivery are trading at approximately $4.68 per pound (or $10,296 per tonne), reflecting a 1.3% increase following the recent US-China trade truce.
This boost came after a temporary easing in trade tensions between the US and China. Investors welcomed the news, anticipating smoother trade flows and fewer disruptions in global commodity markets.

What’s Driving the Copper Price Surge?
Elaborating further, both countries have rolled back tariffs for the next 90 days. US tariffs on Chinese goods dropped to 30%, while China cut its tariffs on US imports to 10%. This move has created a positive ripple effect across commodities, stocks, and currencies.
According to media sources, US Treasury Secretary Scott Bessent described the agreement as a “very good framework” and stressed that the US is not seeking full economic decoupling from China. This statement helped further calm market fears.
Another significant factor that pushed up copper prices was China’s record-high imports in April. The world’s largest copper consumer imported nearly 3 million tonnes of copper concentrate last month. Experts predict that this increase could ease supply tightness and help local smelters, which have been struggling with low ore availability.
Challenges Still Persist for Chinese Copper Smelters
While China’s copper imports have surged, its smelters remain under pressure. According to Discovery Alert, spot treatment charges turned negative in December and fell further to -$57.50 per tonne by early May. Smelters are now paying to process ore, which is a sign of tight supply and intense competition.
China’s refined copper production has hit all-time highs, even though copper ore remains in short supply. The situation worsened due to a two-month export halt at Indonesia’s PT Freeport mine and a smelter shutdown in the Philippines. Both events tightened global supply but later helped China when ore flow resumed.
According to Mysteel Global analyst Li Chengbin, Chinese plants are better prepared this year, securing long-term contracts and benefiting from resumed exports out of Indonesia.
A Look Back: The Copper Price Shakeup
Just days before the trade truce, copper prices took a hit. On April 4, Bloomberg reported a sharp decline in both copper and global equity markets. On the London Metal Exchange, prices dropped as much as 7.7%, briefly reaching $8,735 per tonne before rebounding slightly.
Earlier, traders had rushed to ship copper into the US to avoid rising tariffs. Premiums surged to $500 per tonne. Major firms like Mercuria and Trafigura had predicted copper prices could hit $12,000 per tonne. But when the US unexpectedly shortened the tariff deadline, buyers were caught off guard, and stockpiles began piling up outside US ports.

Copper Market Outlook 2025–2026
The International Copper Study Group (ICSG) shared its latest copper forecast during a meeting held on April 25, 2025, in Lisbon. Both mine and refined copper production are expected to see solid growth through 2026.
ICSG expects a surplus of about 289,000 tonnes for 2025, slightly higher than the surplus of 194,000 tonnes forecast last September. It’s a surplus of about 209,000 tonnes is currently expected for 2026. This is attributed to weak global demand, particularly influenced by U.S. tariff policies.
Mine Production on the Rise
In 2025, global copper mine production is projected to increase by 2.3%, reaching around 23.5 million tons. This growth will be driven mainly by the continued ramp-up of major projects like Kamoa in the Democratic Republic of Congo (DRC) and Oyu Tolgoi in Mongolia, along with the commissioning of the new Malmyz mine in Russia.
However, some of these gains will be partially offset by expected output declines in Australia, Indonesia, and Kazakhstan.
For 2026, the ICSG expects a slightly higher growth rate of 2.5%. This will be supported by ongoing capacity expansion, particularly in China, as well as an expected recovery in Indonesia and improved output from Chile and Zambia.
Additionally, several smaller mining operations and mid-sized projects in countries like Brazil, Iran, Uzbekistan, Ecuador, Eritrea, Greece, Angola, and Morocco will contribute to the overall production increase.

Refined Copper Output Expanding
Refined copper production is forecast to rise by about 2.9% in 2025. The increase will be fueled by continued capacity expansion in China and new refining operations starting in Indonesia, India, and the DRC.
Growth in 2026 is expected to slow slightly to 1.5%, but output will still benefit from ongoing upgrades and new capacity additions across several countries.
In short, the global copper market is on a growth path, with new projects and recovering output in key regions setting the stage for steady production gains through 2026.

Other Forecasts
-
Long-Term Price Predictions: According to LongForecast, copper prices are expected to average around $4.535 per pound in May 2025, with potential fluctuations ranging from $4.180 to $4.896.
-
Goldman Sachs has revised its copper price forecast for Q2 2025 to $9,330 per tonne, up from the previous estimate of $8,620, citing shifts in the global metals market.
The US-China trade truce has breathed new life into the copper market, lifting prices and calming investor nerves. China’s record copper imports have also helped support global demand. But the road ahead is still uncertain. All in all, inflation, interest rates, and economic growth will all play a role in copper’s next move.
- FURTHER READING: Copper Crunch! How Trump’s Tariffs and Supply Shocks Drive Prices Up
The post Copper Prices Surge to $10,296/Tonne as US-China Truce Sparks Market Rally appeared first on Carbon Credits.

For most companies, the largest figure in the carbon inventory is not the office, the vehicle fleet, or the electricity bill. It sits upstream, in the goods and materials a business buys to make and sell its products. These purchased inputs form the bulk of a company’s Scope 3 emissions, which routinely exceeds everything the business controls directly, and can add up to 90% of their global footprint.

Carbon Footprint
Unlike A.I., climate change’s existential threat is not hypothetical. It is killing people now.”
Leah Stokes, professor of environmental politics at U-C, Santa Barbara, in New York Times, The Big Threat Has Been Climate Change. Now Comes A.I., Sept. 22.
I composed this essay over much of 2026, as I was writing Beyond Vogtle — my detailed study (co-authored with James Boucher) of U.S. nuclear costs from the 1980s post-Three Mile Island reactors to the Vogtle 3 and 4 units completed earlier in this decade. It traces my journey from nuclear power doubter to proponent.
My story is both general and personal: what was changing in the wide world of nuclear power, energy policy and climate; and how I viewed those changes. I hope this mode of story-telling resonates with a wide audience and also provide a backdrop to “Beyond Vogtle.”
It’s in three parts.

Detail from 1979 rally poster. Full poster appears below.
The first installment begins at the big Washington rally called to mark the Three Mile Island reactor accident, and covers the recession of nuclear dread, the advent of virtually always-on reactor operation, and nuclear’s status as the least carbon-emitting energy supply technology.
Installment #2 begins with the failure (to date) of carbon tax advocacy — “A Climate Cure No One Wanted” — and continues with the closure of Indian Point and the concurrent slow dissolve of my dream that renewable energy could do it all.
The third and final installment begins with a slight detour in which I contrast the appalling human damage from automobility with nuclear power’s increasingly remote dangers, and then return to energy policy with a fresh way to regard nuclear power’s potential contribution to decarbonizing U.S. grids.
Thank for reading. Enjoy. And be sure to look at Beyond Vogtle: What History Tells Us About the Cost of New Nuclear (yes, that’s the full title).
— C.K.
* * * * * * * * *
I’m pro-nuclear power. Big time.
I don’t just want the U.S. to keep running its 95 extant reactors. I want us to build more. Lots more. Hundreds.
I’m not alone. Public opinion is shifting toward nuclear power. But I came to that conclusion after spending years arguing the other side. From the mid-1970s to the late 1980s, I published a raft of critical analyses that got a good deal of public attention ― and even some traction within the nuclear industry itself. My core argument was that the cost of building nuclear plants was rising much faster than the costs of competing sources of energy. The main driver, I said, was a cascade of safety-requirement changes triggered by widespread fears of reactor accidents.

Here’s the full poster.
That work earned me a speaking spot at the massive May 6, 1979 rally in Washington demanding a halt to reactor construction in the wake of the March 28 meltdown at Three Mile Island in Pennsylvania. In the weeks before the rally, my research was cited in hundreds of news stories. At the Capitol, I stood alongside consumer advocate Ralph Nader, the leading figure in the U.S. antinuke movement; actress Jane Fonda, whose new film, “The China Syndrome,” had eerily foretold the Three Mile Island meltdown; and folk-rock icon Jackson Browne. I told the cheering throng that nuclear power was finished.
Cost overruns and canceled reactor projects were putting billions of dollars on the line, and I spent much of the next decade in courtrooms all over the country, explaining patiently to utility regulators why investors, not customers, should bear those losses. I eventually moved on to other public policy work, sparking big-city bicycling and helping bring congestion pricing to New York. But I kept watching nuclear power and the broader energy landscape. Over time, what I saw led me to turn from skeptic to supporter. Here’s why, in eight parts.
1. Fear and Dread Recede
Ask 100 random people today what “TMI” means, and at least 90 will say “Too Much Information.” Maybe one will mention the 1979 accident at Three Mile Island.
That’s a real shift.
The 1970s were commercial nuclear power’s first decade, and the Three Mile Island accident brought it to a terrifying close. Sixty hours into the slow-unfolding crisis, as fears grew that a “hydrogen bubble” in the reactor might explode and rupture the containment dome, CBS Evening News anchor Walter Cronkite captured the nation’s dread: “The world has never known a day quite like today. It faced the considerable uncertainties and dangers of the worst nuclear power plant accident of the atomic age. And the horror tonight is that it could get much worse.”[1]
The stricken reactor was eventually stabilized. But a combination of soaring costs and public apprehension brought an end to nuclear power’s rapid expansion in the United States.
Cronkite’s warning was about Three Mile Island itself, but it seemed to foreshadow more disasters to come. Yet since 1979, the U.S. nuclear industry has accumulated nearly 20 times as much reactor operating experience as it had built up in its entire history before the meltdown, without a sequel.[2] Like the dog that didn’t bark, this quiet fadeout of reactor calamities is an overlooked shift ― and it is prompting a rethink of long-held certitudes about nuclear power.
With each passing year there are fewer people who grew up with dread from Cold War-era A-bomb drills and weapons test fallout that got bundled into nuclear power. There are more young people like Zeke, a Brooklyn high-schooler who in 2019 went to Battery Park City to greet climate activist Greta Thunberg after her sail-powered trans-Atlantic voyage, but who this past May called fears about nuclear power “over-exaggerated.”[3] (Thunberg herself has said that Germany made a mistake by phasing out its nuclear plants, since it led to a sharp rise in coal-fired electricity.)
I’ve heard the same sentiment in hundreds of casual conversations over the past decade ― at climate rallies and on Trader Joe’s checkout lines, in California and in New York. These conversations suggest that the oppositional currents that once compelled federal nuclear regulators to keep piling on costly new safety requirements are losing force.
2. Permanent Peak Performance
Even before construction costs began to soar in the 1970s, nuclear power had another Achilles heel: spotty operating performance.
Throughout the 1970s and 1980s, the U.S. nuclear power sector struggled to maintain even a 60 percent “capacity factor” ― a measure of how much of a plant’s potential output it generates. That’s a dismal rate for equipment that’s expensive to build. I know this because I researched and wrote the first full-length study of shortfalls in U.S. nuclear plant performance, in 1976.[4]
That started to change in the mid-1980s. Plants finished safety upgrades required after Three Mile Island. The industry began sharing best practices ― and mistakes to avoid. Economic incentives helped too, as utility earnings became tied to how often plants actually ran.
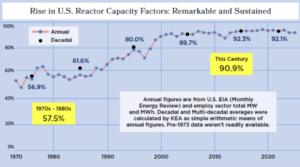
A remarkable turnaround, though seldom credited in climate and nuclear discourse.
The turnaround has been dramatic. Since 2000, U.S. nuclear plants have averaged 90 percent capacity factor ― a huge leap from the earlier 60 percent. In effect, downtime has dropped four-fold, from 40 percent of the time to just 10 percent. Repair jobs and retrofits that used to drag on are now precision-scheduled like the train heist in “Breaking Bad.”
The higher reliability brings a huge symbolic benefit. In the 1970s, U.S. reactors seemed to stumble from one fiasco to the next. In Alabama, a technician using a lit candle to locate an air leak started a fire that burned through a thousand cables and knocked two brand-new reactors offline for 19 months. At some ocean-cooled plants, saltwater corroded delicate heat-transfer tubes, forcing protracted repairs. Profits and industry morale took a beating, and nuclear power became a punchline on “The Simpsons.”
Those days are long past. Nuclear power, uniquely, has blossomed into both grid bulwark and climate hero. Thanks to those higher ― much higher! ― capacity factors, each nuclear plant now displaces 50 percent more carbon-emitting power generation than it used to.[5] In fact, at a 90 percent capacity factor, a kilowatt of nuclear power delivers double or triple the climate benefit of a kilowatt of wind power (which averages 30 to 40 percent capacity factor) and roughly five times that of solar (15 to 20 percent) ― a crucial distinction that’s often missing from gushing coverage of renewable energy.
3. Climate to the Fore
Nuclear power’s newfound operational mastery would matter much less but for the urgency of the climate crisis and the persistence of U.S. and global carbon emissions. Like wind and solar, nuclear power generates electricity without burning carbon.
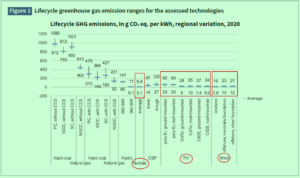
Squint to see that nuclear lifecycle greenhouse gas emissions range from 5.1 to 6.4 (in g CO2 equivalent per kWh); analogous range for solar-PV is 7.4 – 83.0; wind, 7.8 – 23.0. Source, Dinon et al., in report linked in this section’s second paragraph.
It is true that fossil fuels are implicated in nuclear power’s supply chain. Uranium mining uses petroleum, and enriching nuclear fuel requires electricity. But even counting upstream carbon, nuclear power’s climate footprint is smaller than that of wind, solar or hydropower, according to an authoritative 2022 analysis by a multinational team for the UN Economic Commission for Europe. (Their finding matched that of the similarly comprehensive 2018 report by the UN-chartered Intergovernmental Panel on Climate Change.[6])
That’s another big change. In nuclear power’s early years, uranium fuel enrichment was so energy-intensive that the three U.S. “gaseous diffusion” plants were said to consume 10 percent of all electricity used by American factories. But diffusion enrichment has given way to gas centrifuges and, more recently, laser isotopic separation ― methods that use 20 times less energy to isolate fissile U-235 from U-238.
The bottom line: kilowatt-hour for kilowatt-hour, nuclear-generated electricity is at least as effective as solar and wind at cutting climate pollution. Meanwhile, Hurricane Katrina, Superstorm Sandy, “heat domes” and wildfires, and, in August, the first Himalayan glacial collapse, have made once-hypothetical climate death and disruption a daily reality. More than rising electricity demand from A.I., it’s the climate crisis that’s driving renewed interest in nuclear power.
Click here for the second installment, Why I’m Pro-Nuke Now: Beginning.
[1] Quoted passage is from a local (PA) news site, though the an archived Channel 2 broadcast it cited is no longer on line.
[2] The sole “near-miss,” and a major one, was the 2002 discovery by operators at the Davis-Besse nuclear plant near Toledo, OH of extensive corrosion of the reactor vessel head — a vital barrier against loss of coolant and release of radiation. The U.S. General Accounting Office sternly rebuked the Nuclear Regulatory Commission for failing to identify and prevent the corrosion. See GAO, Nuclear Regulation: NRC Needs to More Aggressively and Comprehensively Resolve Issues Related to the Davis-Besse Nuclear Power Plant’s Shutdown, GAO-04-415, May 2004.
[3] In-person conversation at People’s Policy Conference at the New School for Social Research in New York, May 2, 2026.
[4] C. Komanoff, Power Plant Performance: Nuclear and Coal Capacity Factors and Economics (15 MB pdf), Council on Economic Priorities, 1976.
[5] Dividing today’s 90% uptime by the former 60% yields 1.50, indicating 50 percent more kilowatt-hours per kW.
[6] IPCC Annex III report, Technology-Specific Cost and Performance Parameters, 2018. See table on p. 1333.



-
Climate Change1 year ago
Guest post: Why China is still building new coal – and when it might stop
-

 Greenhouse Gases2 years ago
嘉宾来稿:满足中国增长的用电需求 光伏加储能“比新建煤电更实惠”
-
Greenhouse Gases1 year ago
Guest post: Why China is still building new coal – and when it might stop
-

 Climate Change2 years ago
嘉宾来稿:满足中国增长的用电需求 光伏加储能“比新建煤电更实惠”
-

 Renewable Energy12 months ago
Sending Progressive Philanthropist George Soros to Prison?
-
Climate Change2 years ago
Bill Discounting Climate Change in Florida’s Energy Policy Awaits DeSantis’ Approval
-
Greenhouse Gases1 year ago
嘉宾来稿:探究火山喷发如何影响气候预测
-

 Climate Change2 years ago
Analysis: China’s CO2 falls 1% in Q2 2024 in first quarterly drop since Covid-19